11 October 2022: Clinical Research
Development of a Practical Screening Tool to Predict Sarcopenia in Patients on Maintenance Hemodialysis
Xiaoju Du12ABCDEF, Guanjie Chen3ABCE, Hailin Zhang1ADG*, Yuping Liu4BD, Feng Gu4BF, Ying Wang2BD, Lixia Yin5DGDOI: 10.12659/MSM.937504
Med Sci Monit 2022; 28:e937504


Abstract
BACKGROUND: Sarcopenia is a common complication in maintenance hemodialysis (MHD) and can increase patient hospitalization and mortality. No simple and reliable tools to identify sarcopenia exist. We aimed to develop a screening tool to predict MHD patients at high risk for sarcopenia.
MATERIAL AND METHODS: This cross-sectional study included 589 and 216 MHD patients for training and validation sets, respectively. We used diagnostic criteria developed by the Asian Working Group on Sarcopenia to screen for sarcopenia. The risk prediction model was established by univariate and multivariate logistic regression analyses. We used the area under the receiver operating characteristic curve (AUROC), calibration curve, Hosmer-Lemeshow test, and decision curve analysis (DCA) to evaluate the model’s discrimination ability, calibration ability, and clinical utility.
RESULTS: The incidence of sarcopenia was 17.1% in the training set and 18.1% in the validation set. We constructed prediction models applying age, body mass index, calf circumference, and serum creatinine and plotted a nomogram. The training set model had an AUROC of 0.922, sensitivity of 85.1%, specificity of 85.9%, and chi-square value (Hosmer-Lemeshow test) of 5.603 (P>0.05); the DCA diagram showed that when the threshold probability was 0 to 0.95, the model predicted a net benefit for sarcopenia in MHD patients. The validation set model had an AUROC of 0.913, sensitivity of 94.3%, specificity of 82.9%, and chi-square value (Hosmer-Lemeshow test) of 9.822 (P>0.05).
CONCLUSIONS: The screening tool has good discrimination ability, calibration ability, and clinical utility. It could help to identify MHD patients at a high risk for sarcopenia.
Keywords: Continuous Renal Replacement Therapy, sarcopenia, Risk Factors, Area Under Curve, Creatinine, Cross-Sectional Studies, Humans, Renal Dialysis
Background
Sarcopenia is a degenerative syndrome characterized by decreased skeletal muscle mass and either low muscle strength or function and is now officially recognized as a muscle disease (diagnosis code, ICD-10-MC) [1]. Maintenance hemodialysis (MHD) is one of the main renal replacement therapies for patients with end-stage renal disease. The loss of amino acids during dialysis, the increase of inflammatory factors, metabolic acidosis, mitochondrial dysfunction, and the reduction of protein intake increase the risk of sarcopenia in patients undergoing MHD [2–4]. Some studies have shown that the prevalence of sarcopenia in MHD patients is 3.9% to 63.3% [5–7]. Sarcopenia increases the risk of frailty, falls, fractures, cardiovascular complications, and death in patients on MHD, thus changing their lifestyle and reducing their quality of life [7,8]. Patients actively seeking effective interventions, such as exercise training and nutritional support, as well as their combination, seems promising [9,10]. In 2018, the European Working Group on Sarcopenia in Older People (EWGSOP) emphasized that early screening of patients at a high risk for sarcopenia and providing early interventions have important clinical significance [1]. Therefore, intervention in the early stages of sarcopenia may be a valuable opportunity to delay its progression.
The diagnosis of sarcopenia requires not only a decrease in muscle mass but also a decrease in muscle strength and/or physical performance [11]. Muscle strength is commonly assessed by hand grip strength (HGS), whereas physical performance is assessed by usual gait speed [1,11]. The measurement of muscle mass is the first and necessary step for diagnosing sarcopenia, and sarcopenia in patients on MHD is also mainly determined by muscle mass [12]. Muscle quantity or mass is generally diagnosed using techniques such as dual-energy X-ray absorptiometry, bioelectrical impedance analysis, magnetic resonance imaging, and computed tomography [1,11]. Unfortunately, the recommended diagnostic procedure for sarcopenia is complex and requires special equipment. Recently, researchers have developed simple sarcopenia screening tools in the general population based on general demographic data and anthropometric indicators [13].
Currently, there are no studies on screening tools for sarcopenia in patients on MHD. Therefore, we designed and conducted an analysis using easily obtained parameters to develop a practical screening tool for sarcopenia in patients on MHD. The model we constructed can be used clinically, and the sarcopenia status of patients on MHD can be preliminarily judged through routine examination indicators, demographic data, or some simple questionnaires.
Material and Methods
STUDY POPULATION:
This study was conducted in the blood purification centers of 2 tertiary hospitals, and 589 patients on MHD who underwent hemodialysis between May and September 2020 were selected as the training set. The inclusion criteria were age ≥18 years, meeting the diagnostic criteria for chronic kidney disease stage 5 (eGFR <15 mL/min), steady dialysis time ≥3 months, hemodialysis 3 times a week, clear awareness and no communication barriers, and voluntary participation in this study. The exclusion criteria were pregnancy, record of 1 month of bleeding or infection, critical illnesses (such as severe cardiopulmonary disease or advanced cancer), inability to undergo a bioelectrical impedance analysis test owing to pacemaker installation, cardiovascular stent implantation, artificial joint replacement, or amputation surgery, and patients with incomplete clinical data. This study was approved by the ethics committee of our institution, and all patients provided informed consent and voluntarily participated in this study. Data collection was performed on patients’ second and third weekly dialysis sessions.
DIAGNOSIS OF SARCOPENIA:
Similar to a previous study on sarcopenia in patients on MHD [14], we used the diagnostic criteria recommended by the Asian Sarcopenia Working Group (AWGS) [11]. The diagnosis of sarcopenia requires not only a decrease in muscle mass but also a decrease in muscle strength and/or physical performance.
The skeletal muscle index was measured by a multi-frequency bioelectrical impedance analysis device (InBody S10; InBody, Seoul, Korea) and was measured 30 min after a hemodialysis session [15]. All the patients were in a lying position, their arms were not in contact with the torso, and their feet were not in contact with each other. They were silent during the measurement and did not move their bodies. Decreased skeletal muscle mass was diagnosed when the skeletal muscle index was <7.0 kg/m2 in men and 5.7 kg/m2 in women [11].
The HGS was used to indicate muscle strength. On the day of dialysis, HGS was measured using an electronic dynamometer (EH101; Xiangshan, Guangdong, China) before the initiation of dialysis. Before the measurement, the patients were familiarized with the use of the dynamometer. The distance between the grips of the dynamometer was adjusted according to the size of the patients’ hands. With their bodies upright and their arms drooping naturally, the patients used the dominant hand to grasp the dynamometer as hard as possible, without bending their arms or waist (patients with an arteriovenous fistula used their hand without the fistula). The measurements were repeated thrice, and the maximum HGS value was recorded. Male and female patients with HGS <28 and <18 kg, respectively, were diagnosed as having decreased muscle strength [15]. Before the initiation of dialysis, the patients’ physical performance was assessed with the 6-m walk test, which involved walking a distance of 6 m at a normal speed from the beginning of the movement, without deceleration; the average speed of 2 trials was recorded. Low physical performance was defined as a 6-m walk speed <1.0 m/s [11]. HGS and walk speed were measured separately by 2 study members. Measurements were taken while the patients were waiting in the dialysis treatment waiting room for the start of dialysis, approximately 30 min before the start of dialysis treatment. After a 5-min rest period at the end of the grip strength measurement, the stride speed was measured.
DEMOGRAPHIC, COMORBIDITIES, AND BIOCHEMICAL MEASUREMENTS:
Demographic and clinical data (age, sex, marital status, education level, monthly income, duration of dialysis, and primary renal disease) were collected. The Charlson comorbidity index (CCI) was used to score the patients’ comorbidities. The CCI includes 19 comorbidities, which are weighted according to the severity of the corresponding chronic disease [16]. Lin et al [17] found that the CCI is a strong predictor of outcomes in patients on MHD and correlates with hospitalization. Fasting blood samples before dialysis and biochemistry data (albumin [Alb], hemoglobin, blood urea nitrogen, serum creatinine [Scr], calcium, phosphorus, intact parathyroid hormone, total cholesterol, and triglycerides) were analyzed using an automatic chemistry analyzer (Beckman Coulter, Brea, CA, USA).
ANTHROPOMETRIC MEASUREMENTS:
After dialysis, anthropometric measurements were performed by the same trained observers. All patients used a fixed-height meter and electronic weight scale to measure their height and weight. The formula weight (kg)/height2 (m2) was used to calculate the patients’ body mass index (BMI). With the patients standing, a flexible, non-stretchable measuring tape was used to measure the mid-arm circumference (MAC) and calf circumference (CC) to the nearest 0.1 cm. The MAC measurement was performed on the arm without an arteriovenous fistula. The CC was measured at the largest circumference of the calf without edema. We determined whether there was edema in the patient’s calf by observing and pressing the local skin of the calf. If there was no edema in both lower limbs, the CC of both lower limbs was measured and the average value was taken.
PHYSICAL ACTIVITY LEVEL:
We used the International Physical Activity Questionnaire-Short Form to assess the physical activity (PA) level of patients. The patients were asked to report the frequency and cumulative daily duration of walking, moderate PA, and high-intensity PA for at least 10 min at a time during the past week. The metabolic equivalent values for walking, moderate PA, and high-intensity PA were 3.3, 4.0, and 8.0, respectively. According to the scoring protocol, the patients’ total PA energy was calculated. The patients’ PA levels were categorized into low, moderate, and high according to the questionnaire’s manual [18].
MODIFIED QUANTITATIVE SUBJECTIVE GLOBAL ASSESSMENT:
The Modified Quantitative Subjective Global Assessment (MQSGA) evaluated the patients’ nutritional status based on 7 items: weight change, diet intake change, gastrointestinal symptoms, physiological function status, dialysis complications, decreased subcutaneous fat, and muscle loss. Each part was scored from 1 (normal) to 5 (severe), with a total score of 7 (normal) to 35 (severe malnutrition). The higher the score, the more severe the patients’ malnutrition and inflammation [19].
HOSPITAL ANXIETY AND DEPRESSION SCALE:
We used the Hospital Anxiety and Depression Scale (HADS) to assess the psychological status of patients on MHD. The HADS is mainly applied to the screening of anxiety and depression among patients in general hospitals and consists of 14 items, of which 7 items assess depression and 7 items assess anxiety. The scores of the 2 subscales range from 0 to 21 points, and a score ≥8 indicates the presence of anxiety or depression symptoms. The scores indicate the severity of the patient’s anxiety or depression state. The HADS has good reliability, and the Cronbach’s α coefficients of the overall scale, anxiety subscale, and depression subscale were 0.879, 0.806, and 0.806, respectively [20].
STATISTICAL ANALYSIS:
Continuous variables conforming to a normal distribution are presented as mean±standard deviation. Non-normally distributed continuous variables are presented as median and interquartile ranges. Categorical variables are presented as numbers and percentages. Differences between groups were compared using the chi-square test, Mann-Whitney U test, or
ESTABLISHMENT PREDICTIVE MODEL:
The variables that were statistically significant in the univariate analysis were included in the multivariate logistic regression analysis. The independent variables finally screened out through multi-factor logistic regression analysis establishment the predictive model, that is, a mathematical expression constructed from the independent variables in the regression model and their corresponding regression coefficients: RA=β1X1+β2X2+ … +βmXm, β1, β2, …, βm are regression coefficients, X1, X2, …, Xm are independent variables.
Results
CHARACTERISTICS OF THE MHD PATIENTS:
Of the 589 patients on MHD (male, 385, 65.4%; female, 204, 34.6%) in the training set, 101 (17.1%) received a diagnosis of sarcopenia. The mean patient age was 53.8±13.7 years (range, 22–88 years). A total of 331 (56.2%) patients had a dialysis duration ≥36 months; 148 (25.1%) patients had hypertension as the primary disease, 160 (27.2%) patients had diabetes, 144 (24.4%) patients had chronic glomerulonephritis, 30 (5.1%) patients had polycystic kidney disease, and 107 (18.2%) patients had other diseases. Other patient characteristics are presented in Table 1.
SCREENING OF PREDICTIVE MODEL VARIABLES:
The results of the univariate analysis (Table 1) showed that age, CCI score, MQSGA score, and depression score of patients with sarcopenia were higher than those of patients without sarcopenia, and the Alb, Scr, BMI, MAC, CC, and PA levels of patients with sarcopenia were lower than those of patients without sarcopenia, and the differences were statistically significant (P<0.05). The variables that were statistically significant in the univariate analysis (P<0.05; Table 1) were included in the multivariate logistic regression analysis, which revealed that age (odds ratio [OR], 1.085; P<0.001), BMI (OR, 0.841; P=0.010), CC (OR, 0.658; P<0.001), and SCr (OR, 0.998; P=0.029) were independent predictors of sarcopenia (Table 2).
CONSTRUCTION OF THE PREDICTIVE MODEL:
Based on the results of logistic regression analysis, the 4 variables obtained were included in the equation, and the formula of the obtained prediction model was:
The optimal cut-off value of the equation obtained from the receiver operating characteristic curve was −13.455 points, with a score ≤−13.455 indicating a low-risk population and a score >−13.455 indicating a high-risk population. In addition, we plotted a predictive nomogram for the risk of the development of sarcopenia in patients on MHD (Figure 1).
EFFECT ANALYSIS OF PREDICTION MODEL:
The AUROC of the model was 0.922 (95% confidence interval, 0.899–0.946) (Figure 2A), with a sensitivity of 85.1%, specificity of 85.9%, and Youden index of 0.710, indicating that the prediction model had good discrimination; the chi-square value of the Hosmer-Lemeshow test was 5.325 (P=0.722); in addition, the calibration curve (Figure 3A) showed that the model had good calibration.
CLINICAL APPLICATION OF PREDICTIVE MODELS:
The DCA diagram of the prediction model (Figure 4) shows that when the threshold probability of a patient was 0 to 0.95, the model predicted a net benefit for sarcopenia in MHD patients. In addition, we selected 216 patients who underwent MHD treatment in a tertiary hospital from May to July 2021 for the external validation set of the model. According to the model established in this study, 66 cases of sarcopenia were predicted to occur, of which 35 cases actually occurred; meanwhile, 150 patients were predicted not to develop sarcopenia, and, of these, 146 cases did not occur, with an accuracy of (35+146)/216=83.8%. The AUROC of the external validation of this risk prediction model was 0.913 (95% CI, 0.870–0.956) (Figure 2B), with a sensitivity of 94.3%, specificity of 82.9%, Youden index of 0.772, chi-square value (Hosmer-Lemeshow test) of 9.822 (P=0.278), and a calibration curve near the ideal curve (Figure 3B). These results suggest that predictive models have high potential for clinical application and can predict sarcopenia in patients on MHD.
Discussion
Sarcopenia seriously affects the clinical outcome of patients undergoing MHD [5,7,8,21]. Early identification and effective intervention measures have important clinical significance [1,10,11]. The diagnostic procedures for sarcopenia are complex and require expensive equipment. Previous studies have mostly focused on the risk factors of sarcopenia; however, there are many risk factors, and some controversies remain [5,21,22]. This prevents medical staff from quickly and accurately identifying high-risk patients, which limits prevention and treatment efforts.
To estimate the risk of sarcopenia in patients on MHD, we screened easily accessible clinical risk factors based on previous studies in the literature and removed confounders by multivariate analysis. We obtained a simple formula, measured its cutoff value, and constructed a visual nomogram for clinical application. To the best of our knowledge, no prior study, except for a study in older adults [13], has used regression methods to predict the risk for sarcopenia in patients on MHD. The 4 predictors in the model of this study were not opportunity-based, and they were strongly associated with sarcopenia in MHD patients.
Our study found that advanced age was a risk factor for sarcopenia in patients undergoing MHD (
Our findings showed that a low BMI was strongly associated with sarcopenia in patients on MHD (
Our results showed that a larger CC was a protective factor in MHD patients with sarcopenia (
Our results also showed that a high level of Scr was a protective factor for sarcopenia in patients on MHD (
The training set model had an AUROC of 0.922, sensitivity of 85.1%, specificity of 85.9%, and chi-square value (Hosmer-Lemeshow test) of 5.603 (
This study had some limitations. We developed and validated the prediction model in only 2 blood purification centers, and the sample size was small. Therefore, the findings cannot be generalized for all patients undergoing MHD. Moreover, because acute comorbidities could quickly influence body fluid status and body composition [33], only clinically stable patients were included in the study. Our prediction models also cannot be applied to any patient who meets the exclusion criteria of this study. We still need to verify the model in a larger MHD population from multiple sources. In clinical work, the medical staff can use this prediction model and nomogram to regularly evaluate MHD patients, and when the model score is >-13.455 or the probability of nomogram is high, it indicates that the patient is very likely to have sarcopenia and suggests that they do further diagnostic tests. Appendicular skeletal muscle mass can be assessed by dual-energy X-ray absorptiometry, computed tomography, magnetic resonance imaging, and bioelectrical impedance analysis. Muscle strength can be assessed by measuring HGS and the chair-stand test. Physical performance can be assessed by methods including the Short Physical Performance Battery, 6-m walk test, stair-climb power test, timed-up-and-go test, and 5-time chair stand test [1,11]. At present, the main intervention measures for sarcopenia in MHD patients are exercise intervention, nutrition intervention, and drug intervention [34,35]. Exercise intervention includes exercise during non-dialysis period and exercise during dialysis. The main forms of intervention include aerobic exercise, resistance exercise, and aerobic combined with resistance exercise. Resistance exercise can better prevent and treat sarcopenia and is currently the most important intervention measure [36]. Martin-Alemañy et al found that the effect of exercise combined with nutritional intervention was best [9]. In clinical practice, the medical staff should strengthen the attention to high-risk patients and patients close to high-risk, do a good job in health education for patients, develop a safe exercise prescription for them, actively supplement nutrition, and perform drug intervention when necessary.
Conclusions
The prediction model consisting of age, BMI, CC, and Scr is a simple, accurate, and reliable screening tool for predicting sarcopenia. Clinicians can use this prediction model to identify the risk of sarcopenia in patients on MHD earlier and more accurately. Healthcare providers can then offer early preventive intervention and thus improve clinical outcomes for patients on MHD.
Figures
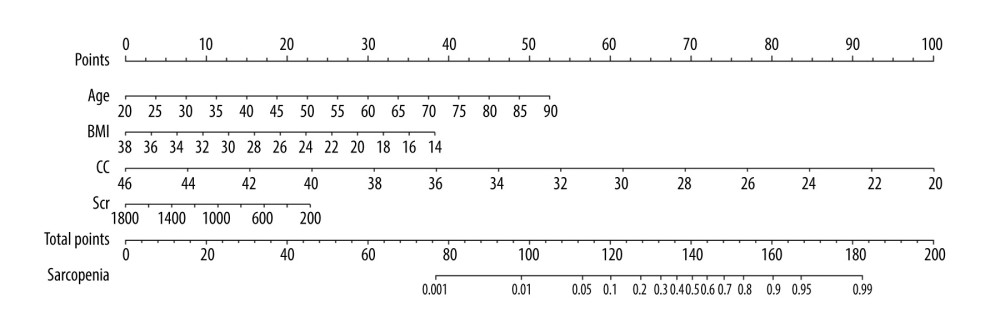 Figure 1. Predictive nomogram for the risk of sarcopenia in patients on maintenance dialysis (MHD). Each risk factor can obtain the corresponding score by referring to the score scale of the first row. The score of all existing risk factors is summed to obtain the total score. The total score is used to obtain the corresponding probability of sarcopenia in MHD patients.
 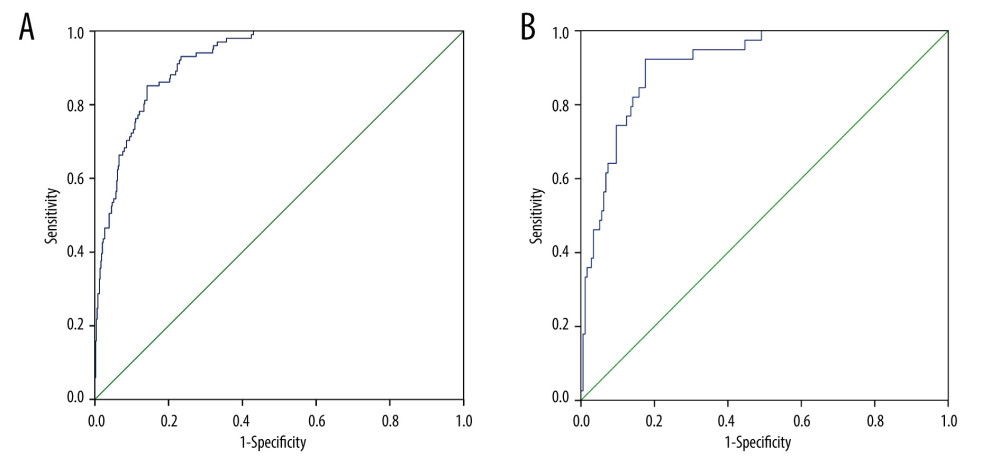 Figure 2. (A) Receiver operating characteristic (ROC) curve for the prediction of the risk of sarcopenia in patients on maintenance dialysis (MHD) in the training set. (B) ROC curve for the prediction of the risk of sarcopenia in MHD patients in the validation set.
 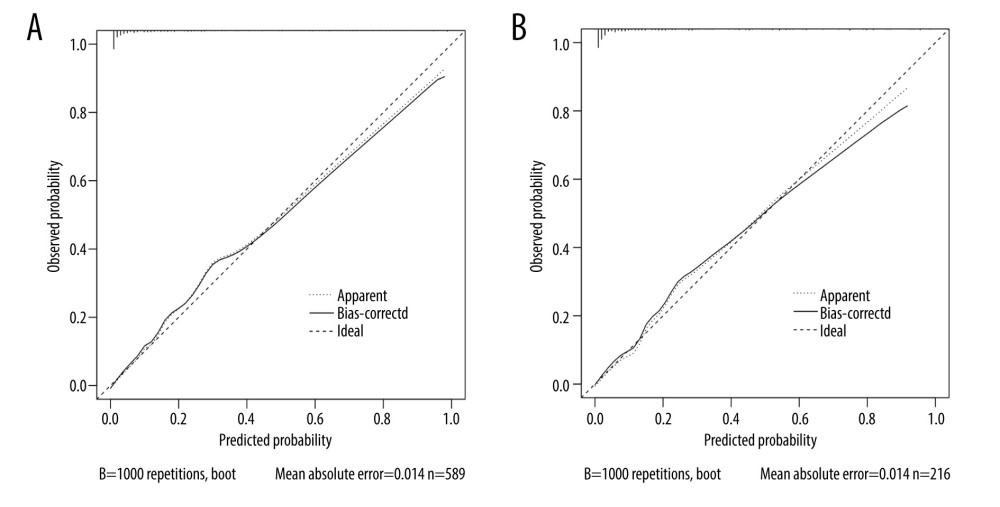 Figure 3. (A) Calibration curve for risk of sarcopenia in patients on maintenance dialysis (MHD) in the training set. The X-axis represents the predicted probability, and the Y-axis represents the actual probability. The degree of fit of the curve and diagonal reflects the calibration of the model. (B) Calibration curve for risk of sarcopenia in MHD patients in the validation set. The X-axis represents the predicted probability, and the Y-axis represents the actual probability. The degree of fit of the curve and diagonal reflects the calibration of the model.
 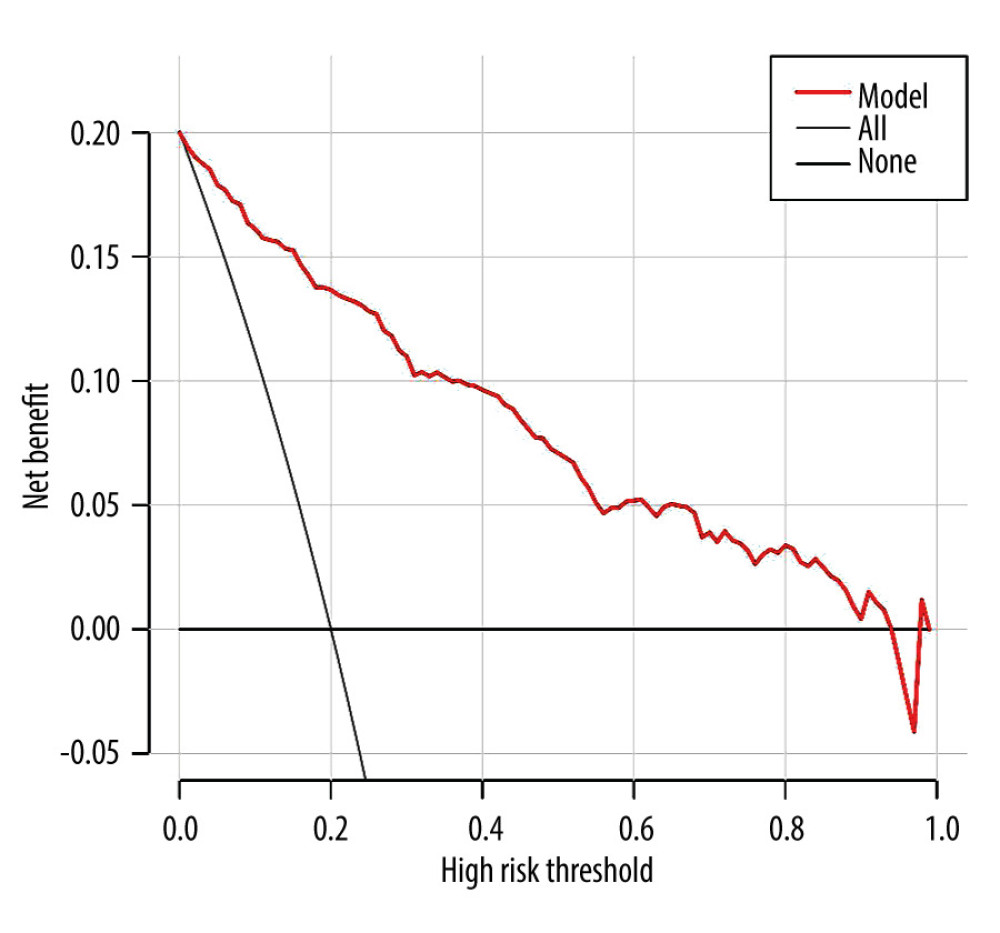 Figure 4. The decision curve analysis (DCA) curve of prediction model for predicting the risk of sarcopenia in patients on maintenance hemodialysis (MHD). The X-axis represents the threshold probability, and the Y-axis represents the net benefit rate. Horizontal lines indicate that all samples were negative and untreated, with a net benefit of 0. The slope line indicates that all samples were positive and all received intervention, and the slope of the net benefit is the reverse slope line of the negative value.
 References
1. Cruz-Jentoft AJ, Bahat G, Bauer J, Sarcopenia: Revised European consensus on definition and diagnosis: Age Ageing, 2019; 48(1); 16-31
2. Fahal IH, Uraemic sarcopenia: Aetiology and implications: Nephrol Dial Transplant, 2014; 29(9); 1655-65
3. Hendriks FK, Smeets JSJ, Broers NJH, End-stage renal disease patients lose a substantial amount of amino acids during hemodialysis: J Nutr, 2020; 150(5); 1160-66
4. Fan Z, Guo Y, Zhong X, Circulating cell-free mitochondrial DNA: A potential blood-based biomarker for sarcopenia in patients undergoing maintenance hemodialysis: Med Sci Monit, 2022; 28; e934679
5. Mori K, Nishide K, Okuno S, Impact of diabetes on sarcopenia and mortality in patients undergoing hemodialysis: BMC Nephrol, 2019; 20(1); 105
6. Lamarca F, Carrero JJ, Rodrigues JC, Prevalence of sarcopenia in elderly maintenance hemodialysis patients: The impact of different diagnostic criteria: J Nutr Health Aging, 2014; 18(7); 710-17
7. Giglio J, Kamimura MA, Lamarca F, Association of sarcopenia with nutritional parameters, quality of life, hospitalization, and mortality rates of elderly patients on hemodialysis: J Ren Nutr, 2018; 28(3); 197-207
8. Kim JK, Kim SG, Oh JE, Impact of sarcopenia on long-term mortality and cardiovascular events in patients undergoing hemodialysis: Korean J Intern Med, 2019; 34(3); 599-607
9. Martin-Alemañy G, Espinosa-Cuevas MLÁ, Pérez-Navarro M, Effect of oral nutritional supplementation with and without exercise on nutritional status and physical function of adult hemodialysis patients: A parallel controlled clinical trial (AVANTE-HEMO Study): J Ren Nutr, 2020; 30(2); 126-36
10. Dong ZJ, Zhang HL, Yin LX, Effects of intradialytic resistance exercise on systemic inflammation in maintenance hemodialysis patients with sarcopenia: A randomized controlled trial: Int Urol Nephrol, 2019; 51(8); 1415-24
11. Chen LK, Woo J, Assantachai P, Asian Working Group for Sarcopenia: 2019 consensus update on sarcopenia diagnosis and treatment: J Am Med Dir Assoc, 2020; 21(3); 300-307e2
12. Bataille S, Serveaux M, Carreno E, The diagnosis of sarcopenia is mainly driven by muscle mass in hemodialysis patients: Clin Nutr, 2017; 36(6); 1654-60
13. Ishii S, Tanaka T, Shibasaki K, Development of a simple screening test for sarcopenia in older adults: Geriatr Gerontol Int, 2014; 14(Suppl 1); 93-101
14. Matsuzawa R, Yamamoto S, Suzuki Y, The clinical applicability of ultrasound technique for diagnosis of sarcopenia in hemodialysis patients: Clin Nutr, 2021; 40(3); 1161-67
15. Tan RS, Liang DH, Liu Y, Bioelectrical impedance analysis-derived phase angle predicts protein-energy wasting in maintenance hemodialysis patients: J Ren Nutr, 2019; 29(4); 295-301
16. Charlson ME, Pompei P, Ales KL, A new method of classifying prognostic comorbidity in longitudinal studies: Development and validation: J Chronic Dis, 1987; 40(5); 373-83
17. Lin Y, Yang C, Chu H, Association between the Charlson Comorbidity Index and the risk of 30-day unplanned readmission in patients receiving maintenance dialysis: BMC Nephrol, 2019; 20(1); 363
18. Fan MY, Lv J, He PP, Chinese guidelines for data processing and analysis concerning the International Physical Activity Questionnaire: Chin J Epidemiol, 2014; 35(8); 961-64
19. Kalantar-Zadeh K, Kleiner M, Dunne E, A modified quantitative subjective global assessment of nutrition for dialysis patients: Nephrol Dial Transplant, 1999; 14(7); 1732-38
20. Zigmond AS, Snaith RP, The hospital anxiety and depression scale: Acta Psychiatr Scand, 1983; 67(6); 361-70
21. Ren H, Gong D, Jia F, Sarcopenia in patients undergoing maintenance hemodialysis: incidence rate, risk factors and its effect on survival risk: Ren Fail, 2016; 38(3); 364-71
22. Chiang JM, Kaysen GA, Segal M, Low testosterone is associated with frailty, muscle wasting and physical dysfunction among men receiving hemodialysis: a longitudinal analysis: Nephrol Dial Transplant, 2019; 34(5); 802-10
23. Yang LJ, Wu GH, Yang YL, Nutrition, physical exercise, and the prevalence of sarcopenia in elderly residents in nursing homes in China: Med Sci Monit, 2019; 25; 4390-99
24. Liguori I, Russo G, Aran L, Sarcopenia: Assessment of disease burden and strategies to improve outcome: Clin Interv Aging, 2018; 13; 913-27
25. Cruz-Jentoft AJ, Sayer AA, Sarcopenia: Lancet, 2019; 393(10191); 2636-46
26. Macedo C, Amaral TF, Rodrigues J, Malnutrition and sarcopenia combined increases the risk for mortality in older adults on hemodialysis: Front Nutr, 2021; 8; 721941
27. Reis JMS, Alves LS, Vogt BP, According to revised EWGSOP sarcopenia consensus cut-off points, low physical function is associated with nutritional status and quality of life in maintenance hemodialysis patients: J Ren Nutr, 2021; 32(4); 469-75
28. Compher C, Cederholm T, Correia MITD, Guidance for assessment of the muscle mass phenotypic criterion for the Global Leadership Initiative on Malnutrition diagnosis of malnutrition: JPEN J Parenter Enteral Nutr, 2022; 46(6); 1232-42
29. Kawakami R, Miyachi M, Sawada SS, Cut-offs for calf circumference as a screening tool for low muscle mass: WASEDA’S Health Study: Geriatr Gerontol Int, 2020; 20(10); 943-50
30. Lin YL, Liou HH, Wang CH, Impact of sarcopenia and its diagnostic criteria on hospitalization and mortality in chronic hemodialysis patients: A 3-year longitudinal study: J Formos Med Assoc, 2020; 119(7); 1219-29
31. Mae Y, Takata T, Yamada K, Creatinine generation rate can detect sarcopenia in patients with hemodialysis: Clin Exp Nephrol, 2022; 26(3); 272-77
32. Vodičar J, Pajek J, Hadžić V, Relation of lean body mass and muscle performance to serum creatinine concentration in hemodialysis patients: Biomed Res Int, 2018; 2018; 4816536
33. Tian X, Chen Y, Yang ZK, Novel equations for estimating lean body mass in patients with chronic kidney disease: J Ren Nutr, 2018; 28(3); 156-16
34. Lopes LCC, Mota JF, Prestes J, Intradialytic resistance training improves functional capacity and lean mass gain in individuals on hemodialysis: A randomized pilot trial: Arch Phys Med Rehabil, 2019; 100(11); 2151-58
35. Gao YJ, Shan Y, Du LP, Research progress on sarcopenia in end-stage renal disease patients: Chin J Nurs, 2019; 54(9); 1423-26
36. Sgrò P, Sansone M, Sansone A, Physical exercise, nutrition and hormones: Three pillars to fight sarcopenia: Aging Male, 2019; 22(2); 75-88
Figures
Figure 1. Predictive nomogram for the risk of sarcopenia in patients on maintenance dialysis (MHD). Each risk factor can obtain the corresponding score by referring to the score scale of the first row. The score of all existing risk factors is summed to obtain the total score. The total score is used to obtain the corresponding probability of sarcopenia in MHD patients.Figure 2. (A) Receiver operating characteristic (ROC) curve for the prediction of the risk of sarcopenia in patients on maintenance dialysis (MHD) in the training set. (B) ROC curve for the prediction of the risk of sarcopenia in MHD patients in the validation set.Figure 3. (A) Calibration curve for risk of sarcopenia in patients on maintenance dialysis (MHD) in the training set. The X-axis represents the predicted probability, and the Y-axis represents the actual probability. The degree of fit of the curve and diagonal reflects the calibration of the model. (B) Calibration curve for risk of sarcopenia in MHD patients in the validation set. The X-axis represents the predicted probability, and the Y-axis represents the actual probability. The degree of fit of the curve and diagonal reflects the calibration of the model.Figure 4. The decision curve analysis (DCA) curve of prediction model for predicting the risk of sarcopenia in patients on maintenance hemodialysis (MHD). The X-axis represents the threshold probability, and the Y-axis represents the net benefit rate. Horizontal lines indicate that all samples were negative and untreated, with a net benefit of 0. The slope line indicates that all samples were positive and all received intervention, and the slope of the net benefit is the reverse slope line of the negative value. Tables
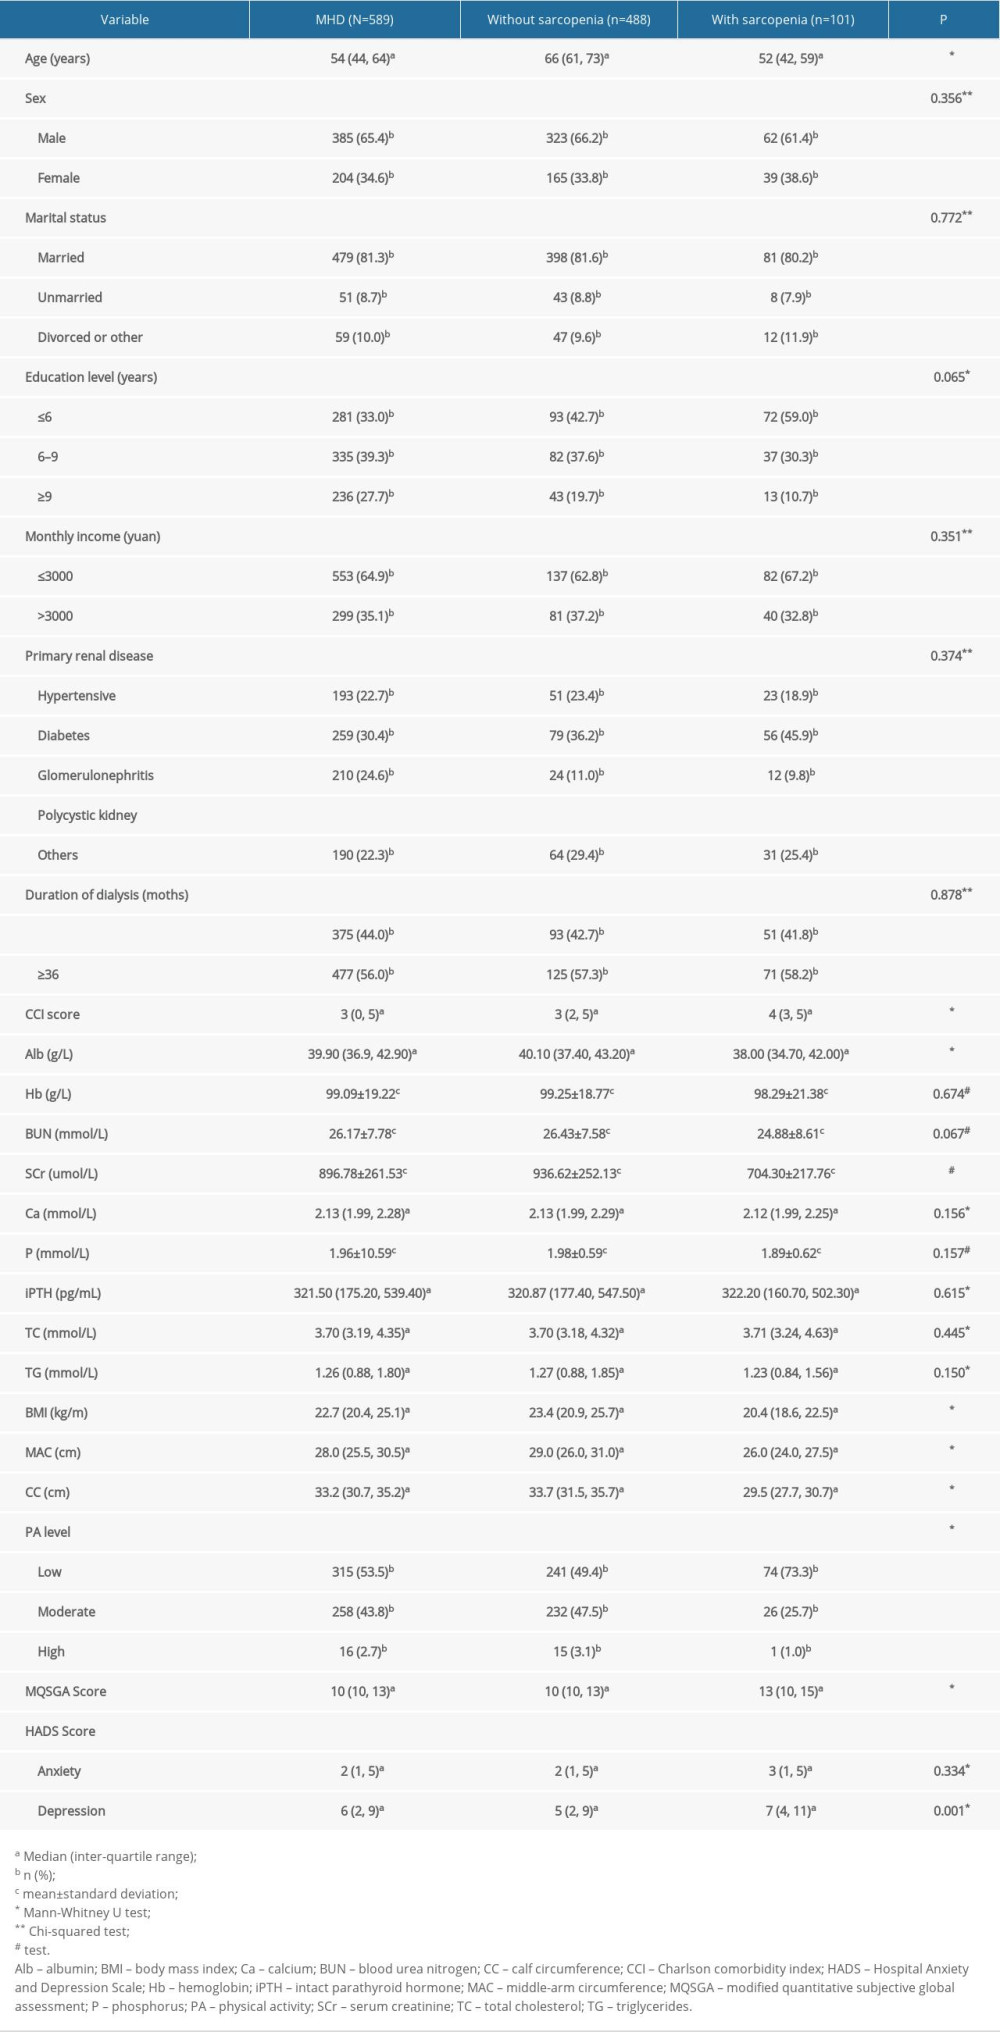 Table 1. Univariate analysis of associated factors with sarcopenia in patients on maintenance dialysis (MHD).
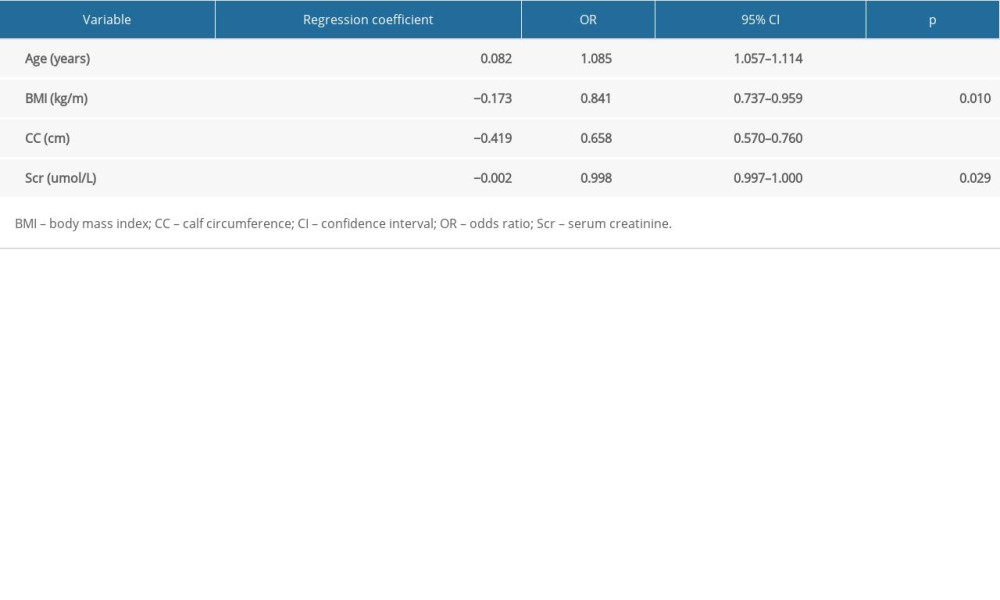 Table 2. Multivariate analysis of associated factors with sarcopenia in patients on maintenance hemodialysis (n=589).Table 1. Univariate analysis of associated factors with sarcopenia in patients on maintenance dialysis (MHD).Table 2. Multivariate analysis of associated factors with sarcopenia in patients on maintenance hemodialysis (n=589).
 In Press
Clinical Research
Comparative Effectiveness of a Nurse-Led Care Model vs Usual Care in Rheumatoid Arthritis: A Longitudinal C...Med Sci Monit In Press; DOI: 10.12659/MSM.953211
Clinical Research
Impact of Treatment Modality on Pain, Sexual Function, and Psychological Well-Being in Patients With Bartho...Med Sci Monit In Press; DOI: 10.12659/MSM.952422
Clinical Research
Association Between Radiographic Knee Osteoarthritis, Pre-Fracture Mobility, and Hip Fracture Patterns in O...Med Sci Monit In Press; DOI: 10.12659/MSM.952678
Clinical Research
Association Between Total Cholesterol–to–High-Density Lipoprotein Ratio and Gestational Hypertension: A Cas...Med Sci Monit In Press; DOI: 10.12659/MSM.952395
Most Viewed Current Articles
17 Jan 2024 : Review article 14,176,084
Vaccination Guidelines for Pregnant Women: Addressing COVID-19 and the Omicron VariantDOI :10.12659/MSM.942799
Med Sci Monit 2024; 30:e942799
13 Nov 2021 : Clinical Research 3,757,530
Acceptance of COVID-19 Vaccination and Its Associated Factors Among Cancer Patients Attending the Oncology ...DOI :10.12659/MSM.932788
Med Sci Monit 2021; 27:e932788
14 Dec 2022 : Clinical Research 2,466,116
Prevalence and Variability of Allergen-Specific Immunoglobulin E in Patients with Elevated Tryptase LevelsDOI :10.12659/MSM.937990
Med Sci Monit 2022; 28:e937990
16 May 2023 : Clinical Research 708,768
Electrophysiological Testing for an Auditory Processing Disorder and Reading Performance in 54 School Stude...DOI :10.12659/MSM.940387
Med Sci Monit 2023; 29:e940387