15 November 2023: Database Analysis
Identification of Fibrotic Biomarkers Associated with Macrophages in Diabetic Nephropathy
Rongrong Hou1DE, Lei Gao1C, Junhong Long1B, Jin Cao2F, Tao Yin3A, Jing Xu1AG*DOI: 10.12659/MSM.940847
Med Sci Monit 2023; 29:e940847


Abstract
BACKGROUND: Diabetic nephropathy (DN) is the main cause of end-stage renal disease. Renal fibrosis is an important pathological feature of kidney injury, and the therapeutic means are very limited. The functions of macrophages play important roles in renal fibrosis. There is a complicated link between altered immune metabolism and oxidative stress. Hence, we designed this study to identify the oxidative stress- and macrophage-relevant biomarkers reflecting fibrosis in DN.
MATERIAL AND METHODS: Differential expression analysis was performed based on the GSE96804 dataset. xCell and weighted gene co-expression network analysis were used to determine the distinctions in infiltrating immune cells between DN and control specimens. Gene Ontology and Kyoto Encyclopedia of Genes and Genomes enrichment analyses were conducted. A protein–protein interaction network was constructed to identify the hub genes. Hub genes were validated in an external dataset, GSE30528, and cell models.
RESULTS: MMP2, CASP3, and HIF-1α were identified as biomarkers, which were upregulated in the DN group and positively correlated with the infiltration of macrophages and M1 macrophages. In vitro, the 3 genes were highly expressed in murine MPC5 cells treated with high glucose and human THP-1 macrophages treated with advanced glycation end products.
CONCLUSIONS: Our results provided biomarkers for predicting the fibrotic progression of DN and confirmed that MMP2, CAPS3, and HIF-1α have good diagnostic value. They might be involved in the progression of DN fibrosis by regulating oxidative stress and macrophage recruitment or polarization.
Keywords: Diabetes Mellitus, Fibrosis, Kidney Diseases, Macrophages, Oxidative Stress
Background
Diabetic nephropathy (DN) is the main cause of end-stage renal disease. The annual mortality rate of diabetic patients with end-stage renal disease is approximately 20%, which is higher than that of many solid cancers, such as prostate, breast, or renal cell carcinoma [1]. Renal fibrosis is an important pathological feature of kidney injury. The entire kidney’s histological structure can be affected by fibrosis, specifically termed glomerulosclerosis, interstitial fibrosis, and perivascular fibrosis of vasculature [2]. As fibrosis progresses, kidney function is gradually lost, leading to renal failure. Currently, there are no good therapeutic means to cure or reverse renal fibrosis. The kidney has limited regenerative potential, especially the glomeruli, which renders treatment of renal fibrosis more difficult. The lack of diagnostic approaches to assess renal fibrosis is one of the factors affecting treatment [3]. Therefore, validating new biomarkers is of great significance for improving the prognosis of patients with DN.
Both the innate and adaptive immune systems play key roles in the development of DN [4]. In recent years, the role of macrophages in DN fibrosis has attracted attention [5]. Increased reactive oxygen species have been identified as the single unifying upstream event of DN [6], which mediates the infiltration of macrophages and the production of inflammatory factors, while the release of inflammatory mediators can further promote the production of reactive oxygen species [7]. It is suggested that there is crosstalk between oxidative stress and macrophages recruitment, and the two influence each other to promote the renal failure in patients with DN. However, few studies have been conducted from the perspective of combining macrophage recruitment with oxidative stress.
In the present study, we performed a systematic bioinformatics profiling via integrating oxidative stress as well as immune infiltration to identify the biomarkers for DN. Our results provide key oxidative stress-related genes associated with macrophages in DN that may reflect the progression of renal fibrosis.
Material and Methods
DATA SOURCE:
In this study, we obtained a gene expression microarray from the Gene Expression Omnibus database (
IMMUNE AND STROMAL CELL ANALYSES:
We applied the “xCell” package [8] to determine the enrichment score for each cell type and forecast the levels of infiltrating immune cells in the glomeruli of DN patients. xCell is a cell enrichment tool taking advantage of single-sample gene set enrichment analysis that calculates the scores for 64 cell types, including 34 immune cells, 30 stromal cells, and other cells. It reduces dependencies between closely related cell types through a spillover compensation technique.
WEIGHTED GENE CO-EXPRESSION NETWORK ANALYSIS AND MODULE GENE SELECTION:
Weighted gene co-expression network analysis (WGCNA) was performed via the R package “WGCNA” to identify the modules with the highest relevance to immune cells in patients with DN [9]. For the first step, hierarchical clustering was implemented on the specimens to uncover the outlier specimens and eliminate the abnormal samples. After that, to establish a scale-free network, the optimal “soft” power was determined relying on the function pickSoft Threshold. For the next step, the correlation matrix was constructed by the WGCNA software package. The optimal soft threshold was chosen to convert the correlation matrix into an adjacency matrix, and then transformed to a topological overlap matrix. Genes with similar expression patterns were categorized into gene modules, which are represented by branches of the clustering tree and different colors. Then, the correlation coefficients between differentially infiltrating immune cells and each module were counted. The modules with high linkage were deemed as candidates linked to differentially infiltrating immune cells and chosen for subsequent analyses. For the selected candidate module, we set |module membership| >0.80 and |gene significance| >0.20 as the screening standard for deciding key genes in the candidate module.
IDENTIFICATION OF DIFFERENTIALLY EXPRESSED IMMUNE-RELATED OXIDATIVE STRESS GENES:
The differentially expressed genes (DEGs) between DN and normal specimens in the GSE96804 dataset were identified deploying the “limma” R package. The parameters |log2FC| >0.585 and adjusted
KYOTO ENCYCLOPEDIA OF GENES AND GENOMES AND GENE ONTOLOGY ENRICHMENT ANALYSES:
To reveal the potential biological functions and underlying mechanisms of DEIOSGs, we used the R package “cluster Profiler” to implement Gene Ontology (GO) and Kyoto Encyclopedia of Genes and Genomes (KEGG) enrichment analyses [10]. The GO terms biological processes, cellular components, molecular functions, and KEGG pathways with adjusted P<0.05 were considered statistically significant.
CONSTRUCTION OF PROTEIN–PROTEIN INTERACTION NETWORK AND SCREENING OF HUB GENES:
To assess protein functional relationships, all DEIOSGs were linked to the Search Tools for the Retrieval of Interacting Genes database [11] (confidence=0.15), and the results were then imported into Cytoscape, which was used to visualize the protein–protein interaction (PPI) network. The plug-in in the Cytoscape software, molecular complex detection, was used to identify significant gene clusters. The nodes with the most interactions with neighboring nodes were considered as the key nodes. According to the importance of key nodes, the top 3 are selected as hub genes. Since the third of the top 3 had 2 genes in our research, 4 genes were actually obtained.
RECEIVER OPERATING CHARACTERISTIC CURVE AND EXPRESSION ANALYSIS:
Receiver operating characteristic (ROC) curves of hub genes were drawn to prove their accuracy. Specifically, the “pROC” package was used for the ROC curve profile. Relying on the area under the ROC curve (AUC) result, the hub genes with AUC >0.7 were considered as promising biomarkers for DN diagnosis [12]. The expression hub genes between DN and control specimens were visualized in the boxplots created by the “ggplot2” R package. In addition, the 4 hub genes were validated in an external dataset, GSE30528.
IN VITRO ANALYSES:
The mouse podocyte cell line, MPC5, was cultured in RPMI-1640 culture media containing 10% fetal bovine serum, 100 U/mL penicillin, and 100 μg/mL streptomycin. To induce a hyperglycemic condition, MPC5 cells were incubated in high glucose (HG; 30 mM) for 72 h, in comparison with normal glucose (5.5 mM). The expression of hub genes was measured by quantitative real-time polymerase chain reaction, according to an earlier approach [13]. All primers were used in the synthesis (GenePharma, Shanghai, China), and sequences are listed in Table 1.
Reducing sugars can react non-enzymatically with the amino groups of proteins to initiate a complex series of rearrangements and dehydrations, and then to produce a class of irreversibly cross-linked moieties called advanced glycation end products (AGEs) [14]. The AGEs can bind to AGEs receptors on the surface of macrophages to induce excessive inflammation and oxidative stress [15]. The human monocytic leukemia cell line, THP-1, was cultured in RPMI-1640 medium with 10% fetal bovine serum. Differentiation of THP-1 macrophages was induced with 100 ng/mL phorbol 12-myristate 13-acetate, followed by treatment with 200 μg/mL AGEs (Abcam, USA) for 24 h. The expression of hub genes was determined by quantitative real-time polymerase chain reaction. Tumor necrosis factor alpha (TNF-α; PT512, Beyotime Biotechnology, Shanghai, China) and superoxide dismutase (A001-3-1, Jiancheng Bioengineering Institute, Nanjing, China) were detected using enzyme-linked immunosorbent assay on the cell culture supernatant, following the manufacturer’s instructions.
STATISTICAL ANALYSIS:
GraphPad Prism 8.0 (GraphPad Software, CA, USA) and R software (version 4.2.1) were used for statistical analyses. Correlation tests were performed using Spearman analysis. The diagnostic value of hub genes was evaluated with ROC curve analysis. Hub genes were analyzed for correlation with clinical features via Pearson analysis. An unpaired
Results
IMMUNE INFILTRATING CELL ANALYSIS:
Studies have indicated that immune infiltration plays an important role in the development of DN [4]. We further explored xCell to uncover the cell types latently implicated in glomerular injury in the diabetic kidney (Figure 1). The enrichment scores of 64 cell types were obtained for each sample. Box-plot showed that 18 types of immune cells were increased in DN patients, including dendritic cells, CD4+ T cells, macrophages, M1 macrophages, and T helper 2 cells; in contrast, 3 types of immune cells, including neutrophils, natural killer cells, and T helper 1 cells, decreased. The results suggested that different immune cells might play different roles in the development of DN.
CONSTRUCTION OF CO-EXPRESSION NETWORKS:
WGCNA was used to identify the function of immune-related genes in DN. We chose β=9 (scale-free R2=0.86) as the “soft” threshold based on the scale independence and average connectivity (Figure 2A). Accordingly, 10 gene co-expression modules were generated, which are presented in different colors (Figure 2B). Proceeding further, via relevance analysis of the traits (immune cells) and modules, we detected that the yellow module was highly and positively linked to dendritic cells (Cor=0.89, P=1.2e–21), macrophages (Cor=0.81, P=2.6e–15) and M1 macrophages (Cor=0.75, P=3.2e–12) (Figure 2C). Therefore, the yellow module, containing 1000 key genes, was selected as the critical module linked to immune infiltrating cells for further analysis. The significant correlations between gene significance for macrophages/M1 macrophages and module membership are presented in the yellow module (Figure 2D).
IDENTIFICATION OF DEGS:
Differential expression analysis was implemented in the GSE96804 dataset. In total, 1507 DEGs (|log2FC| >0.585 and adjusted P<0.05) were derived, of which 568 DEGs were upregulated and 939 were downregulated. The volcano plot of the DEGs is shown in Figure 3A. The top 5 genes with the most distinct differences were MIR4521, MIR4256, MIR1256, VTRNA1-3, and SPDYE8P among the upregulated genes, and FOS, DUSP1, CXCR2, PDK4, and HSD17B14 among the downregulated genes. Meanwhile, we used the heatmap to show the top 20 genes with the most obvious differential expression between the DN and control samples (Figure 3B).
ENRICHMENT FUNCTION ANALYSIS OF DEGS:
To explore the role of DEGs in DN occurrence and development, GO and KEGG enrichment analyses were performed. In the biological processes analysis, DEGs mainly participated in small molecule catabolic process, urogenital system development, and organic acid catabolic process. In the cellular components analysis, DEGs significantly participated in collagen-containing extracellular matrix (ECM), apical part of cell, apical plasma membrane, mitochondrial matrix and peroxisomal matrix. The molecular functions result suggested that DEGs were notably linked to glycosaminoglycan binding, ECM structural constituent, and oxidoreductase activity (Figure 3C). KEGG analysis showed that the DEOSGs were primarily enriched in focal adhesion, carbon metabolism, protein digestion and absorption, AGE-RAGE signaling pathway in diabetic complications, and ECM-receptor interaction (Figure 3D).
IDENTIFICATION OF DEIOSGS AND FUNCTIONAL ENRICHMENT ANALYSIS:
A total of 464 oxidative stress-related genes were obtained from MSigDB. From the intersection of the 1507 DEGs, oxidative stress-related genes, and genes in the yellow module, 8 DEIOSGs were obtained, as shown in the Venn diagram in Figure 4A. Spearman analysis revealed significant positive correlations among the 8 DEIOSGs. Meanwhile, correlation analysis showed a significant positive correlation between the 8 DEIOSGs and the infiltration of fibroblasts, dendritic cells, macrophages, and M1 macrophages (Figure 4B, 4C). Functional similarity analysis suggested that the 8 DEIOSGs had certain similarities in function (Figure 4D).
To further realize the functions of the 8 DEIOSGs in DN, the GO terms as shown in Figure 5A–5C were used. In the biological processes analysis, DEIOSGs were mainly linked to response to oxidative stress, anatomical structure formation, circulatory system development, and ECM organization. In the cellular components analysis, DEIOSGs were notably linked in the ECM, collagen-containing ECM, myofibril, and death-inducing signaling complex. Molecular functions results suggested that DEIOSGs were notably linked to endopeptidase activity, heme binding, protease binding, interleukin-1 receptor antagonist activity, and cysteine-type endopeptidase activity involved in the apoptotic signaling pathway. KEGG analysis showed that DEIOSGs were primarily enriched in the AGE-RAGE signaling pathway in diabetic complications and the TNF signaling pathway (Figure 5D).
EXPRESSION ANALYSIS, ROC CURVE ANALYSIS, AND HUB GENE VALIDATION FOR DN DIAGNOSIS:
The 4 most important genes were selected by the PPI network (Figure 6A), namely MMP2, COL1A1, HIF-1α, and CASP3, which were significantly upregulated in the DN samples compared with in the control samples in the GSE96804 dataset (Figure 6B). To investigate the validity of these 4 genes as the diagnostic biomarkers for DN, the creation of hub single-gene ROC curves was run (Figure 6C). Notably, the AUC value for CASP3 was 0.948, which was the highest. The AUC values for COL1A1, MMP2, and HIF-1α were 0.924, 0.896, and 0.759, respectively. We next validated the 4 hub genes using an external dataset, GSE30528, as shown in Figure 6D. Except for COL1A1, the AUC areas of all other genes were >0.7 in the GSE30528 dataset. The AUC values for MMP2, CASP3, and HIF-1α were 0.966, 0.803, and 0.795, respectively. The above-mentioned results illustrated that the 3 genes had good diagnostic value.
IN VITRO ANALYSES:
In MPC5 cells, compared with the control group, the HG group had increased relative mRNA expression of MMP2 (P=0.0009), CASP3 (P=0.0049), and HIF-1α (P=0.001) (Figure 7A). Further, MMP2 (P=0.0064), CASP3 (P=0.0045), and HIF-1α (P=0.0015) were also highly expressed in THP-1 macrophages treated with AGEs (Figure 7B). Enzyme-linked immunosorbent assay showed decreased superoxide dismutase activity and increased TNF-α levels after AGE stimulation in THP-1 cells (Figure 7C, 7D).
Discussion
As one of the common microvascular complications of diabetes, DN is a primary contributor of end-stage renal disease, which imposes a huge medical and financial burden. Renal fibrosis is the best predictor of disease progression, and currently, the treatment methods are very limited. Macrophage infiltration and oxidative stress perform vital roles in renal fibrosis and are inseparable [16]. Some studies have identified biomarkers related to immune infiltration in DN [17], but few studies have focused on both mechanisms.
In this study, 8 DEIOSGs were identified. The enrichment results showed that the DEIOSGs were mainly involved in oxidative stress response, anatomical structure formation, circulatory system development, and ECM organization. These factors play an important role in diabetic renal fibrosis. Excessive ECM deposition is an established hallmark of renal fibrosis [18]. KEGG analysis revealed that the DEIOSGs were primarily enriched in the AGE-RAGE signaling pathway in diabetic complications and TNF and MAPK signaling pathways, consistent with the current understanding of fibrogenic pathways stimulated by HG [19]. Earlier studies showed that the nonsteroidal anti-inflammatory drug-activated gene-1, or growth differentiation factor-15, significantly reduced glycogen deposition and renal fibrosis via targeting AGE-RAGE-mediated inflammation pathways [20]. Neuregulin 4 ameliorated tubulointerstitial fibrosis and attenuated the expression of AGEs in DN through TNF-R1 signaling [21]. Multiple drugs suppressed HG-induced renal fibrosis and inflammation by inhibiting the MAPK pathway [22,23].
Further, we noted a huge difference in immune cell levels between DN and control specimens. Among the 18 types of immune cells increased in patients with DN, dendritic cells, CD4+ T cells, macrophages, M1 macrophages, and T helper 2 cells were included. The results suggest that both the innate and adaptive immune systems play a significant role in the pathogenesis of DN. Previous studies have shown that there is a high proportion of macrophages, which cause podocyte damage through multiple pathways, in patients with DN [24]. M1 macrophages and M2 macrophages are closely related to inflammatory responses, which play important roles in the process of fibrosis [25]. M1 is involved in the initiation phase of tissue damage and is related to proinflammatory functions. In contrast, the M2 phenotype is involved in the repair phase by producing anti-inflammatory cytokines, growth factor, and proangiogenic cytokines [26]. In general, in the process of kidney fibrosis, first, resident immune cells produce chemoattractant substances that enhance inflammatory responses by recruiting more M1; after that, the change in tissue environment shapes the macrophage phenotype toward M2, with functional properties that meet the tissues needing to address the danger [5]. The time course of the different phenotypes is not clear. Studies have shown that reduction of macrophage (M1 or M2) recruitment by the use of agents able to reduce its accumulation in diabetic kidneys improves renal function and fibrosis [27,28]. In our study, all DEIOSGs were positively correlated with macrophages and M1 macrophages. This may be associated with different stages of the patients. Reactive oxygen species are essential for the induction and maintenance of the M1 type of macrophage polarization [29]. Therefore, the results suggested that all 8 genes might play a part in kidney fibrosis and likely influence the development of DN through the recruitment or polarization of macrophages.
The 3 hub genes (
Oxidative stress and inflammation are important factors of programmed cell death. Apoptosis and pyroptosis, leading to the reduction of parenchymal cells, are different forms of programmed cell death in renal fibrosis. Caspases are crucial mediators of programmed cell death. Among them,
The strength of this study is the use of bioinformatics analysis and experiments to explore key oxidative stress-related genes associated with macrophages in DN, which is beneficial to better understand the pathogenesis of renal fibrosis. The hub genes have predictive value for the progression of renal fibrosis. Therapeutic strategies targeting macrophages are promising. However, this study still had a few limitations. First, validation of the hub genes in in vivo models or clinical samples is needed to confirm the current conclusions. Second, the hub genes may be involved in the progression of fibrosis by regulating oxidative stress and macrophage recruitment or polarization. Further experiments are needed to explore the exact underlying mechanisms and their interactions with other factors.
Conclusions
Our results provide new biomarkers for DN reflecting the progression of renal fibrosis. These genes were closely associated with oxidative stress and macrophage infiltration. As the interaction between oxidative stress and macrophage recruitment or polarization is complex, further research is needed to identify effective strategies.
Figures
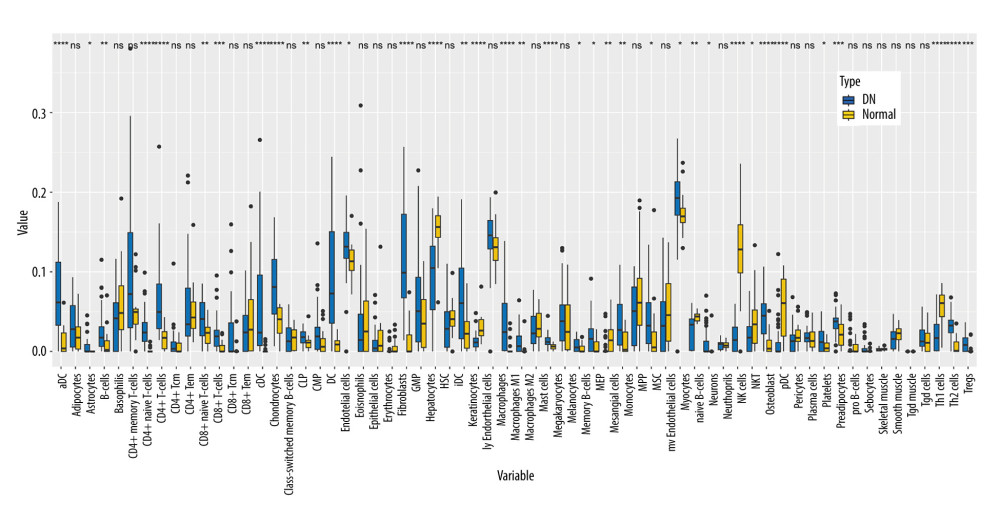 Figure 1. Immune cell infiltration analysis by xCell between diabetic nephropathy (DN) and control renal tissue in the GSE96804 dataset. The enrichment scores of 64 cell types were analyzed. (R version 4.2.1.).
 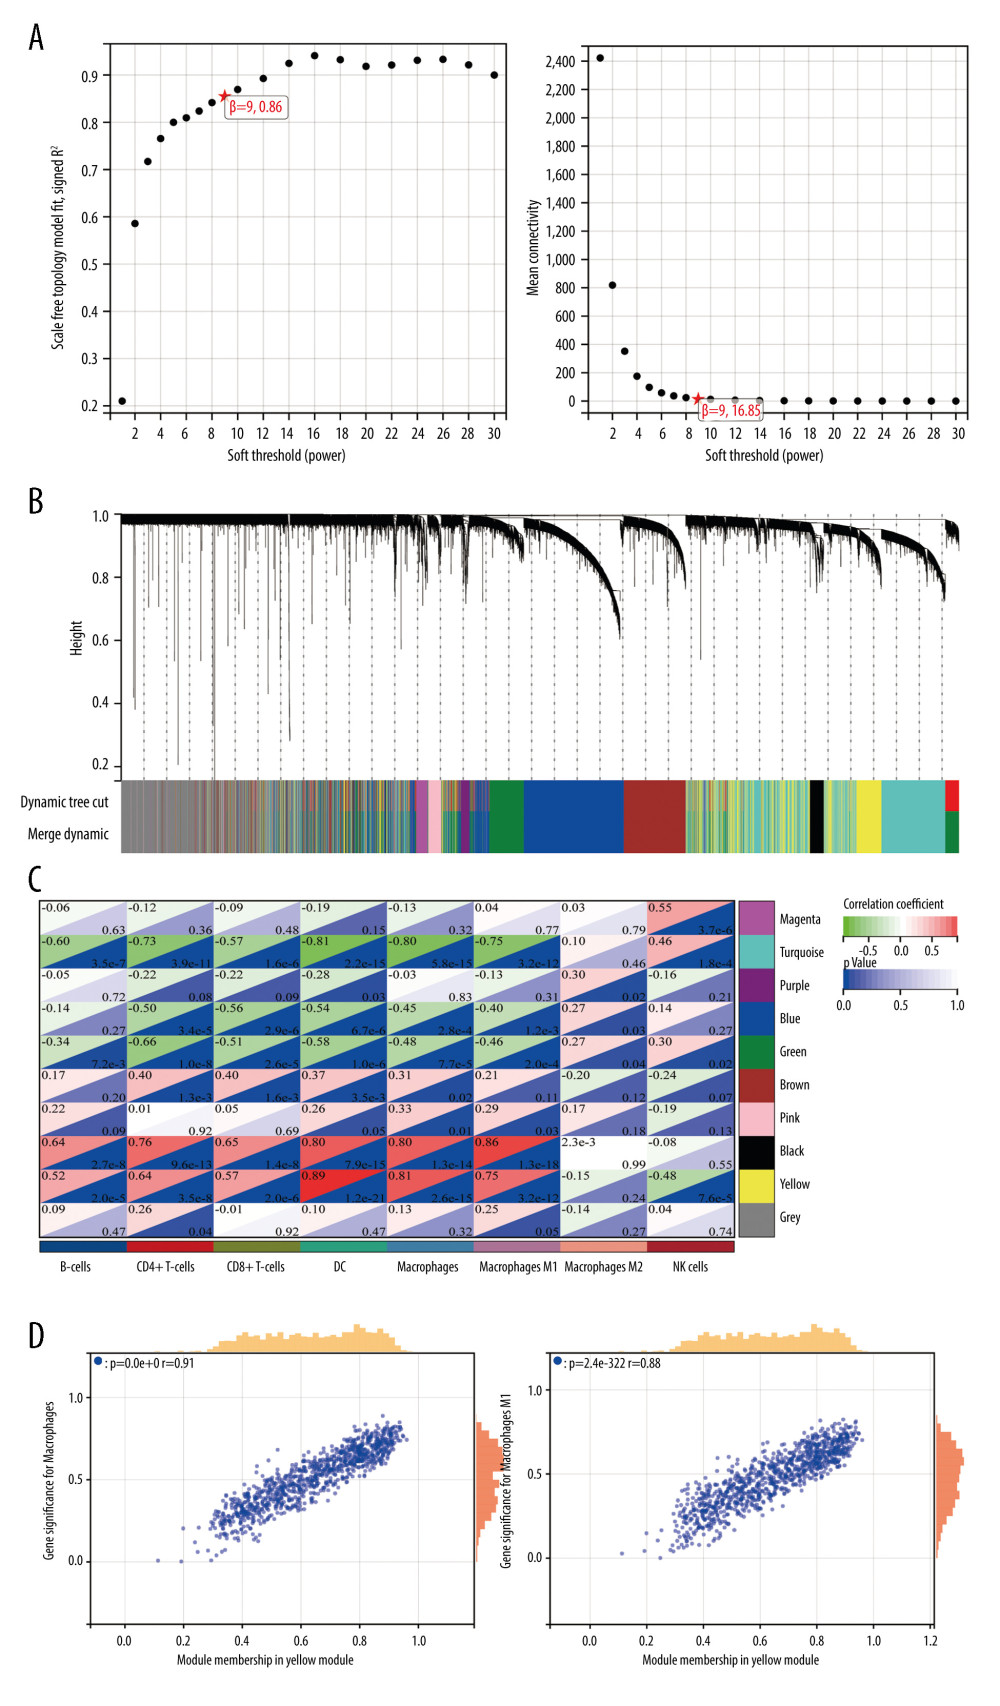 Figure 2. Weighted gene co-expression network analysis (WGCNA) co-expression network of immune-related genes. (A) The optimal soft-threshold power. Analysis of soft-thresholding powers to fit the scale-free topology model and the mean connectivity of the soft-thresholding powers; a scale-free topological criterion >0.8, 9 was chosen as the value to construct a scale-free network. (B) Dendrogram based on a dissimilarity metric for differentially expressed genes. The branches represent different gene modules, and each leaf represents a gene in the cluster dendrogram. (C) Module-trait relationships between WGCNA modules and immune cells. (D) Scatter plots of key modules. The significant correlations between gene significance (GS) for macrophages/M1 macrophages and module membership (MM) were presented in the yellow module. (R version 4.2.1.).
 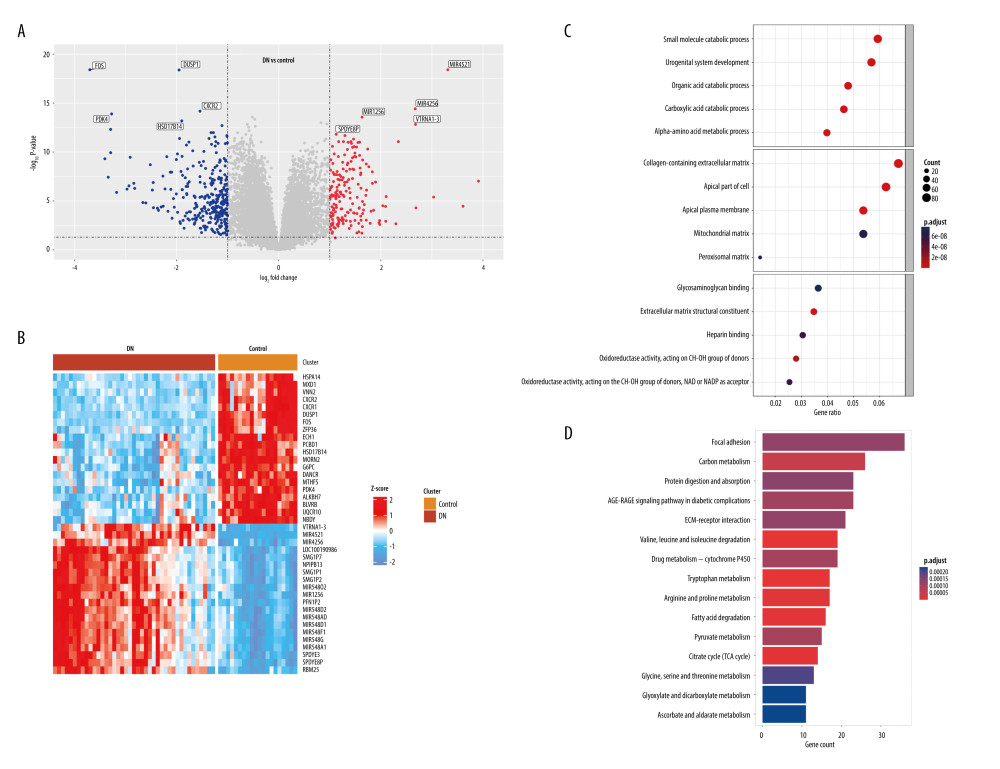 Figure 3. Identification of differentially expressed genes (DEGs) between diabetic nephropathy (DN) and control renal tissue in the GSE96804 dataset. A total of 1507 DEGs were derived, of which 568 DEGs were upregulated and 939 were downregulated. (A) Volcano plot of DEGs. (B) Heatmap of DEGs. (C, D) Gene Ontology and Kyoto Encyclopedia of Genes and Genomes analysis of DEGs. (R version 4.2.1.).
 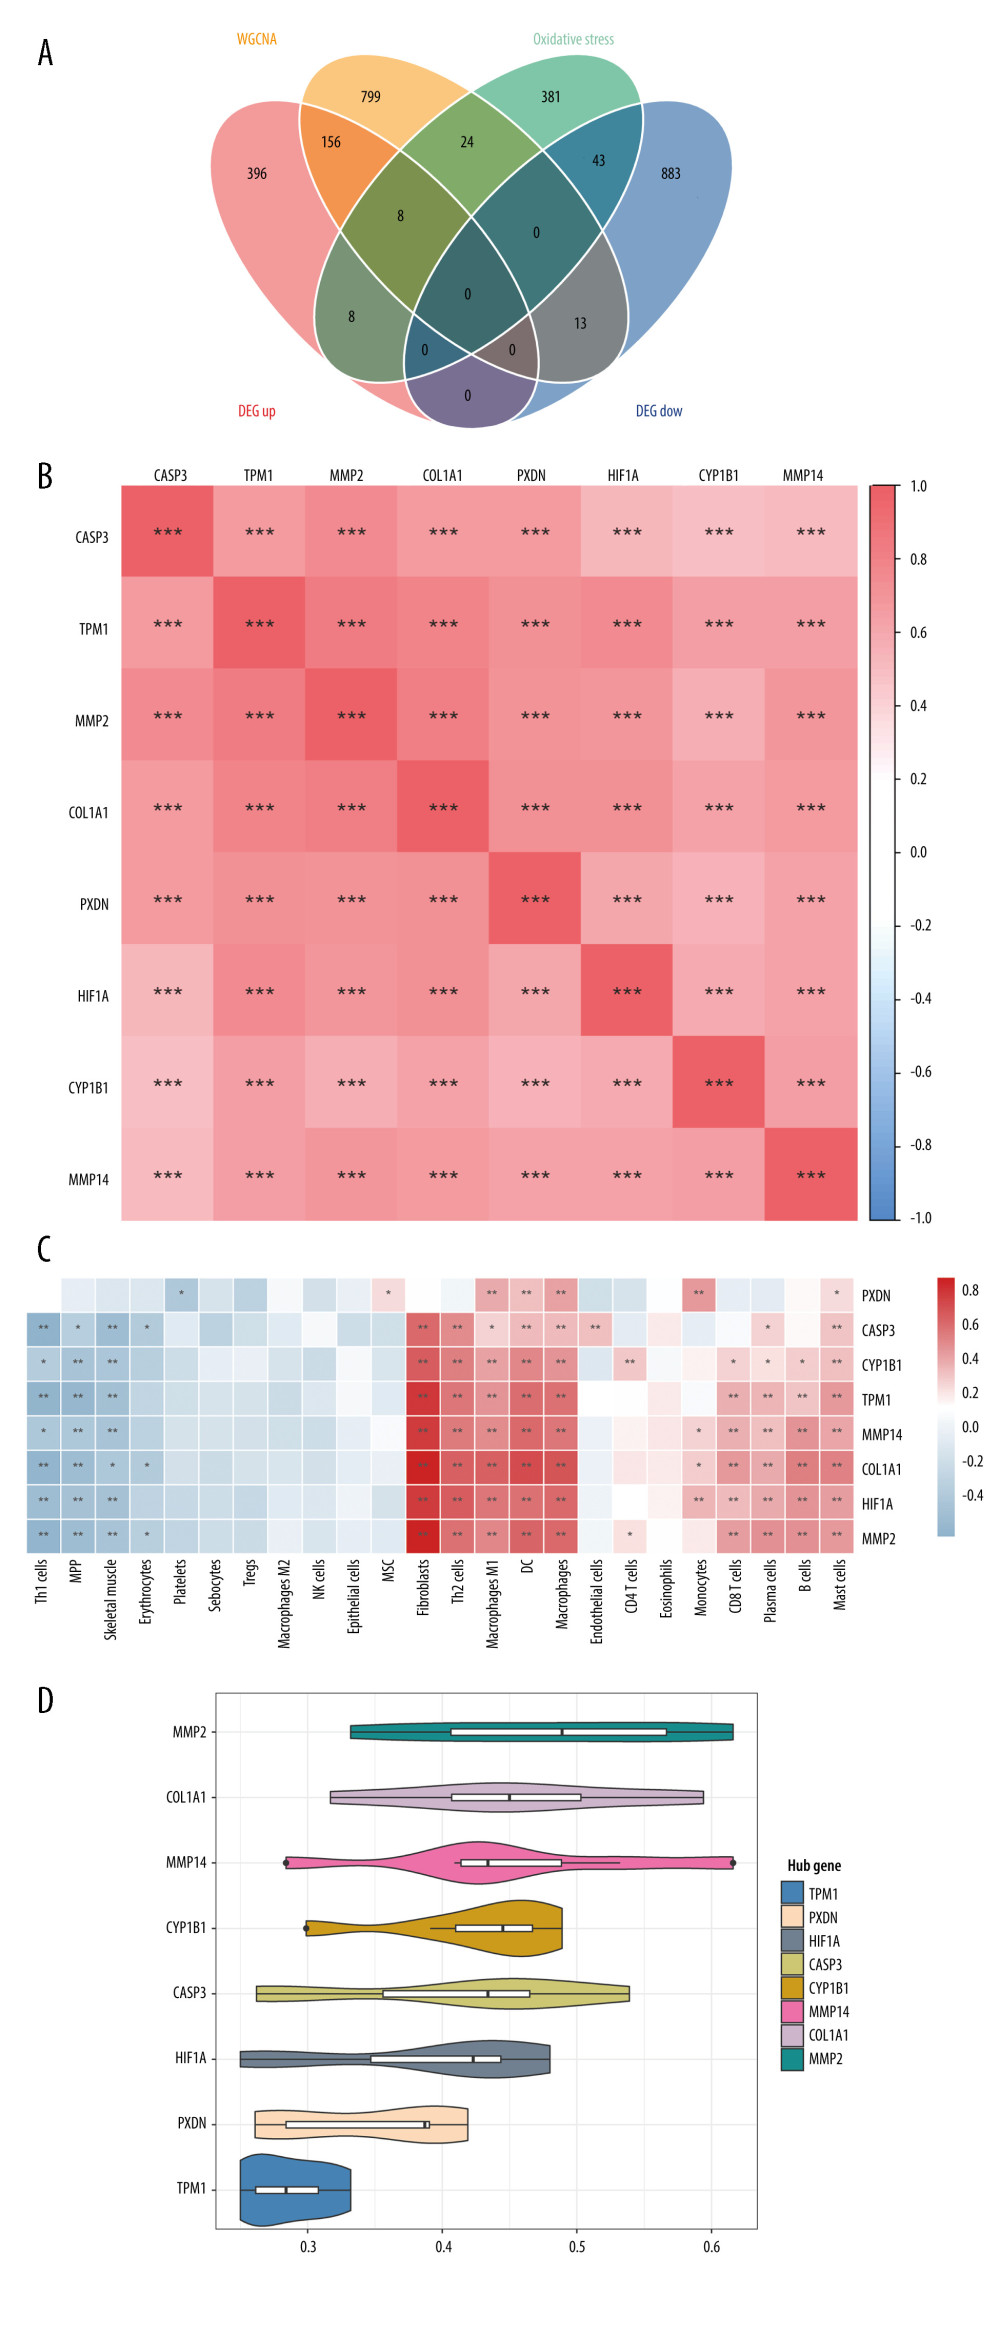 Figure 4. Identification of DEIOSGs. (A) Venn diagram of the DEGs, oxidative stress-related genes and genes in the yellow module. (B) Spearman correlation analysis of DEIOSGs. (C) Correlation between DEIOSGs with immune infiltrating cells. (D) Functional similarity of DEIOSGs. (R version 4.2.1.).
 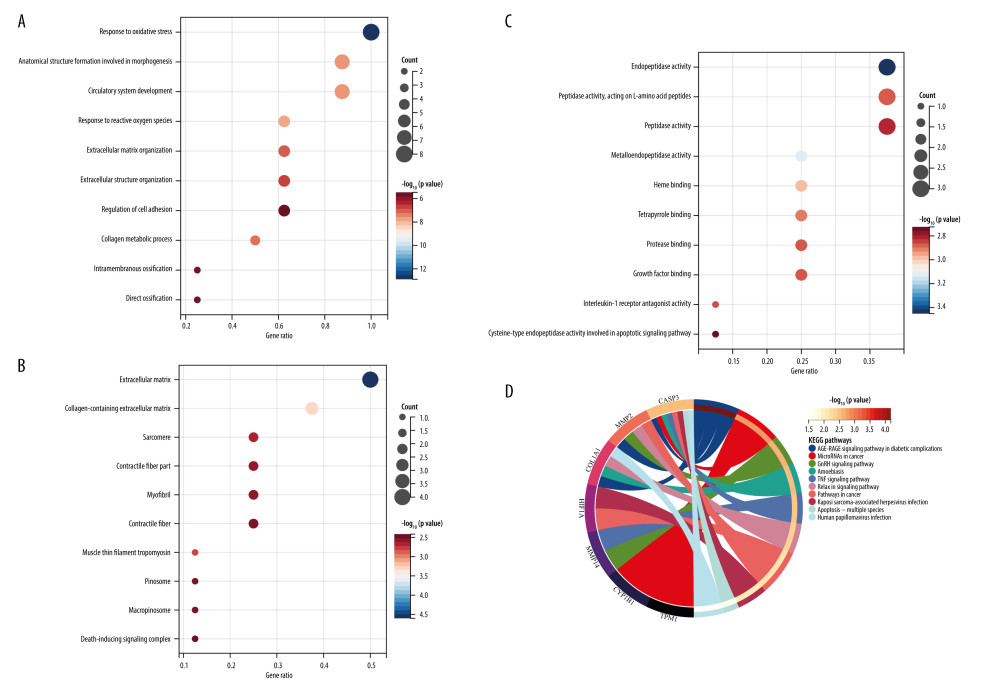 Figure 5. Gene Ontology (GO) and Kyoto Encyclopedia of Genes and Genomes (KEGG) analysis of DEIOSGs. (A–C) GO analysis of DEIOSGs. (D) KEGG analysis of DEIOSGs. (R version 4.2.1.).
 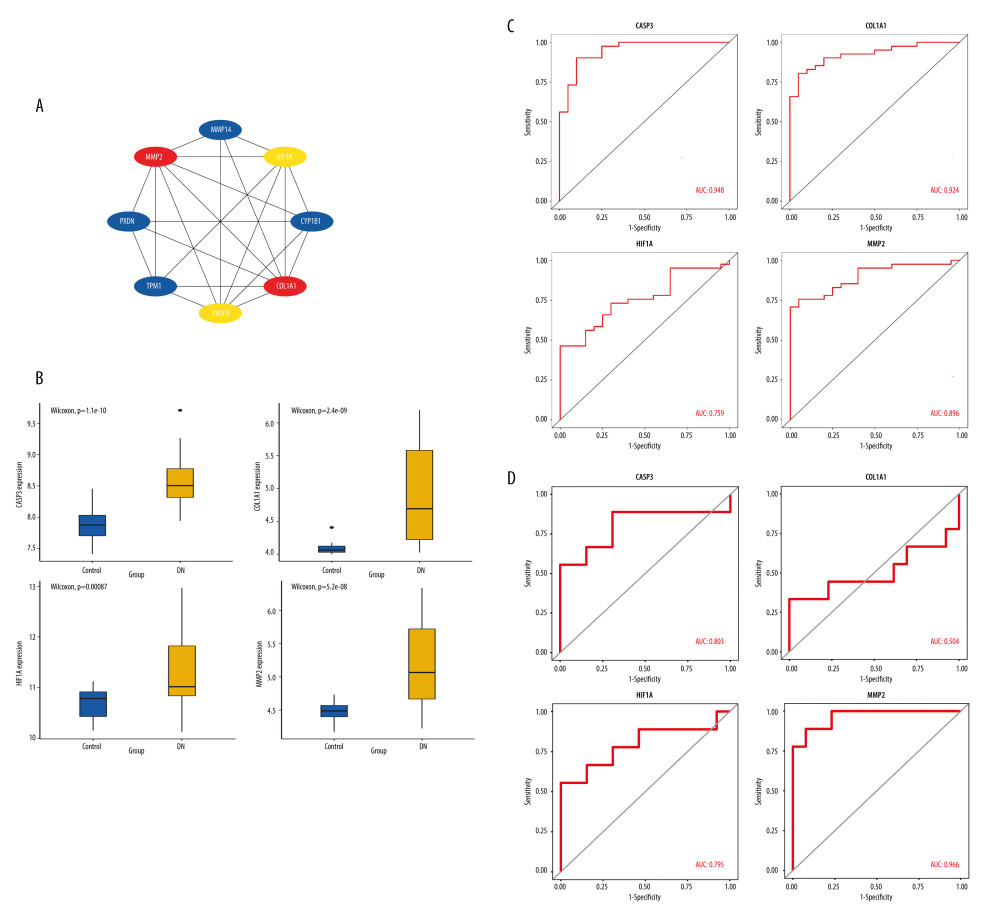 Figure 6. Construction of protein–protein interaction (PPI) network and identification of the top genes. (A) The PPI network of DEIOSGs. According to the importance of key nodes, the top 3 are selected as hub genes. Since the third of the top 3 had 2 genes in our research, 4 genes (MMP2, COL1A1, CASP3, and HIF-1α) were actually obtained. (B) Expression of hub genes in GSE96804. (C) The receiver operating characteristic (ROC) curves of hub genes in GSE96804. (D) Validation of hub genes in the external dataset GSE30528. Except for COL1A1, the area under the ROC curve areas of all other genes were >0.7 in the GSE30528 dataset. (R version 4.2.1.).
 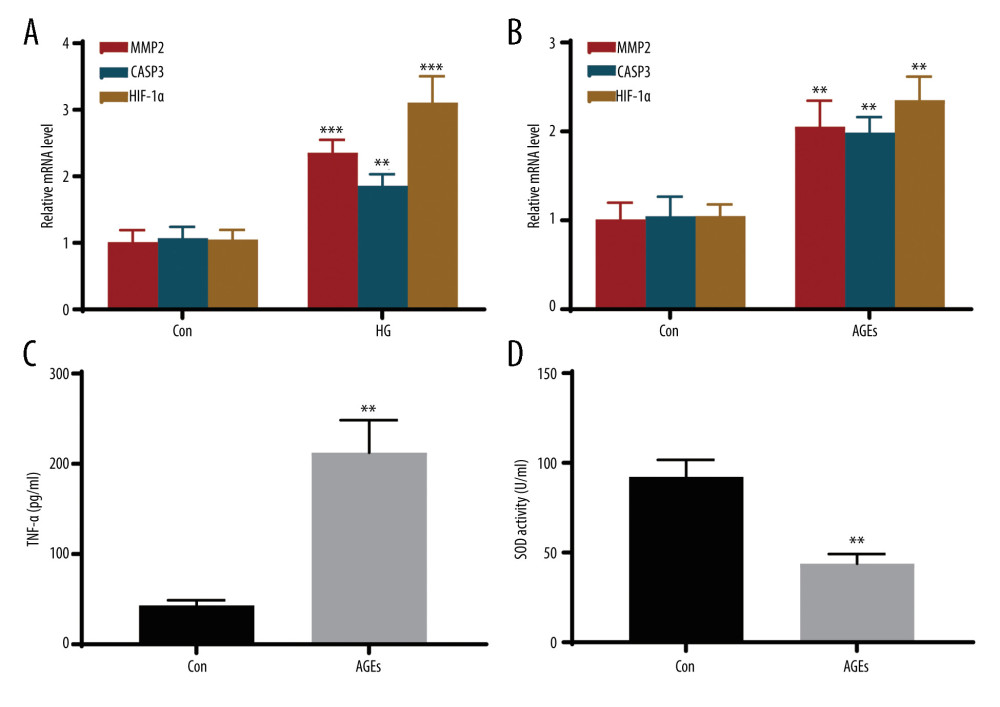 Figure 7. In vitro experiments verified the expression of hub genes. (A) Relative mRNA level of MMP2, CASP3, and HIF-1α in MPC5 cells treated with high glucose (HG). (B) Relative mRNA level of MMP2, CASP3, and HIF-1α in THP-1 cells treated with advanced glycation end products (AGEs). (C, D) The secretion of TNF-α and the activity of superoxide dismutase in THP-1 cells. *** Represents P<0.001; ** P<0.01. (GraphPad Prism version 8.0.).
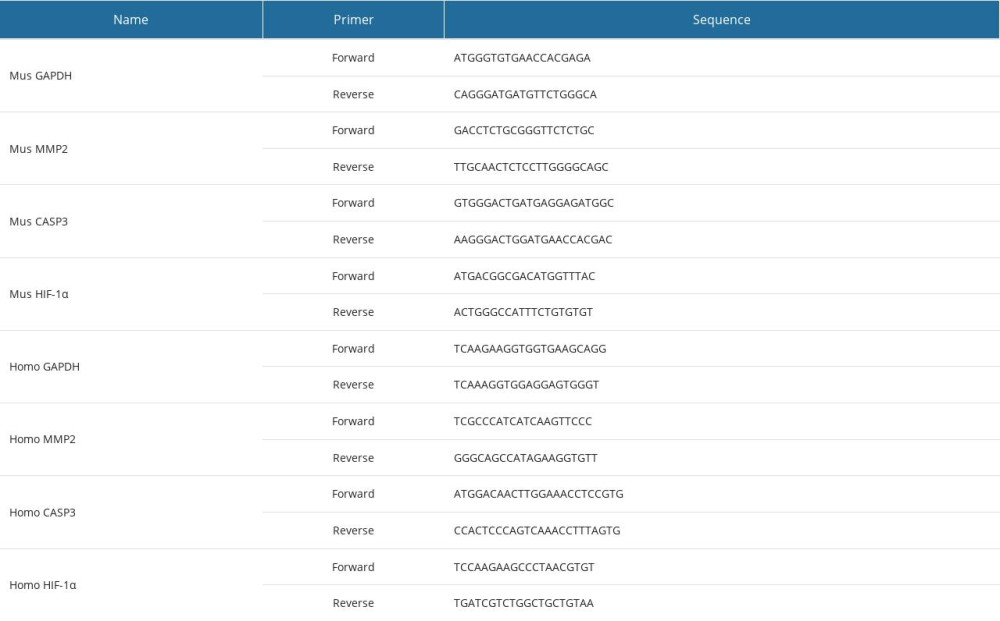
References
1. Reidy K, Kang HM, Hostetter T, Susztak K, Molecular mechanisms of diabetic kidney disease: J Clin Invest, 2014; 124(6); 2333-40
2. Djudjaj S, Boor P, Cellular and molecular mechanisms of kidney fibrosis: Mol Aspects Med, 2019; 65; 16-36
3. Klinkhammer BM, Goldschmeding R, Floege J, Boor P, Treatment of renal fibrosis-turning challenges into opportunities: Adv Chronic Kidney Dis, 2017; 24(2); 117-29
4. Tesch GH, Diabetic nephropathy – is this an immune disorder?: Clin Sci (Lond), 2017; 131(16); 2183-99
5. Calle P, Hotter G, Macrophage phenotype and fibrosis in diabetic nephropathy: Int J Mol Sci, 2020; 21(8); 2806
6. Brownlee M, The pathobiology of diabetic complications: A unifying mechanism: Diabetes, 2005; 54(6); 1615-25
7. Mittal M, Siddiqui MR, Tran K, Reactive oxygen species in inflammation and tissue injury: Antioxid Redox Signal, 2014; 20(7); 1126-67
8. Aran D, Hu Z, Butte AJ, xCell: Digitally portraying the tissue cellular heterogeneity landscape: Genome Biol, 2017; 18(1); 220
9. Langfelder P, Horvath S, WGCNA: An R package for weighted correlation network analysis: BMC Bioinformatics, 2008; 9; 559
10. Yu G, Wang LG, Han Y, He QY, clusterProfiler: An R package for comparing biological themes among gene clusters: OMICS, 2012; 16(5); 284-87
11. Szklarczyk D, Franceschini A, Wyder S, STRING v10: Protein–protein interaction networks, integrated over the tree of life: Nucleic Acids Res, 2015; 43(Database issue); D447-52
12. Wang Q, Liu B, Wang Y, The biomarkers of key miRNAs and target genes associated with acute myocardial infarction: Peer J, 2020; 8; e9129
13. Lin G, Wan X, Liu D, COL1A1 as a potential new biomarker and therapeutic target for type 2 diabetes: Pharmacol Res, 2021; 165; 105436
14. Fukami K, Yamagishi S, Coughlan MT, Ramipril inhibits AGE-RAGE-induced matrix metalloproteinase-2 activation in experimental diabetic nephropathy: Diabetol Metab Syndr, 2014; 6(1); 86
15. Yan M, Li X, Sun C, Sodium butyrate attenuates AGEs-induced oxidative stress and inflammation by inhibiting autophagy and affecting cellular metabolism in THP-1 cells: Molecules, 2022; 27(24); 8715
16. Elmarakby AA, Sullivan JC, Relationship between oxidative stress and inflammatory cytokines in diabetic nephropathy: Cardiovasc Ther, 2012; 30(1); 49-59
17. Yu K, Li D, Xu F, IDO1 as a new immune biomarker for diabetic nephropathy and its correlation with immune cell infiltration: Int Immunopharmacol, 2021; 94; 107446
18. Yuan Q, Tan RJ, Liu Y, Myofibroblast in kidney fibrosis: Origin, activation, and regulation: Adv Exp Med Biol, 2019; 1165; 253-83
19. Tuleta I, Frangogiannis NG, Diabetic fibrosis: Biochim Biophys Acta Mol Basis Dis, 2021; 1867(4); 166044
20. Chen J, Peng H, Chen C, NAG-1/GDF15 inhibits diabetic nephropathy via inhibiting AGE/RAGE-mediated inflammation signaling pathways in C57BL/6 mice and HK-2 cells: Life Sci, 2022; 311(Pt A); 121142
21. Shi J, Xu W, Zheng R, Neuregulin 4 attenuate tubulointerstitial fibrosis and advanced glycosylation end products accumulation in diabetic nephropathy rats via regulating TNF-R1 signaling: Am J Transl Res, 2019; 11(9); 5501-13
22. Wu X, Li H, Wan Z, The combination of ursolic acid and empagliflozin relieves diabetic nephropathy by reducing inflammation, oxidative stress and renal fibrosis: Biomed Pharmacother, 2021; 144; 112267
23. Ren N, Shi S, Zhao N, Zhang L, Dual specificity phosphatase 22 suppresses mesangial cell hyperproliferation, fibrosis, inflammation and the MAPK signaling pathway in diabetic nephropathy: Exp Ther Med, 2022; 24(6); 744
24. Yang H, Xie T, Li D, Tim-3 aggravates podocyte injury in diabetic nephropathy by promoting macrophage activation via the NF-kappaB/TNF-alpha pathway: Mol Metab, 2019; 23; 24-36
25. Yunna C, Mengru H, Lei W, Weidong C, Macrophage M1/M2 polarization: Eur J Pharmacol, 2020; 877; 173090
26. Wynn TA, Vannella KM, Macrophages in tissue repair, regeneration, and fibrosis: Immunity, 2016; 44(3); 450-62
27. Yang S, Ma C, Wu H, Tectorigenin attenuates diabetic nephropathy by improving vascular endothelium dysfunction through activating AdipoR1/2 pathway: Pharmacol Res, 2020; 153; 104678
28. Sun H, Tian J, Xian W, Pentraxin-3 attenuates renal damage in diabetic nephropathy by promoting M2 macrophage differentiation: Inflammation, 2015; 38(5); 1739-47
29. Rendra E, Riabov V, Mossel DM, Reactive oxygen species (ROS) in macrophage activation and function in diabetes: Immunobiology, 2019; 224(2); 242-53
30. Cruz JO, Silva AO, Ribeiro JM, Epigenetic regulation of the N-terminal truncated isoform of matrix metalloproteinase-2 (NTT-MMP-2) and its presence in renal and cardiac diseases: Front Genet, 2021; 12; 637148
31. Yin D, Guo Z, Zhang X, Identification of biomarkers and prediction of upstream miRNAs in diabetic nephropathy: Front Endocrinol (Lausanne), 2023; 14; 1144331
32. Kandasamy AD, Chow AK, Ali MA, Schulz R, Matrix metalloproteinase-2 and myocardial oxidative stress injury: beyond the matrix: Cardiovasc Res, 2010; 85(3); 413-23
33. Blascke de Mello MM, Parente JM, Matrix metalloproteinase (MMP)-2 activation by oxidative stress decreases aortic calponin-1 levels during hypertrophic remodeling in early hypertension: Vascul Pharmacol, 2019; 116; 36-44
34. Diwanji N, Bergmann A, Basement membrane damage by ROS- and JNK-mediated Mmp2 activation drives macrophage recruitment to overgrown tissue: Nat Commun, 2020; 11(1); 3631
35. Du X, Shimizu A, Masuda Y, Involvement of matrix metalloproteinase-2 in the development of renal interstitial fibrosis in mouse obstructive nephropathy: Lab Invest, 2012; 92(8); 1149-60
36. Takamiya Y, Fukami K, Yamagishi S, Experimental diabetic nephropathy is accelerated in matrix metalloproteinase-2 knockout mice: Nephrol Dial Transplant, 2013; 28(1); 55-62
37. Huuskes BM, Wise AF, Cox AJ, Combination therapy of mesenchymal stem cells and serelaxin effectively attenuates renal fibrosis in obstructive nephropathy: FASEB J, 2015; 29(2); 540-53
38. Feng L, Li W, Chao Y, Synergistic inhibition of renal fibrosis by nintedanib and gefitinib in a murine model of obstructive nephropathy: Kidney Dis (Basel), 2021; 7(1); 34-49
39. Beroske L, Van den Wyngaert T, Stroobants S, Molecular imaging of apoptosis: The case of Caspase-3 radiotracers: Int J Mol Sci, 2021; 22(8); 3948
40. Sheng H, Zhang D, Zhang J, Kaempferol attenuated diabetic nephropathy by reducing apoptosis and promoting autophagy through AMPK/mTOR pathways: Front Med (Lausanne), 2022; 9; 986825
41. Yang F, Zhang Z, Zhang L, Bisacurone attenuates diabetic nephropathy by ameliorating oxidative stress, inflammation and apoptosis in rats: Hum Exp Toxicol, 2022; 41; 9603271221143713
42. Li Y, Yuan Y, Huang ZX, GSDME-mediated pyroptosis promotes inflammation and fibrosis in obstructive nephropathy: Cell Death Differ, 2021; 28(8); 2333-50
43. Gonzalez FJ, Xie C, Jiang C, The role of hypoxia-inducible factors in metabolic diseases: Nat Rev Endocrinol, 2018; 15(1); 21-32
44. Hanna C, Hubchak SC, Liang X, Hypoxia-inducible factor-2alpha and TGF-beta signaling interact to promote normoxic glomerular fibrogenesis: Am J Physiol Renal Physiol, 2013; 305(9); F1323-31
45. Bai X, Li X, Tian J, Zhou Z, Antiangiogenic treatment diminishes renal injury and dysfunction via regulation of local AKT in early experimental diabetes: PLoS One, 2014; 9(4); e96117
46. Packer M, Mechanisms leading to differential hypoxia-inducible factor signaling in the diabetic kidney: Modulation by SGLT2 inhibitors and hypoxia mimetics: Am J Kidney Dis, 2021; 77(2); 280-86
47. Xiao S, Yang Y, Liu YT, Zhu J, Liraglutide regulates the kidney and liver in diabetic nephropathy rats through the miR-34a/SIRT1 pathway: J Diabetes Res, 2021; 2021; 8873956
48. Shao Y, Lv C, Wu C, Mir-217 promotes inflammation and fibrosis in high glucose cultured rat glomerular mesangial cells via Sirt1/HIF-1alpha signaling pathway: Diabetes Metab Res Rev, 2016; 32(6); 534-43
49. Jia Y, Chen J, Zheng Z, Tubular epithelial cell-derived extracellular vesicles induce macrophage glycolysis by stabilizing HIF-1alpha in diabetic kidney disease: Mol Med, 2022; 28(1); 95
50. Zheng X, Narayanan S, Xu C, Repression of hypoxia-inducible factor-1 contributes to increased mitochondrial reactive oxygen species production in diabetes: Elife, 2022; 11; e70714
Figures
Figure 1. Immune cell infiltration analysis by xCell between diabetic nephropathy (DN) and control renal tissue in the GSE96804 dataset. The enrichment scores of 64 cell types were analyzed. (R version 4.2.1.).Figure 2. Weighted gene co-expression network analysis (WGCNA) co-expression network of immune-related genes. (A) The optimal soft-threshold power. Analysis of soft-thresholding powers to fit the scale-free topology model and the mean connectivity of the soft-thresholding powers; a scale-free topological criterion >0.8, 9 was chosen as the value to construct a scale-free network. (B) Dendrogram based on a dissimilarity metric for differentially expressed genes. The branches represent different gene modules, and each leaf represents a gene in the cluster dendrogram. (C) Module-trait relationships between WGCNA modules and immune cells. (D) Scatter plots of key modules. The significant correlations between gene significance (GS) for macrophages/M1 macrophages and module membership (MM) were presented in the yellow module. (R version 4.2.1.).Figure 3. Identification of differentially expressed genes (DEGs) between diabetic nephropathy (DN) and control renal tissue in the GSE96804 dataset. A total of 1507 DEGs were derived, of which 568 DEGs were upregulated and 939 were downregulated. (A) Volcano plot of DEGs. (B) Heatmap of DEGs. (C, D) Gene Ontology and Kyoto Encyclopedia of Genes and Genomes analysis of DEGs. (R version 4.2.1.).Figure 4. Identification of DEIOSGs. (A) Venn diagram of the DEGs, oxidative stress-related genes and genes in the yellow module. (B) Spearman correlation analysis of DEIOSGs. (C) Correlation between DEIOSGs with immune infiltrating cells. (D) Functional similarity of DEIOSGs. (R version 4.2.1.).Figure 5. Gene Ontology (GO) and Kyoto Encyclopedia of Genes and Genomes (KEGG) analysis of DEIOSGs. (A–C) GO analysis of DEIOSGs. (D) KEGG analysis of DEIOSGs. (R version 4.2.1.).Figure 6. Construction of protein–protein interaction (PPI) network and identification of the top genes. (A) The PPI network of DEIOSGs. According to the importance of key nodes, the top 3 are selected as hub genes. Since the third of the top 3 had 2 genes in our research, 4 genes (MMP2, COL1A1, CASP3, and HIF-1α) were actually obtained. (B) Expression of hub genes in GSE96804. (C) The receiver operating characteristic (ROC) curves of hub genes in GSE96804. (D) Validation of hub genes in the external dataset GSE30528. Except for COL1A1, the area under the ROC curve areas of all other genes were >0.7 in the GSE30528 dataset. (R version 4.2.1.).Figure 7. In vitro experiments verified the expression of hub genes. (A) Relative mRNA level of MMP2, CASP3, and HIF-1α in MPC5 cells treated with high glucose (HG). (B) Relative mRNA level of MMP2, CASP3, and HIF-1α in THP-1 cells treated with advanced glycation end products (AGEs). (C, D) The secretion of TNF-α and the activity of superoxide dismutase in THP-1 cells. *** Represents P<0.001; ** P<0.01. (GraphPad Prism version 8.0.). In Press
18 Apr 2024 : Clinical Research
Comparative Analysis of Open and Closed Sphincterotomy for the Treatment of Chronic Anal Fissure: Safety an...Med Sci Monit In Press; DOI: 10.12659/MSM.944127
08 Mar 2024 : Laboratory Research
Evaluation of Retentive Strength of 50 Endodontically-Treated Single-Rooted Mandibular Second Premolars Res...Med Sci Monit In Press; DOI: 10.12659/MSM.944110
11 Mar 2024 : Clinical Research
Comparison of Effects of Sugammadex and Neostigmine on Postoperative Neuromuscular Blockade Recovery in Pat...Med Sci Monit In Press; DOI: 10.12659/MSM.942773
12 Mar 2024 : Clinical Research
Comparing Neuromuscular Blockade Measurement Between Upper Arm (TOF Cuff®) and Eyelid (TOF Scan®) Using Miv...Med Sci Monit In Press; DOI: 10.12659/MSM.943630
Most Viewed Current Articles
17 Jan 2024 : Review article
Vaccination Guidelines for Pregnant Women: Addressing COVID-19 and the Omicron VariantDOI :10.12659/MSM.942799
Med Sci Monit 2024; 30:e942799
14 Dec 2022 : Clinical Research
Prevalence and Variability of Allergen-Specific Immunoglobulin E in Patients with Elevated Tryptase LevelsDOI :10.12659/MSM.937990
Med Sci Monit 2022; 28:e937990
16 May 2023 : Clinical Research
Electrophysiological Testing for an Auditory Processing Disorder and Reading Performance in 54 School Stude...DOI :10.12659/MSM.940387
Med Sci Monit 2023; 29:e940387
01 Jan 2022 : Editorial
Editorial: Current Status of Oral Antiviral Drug Treatments for SARS-CoV-2 Infection in Non-Hospitalized Pa...DOI :10.12659/MSM.935952
Med Sci Monit 2022; 28:e935952