24 June 2020: Clinical Research
Comprehensive Analysis of Candidate Diagnostic and Prognostic Biomarkers Associated with Lung Adenocarcinoma
Jingyuan Li1AE, Xingyuan Liu23CF, Zan Cui1B, Guanying Han1DG*DOI: 10.12659/MSM.922070
Med Sci Monit 2020; 26:e922070
Abstract
BACKGROUND: We aimed to screen and identify central genetic and molecular targets involved in advancement of lung adenocarcinoma (LUAD) and to perform an integrated analysis and clinical validation.
MATERIAL AND METHODS: The GEO2R technique was utilized to assess differentially expressed genes (DEGs) among the gene sets GSE75037, GSE85716, and GSE118370. Subsequently, gene Ontology (GO) analyses and Kyoto Encyclopedia of Genes and Genomes (KEGG) analytical methods were executed to determine related biofunctions and signaling pathways, which were annotated with tools from the Database for Annotation, Visualization and Integrated Discovery (DAVID) resource. Then, a protein-protein interaction (PPI) network complex consisting of all detected DEGs was built with the STRING web interface. Cytohubba and MCODE plug-ins for Cytoscape software and Gene Expression Profiling Interactive Analysis (GEPIA) were employed to identify the hub genes. Finally, the mRNA expression of the identified hub genes was quantitatively validated by The Cancer Genome Atlas (TCGA) database analysis and real-time quantitative polymerase chain reaction (RT-qPCR).
RESULTS: We screened 146 upregulated DEGs and 431 downregulated DEGs with the criteria of |logFC| >1 and P<0.05, and the GO analysis indicated that DEGs were implicated in mitotic nuclear division (biological process, BP), the nucleus (cellular component, CC), and protein binding (molecular function, MF) and were associated with multiple KEGG pathways, such as the p53 signaling pathway in cancer. Then, the top 8 genes that predicted significantly different outcomes in LUAD patients were filtered from the DEGs and selected as hub genes. The TCGA database analysis and RT-qPCR results demonstrated that these genes were differentially expressed with the same trends in LUAD tissues compared with normal tissues.
CONCLUSIONS: Overall, we propose that 8 genes (PECAM1, CDK1, MKI67, SPP1, TOP2A, CHEK1, CCNB1, and RRM2) might be novel hub genes strongly associated with the progression and prognosis of LUAD.
Keywords: Biological Markers, Genes, vif, Adenocarcinoma of Lung, Biomarkers, Tumor, Computational Biology, Databases, Genetic, Gene Expression Profiling, gene ontology, Microarray Analysis, Protein Interaction Mapping, Protein Interaction Maps
Background
Lung cancer remains the principal culprit of cancer-related morbidity and mortality, accounting for 18.4% of cancer deaths based in a worldwide survey, corresponding to approximately 1.8 million deaths [1]. Lung adenocarcinoma (LUAD), which habitually occurs in peripheral portions of the lungs, is overtaking lung squamous cell carcinoma (LUSC) as the top prevailing pathological type of lung cancer and is characterized by glandular differentiation and/or mucin production [2]. IASLC/ATS/ERS corporately released a current multidisciplinary categorization of LUAD in 2011 that includes concordant expert terminology and comprehensive diagnostic criteria [3]. It reveals the correlation between the histological subtypes of LUAD and the risk of poor prognosis through comparison and analysis of big data from patients [4]. At present, the 5-year survival rate of MIA (minimally invasive adenocarcinoma) and AIS (adenocarcinoma
High-throughput sequencing, with extended read length and appropriate stability, has become more frequently applied for the exploration of candidate genes in cancer, diabetes, autism, and other genetic diseases and further increased the probability of identifying genes in non-model species. In the field of non-small-cell lung cancer (NSCLC)-targeted therapeutic strategies, studies concentrating on MET, RAT and BRAF as targets are being carried out in addition to studies on targeting ALK, EGFR, and ROS1 [9]. LUAD, which only shows symptoms similar to general respiratory diseases in the early stage, is probably overlooked, so uncovering biomarkers will substantially augment the potential to identify molecular targets in clinical practice. In addition, screening predictive biomarkers has been confirmed to be a necessary condition for discovering targeted anticancer drugs. In addition, patients with specific subtypes could potentially be recognized by applying biomarkers that can predict targeted drug response, invasive or malignant behavior, and drug resistance mechanisms. Accordingly, the effort of unrevealing beneficial and effective biomarkers for the preclinical diagnosis and prognostic prediction of LUAD is extremely urgent.
Comprehensive analysis of the gene expression profile array using bioinformatics techniques was carried out to pinpoint various differentially expressed genes (DEGs). In the current study, upregulated DEGs (uDEGs) and downregulated DEGs (dDEGs) were filtered among thousands of DEGs in 3 GSE datasets of patients with LUAD. Subsequently, we performed Gene Ontology (GO) analyses, including results in the BP, CC and MF categories, to explore biofunctions and singling pathway enrichment; Kyoto Encyclopedia of Genes and Genomes (KEGG) analysis and protein-protein interaction (PPI) network construction was also performed with the indicated uDEGs and dDEGs. After the candidate genes were selected under certain conditions, the hub genes were obtained by survival analysis. Then, the differential messenger RNA (mRNA) expression levels of selected hub genes in LUAD tissues were confirmed by The Cancer Genome Atlas (TCGA) database analysis and real-time quantitative polymerase chain reaction (RT-qPCR). We intend to further clarify the intricate molecular biology of the pathogenesis of LUAD and substantiate potential pivotal genes that may be encouraging candidate biomarkers of diagnosis and prognosis, targets for the development of novel anticancer agents, or markers for drug resistance and precise treatment.
Material and Methods
DATA SOURCE:
GSE75037 data were detected with an Illumina HumanWG-6 v3.0 expression beadchip [10], GSE85716 analysis performed on an Agilent-062918 OE Human lncRNA Microarray V4.0 02800 [11], and GSE118370 analysis was performed on an Affymetrix Human Genome U133 Plus 2.0 Array [12]; these data were extracted from the GEO server, a free open genome database based on microarrays and sequences [13]. The characteristics of the 3 gene expression datasets are described in Table 1.
DATA PREPROCESSING:
GEO2R (
FUNCTIONAL ENRICHMENT OF OVERLAPPING UDEGS AND DDEGS:
The Database for Annotation, Visualization and Integrated Discovery (DAVID), a bioinformatics database that provides integrated and detailed biofunctional annotation information for sizable cohorts of genes or proteins [14], was applied to reveal the functional enrichment of uDEGs and dDEGs, including terms related to BP, CC, and MF. KEGG is a habitually used database for systematically uncovering the principal metabolic signaling pathways of gene expression products in cells. The DAVID web server was utilized to investigate the KEGG pathways of uDEGs and dDEGs in the current research.
PPI NETWORK COMPLEX CONSTRUCTION AND MODULE ANALYSIS:
STRING, a database to inspect interactions between recognized proteins [15], was implemented to assemble the PPI network complex of uDEGs and dDEGs. Cytoscape is a public serviceable program for improved visualization of interaction networks between molecules with integrated data [16]. The cytoHubba plug-in in Cytoscape software explores considerable nodes based on the score of all 11 methods in each node in the network. Accordingly, the PPI network module with a significant gene pair (combination score >0.2) was obtained with the MCODE plug-in. MCODE clustering score >5 and number of nodes >5 were used as the cutoff values for investigating meaningful modules. DAVID was applied to explore the functional enrichment of, and pathways involved with the genes in each module.
DETERMINATION OF HUB GENES:
GEPIA, which is implemented to assess the impact of hub genes on the prognostic outcome of the occurrence and progression of LUAD, is a well-performing web server that allows for interactive analysis of the specific functions of key genes, including profile analysis of differential expression in various tumors, pathological staging analysis, and survival analysis of patients according to DEGs [17]. In the course of survival analysis, patients were separated into high and low groups according to the median expression level of each selected gene. The significance between 2 groups was determined by the log-rank T test, and hazard ratio (HR) was estimated to evaluate the association between gene expression and survival rate. Kaplan-Meier charts with valid log-rank P values (<0.05 as the cutoff criterion) were applied to assess overall survival rate (OSR) and filter the hub genes between the 2 groups. GEPIA was used to observe the recognized differentially expressed hub genes in specific clinicopathological stages of LUAD. The expression of DEGs in different pathological stages was evaluated with one-way analysis of variance.
TCGA DATABASE VALIDATION:
TCGA was utilized, which has 2.5 petabytes (PB) of detailed data on 33 cancers from no less than 10 000 patients. The hub genes were verified using the GEPIA tool based on TCGA data of LUAD and corresponding paracancerous tissues.
PATIENT SAMPLE COLLECTION:
To further validate the robustness of the hub genes identified, 28 LUAD specimens and 8 benign marginal normal lung tissues were collected in the First Affiliated Hospital of Jinzhou Medical University from January 2016 to December 2018. The characteristics of the patients participating in the study are shown in Table 2. Prior to the use of tissue samples, informed consent was obtained from all patients. The study complied with the Helsinki Declaration and was approved by the Medical Ethics Committee of Jinzhou Medical University. All specimens were classified histologically by clinical pathologists according to the 2015 World Health Organization (WHO) classification of lung tumors. Each biopsy specimen was divided into 2 parts, one for routine histological diagnosis and the other for rapid freezing in RNAlater (Invitrogen) and storage at –20°C until total RNA separation and analysis.
RT-QPCR:
Total RNA was obtained from 28 LUAD cases and 8 benign pulmonary tissue cases with TRIzol RNA separation reagent (Invitrogen) following the manufacturer’s steps, and then the SuperScript IV System kit (Invitrogen) was used to synthesize cDNA. As described in a previous study [18], TB Green Premix Ex Taq II m (Takara) was used for RT-qPCR, and a 7500 Real-Time PCR Applied Bio-system (Thermo Fisher) was utilized to examine the expression difference with GAPDH as an internal reference. The primers used to amplify PECAM1, CDK1, MKI67, SPP1, TOP2A, CHEK1, CCNB1, RRM2, and GAPDH were synthesized and constructed by GenePharma Corporation (Shanghai, China). The primer sequences are shown in Table 3. The 2−ΔΔCt method was utilized to compare the relative mRNA expression of the tumor samples and the control.
Results
DEGS SCREENING:
Criteria (|logFC| >1 and P<0.05) were adopted as thresholds for DEG filtration. Relevant data from GSE75037, GSE85716 and GSE118370 were used to estimate differentially expressed genes (DEGs) using GEO2R. A total of 577 DEGs were identified, among which 146 genes were upregulated (uDEGs) and 431 genes were downregulated (dDEGs), as demonstrated in the Venn diagram (Figure 1). The number of dDEGs exceeded the number of uDEGs. The top 5 most significant DEGs among the GSE75037, GSE85716 and GSE118370 datasets are presented in Table 4.
PATHWAY ENRICHMENT ANALYSIS:
The outcomes of uDEGs GO analysis demonstrated that mitotic nuclear division, nucleus, and protein binding were the most crucial terms in the BP, CC, and MF categories, respectively. The dDEGs GO analysis results indicated that positive regulation of transcription from the RNA polymerase II promoter, integral component of the membrane, and protein binding were the most significant terms in the BP, CC, and MF categories (Table 5). KEGG analysis was conducted on the uDEGs and dDEGs to further explore the key pathways involved. The uDEGs were generally implicated in the p53 signaling pathway, cell cycle, and oocyte meiosis signaling pathway, and the dDEGs were substantially implicated in the pathways in cancer, cAMP signaling pathway, and neuroactive ligand-receptor interaction signaling pathway (Table 6). These significantly enriched GO terms and pathways could be revealed to further apprehend the function of these DEGs in the occasion and progress of LUAD.
PPI NETWORK AND MODULE ANALYSIS:
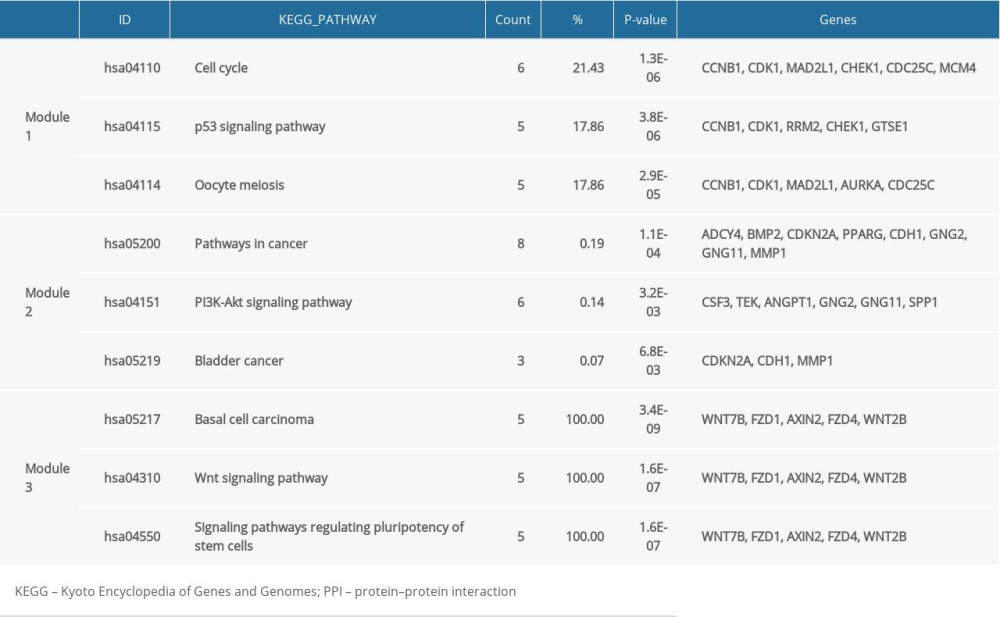
The PPI network was constructed by using STRING to retrieve interactions between genes. The established PPI network consisted of 577 edges and 2166 nodes (Figure 2A), with a local clustering coefficient=0.4. The top 20 highest-level central nodes, including IL6, CDH1, VWF, PECAM1, CDK1, CD34, CXCL12, JUN, BMP2, MKI67, PPARG, CTGF, COL1A1, SPP1, CAV1, TOP2A, CHEK1, CCNB1, and BDNF, were screened out with the cytoHubba plug-in. To facilitate our understanding of the DEGs, we visualized the network complex in Cytoscape software and modularized it using the plug-in MCODE to obtain 3 consequential modules including module 1 (28 nodes and 343 edges, cluster score=25.407), module 2 (28 nodes and 118 edges, cluster score=8.741) and module 3 (5 nodes and 10 edges, cluster score=5) (Figure 2B–2D). The KEGG analysis laid out 4 related signaling pathways that were principally involved in module 1, including the cell cycle, p53 signaling pathway, and oocyte meiosis; 15 related signaling pathways were considerably involved in module 2, such as pathways in cancer; 9 related signaling pathways were significantly implicated in module 3, including basal cell carcinoma and others (Table 7).
RECOGNITION OF HUB GENES:
To better define hub genes in LUAD, 3 conditions were set for hub genes: 1) the degree score of DEGs tested by cytohHubba was in the top 15; 2) DEGs were in the 3 modules obtained by MCODE; and 3) DEGs were associated with the survival rate of the patients in the survival curve (Figure 3A–3H). We used the top 15 genes identified by cytoHubba and the common genes in the 3 modules as candidate genes in the PPI network and then verified whether candidate genes influenced survival, as shown by the Kaplan-Meier chart. The obtained hub genes, including PECAM1 (F value=0.308), CDK1 (F value=5.91), MKI67 (F value=6.38), SPP1 (F value=1.31), TOP2A (F value=2.88), CHEK1 (F value=7.27), CCNB1 (F value=8.88), and RRM2 (F value=9.01), had altered expression, as shown by violin charts according to the pathological stage of the patient using GEPIA (Figure 3I–3P). Among these genes, PECAM1 was downregulated, while others were upregulated in LUAD compared to normal samples.
VERIFICATION OF HUB GENES BY TCGA DATABASE ANALYSIS AND RT-QPCR:
The mRNA expression level of hub genes was verified based on TCGA database analysis, and it was revealed that the mRNA expression levels of CDK1, MKI67, SPP1, TOP2A, CHEK1, CCNB1, and RRM2 in LUAD samples were statistically higher than those in non-lung cancer samples (Figure 4A–4H). This is consistent with previous bioinformatics research.
To determine whether hub genes identified in gene chip analysis can be non-selectively used to identify LUAD patients in clinical practice, the mRNA expression discrepancy of selected hub genes in LUAD samples and normal lung cancer tissues was verified by RT-qPCR examination (Figure 4I–4P). These results showed that CDK1, MKI67, SPP1, TOP2A, CHEK1, CCNB1, and RRM2 mRNA expression levels were significantly upregulated and PECAM1 was significantly downregulated, which was consistent with the gene chip analysis results. The results of RT-qPCR confirmed that the mRNA expression of selected hub genes in human LUAD tissues was higher than that in the control tissues, suggesting that these 8 hub genes might be new genetic markers for LUAD patients.
Discussion
Previous preclinical and clinical studies revealed a partial understanding of the underlying genetic mechanism of LUAD; nevertheless, the incidence and mortality rates of LUAD are continually increasing [5]. The rapid advancement of high-throughput technology has led to the identification of massive cohorts of applicable biomarkers, such as microRNAs (miRNAs) and long non-coding RNAs (lncRNAs), that can be used for early diagnosis, prognosis, and treatment decision making for many diseases, including LUAD [19]. In the current research, 3 gene expression profiling sets were subjected to integrated analysis, and 577 DEGs were identified, including 146 uDEGs and 431 dDEGs. Functional annotation of uDEGs and dDEGs was divided into 3 groups according to GO terminology (BP, CC, and MF), and KEGG pathway enrichment of uDEGs and dDEGs was analyzed by the DAVID database. In line with KEGG pathway enrichment analysis, the uDEGs were mainly implicated in the pathways in cancer, cAMP signaling pathway, and neuroactive ligand-receptor interaction signaling pathway; the dDEGs were significantly involved in the p53 signaling pathway, cell cycle, and oocyte meiosis signaling pathway. According to previous studies [20–22], DEGs identified from LUAD are enriched in signaling pathways, such as the p53 signaling pathway, cell cycle, oocyte meiosis, pathways in cancer, cAMP signaling pathway, and neuroactive ligand-receptor interaction, which are related pathways involved in the advancement of malignant tumors.
A PPI network of uDEGs and dDEGs was constructed, and the top 15 candidate genes and the most important modules were screened based on the topological structures of the network. Through comprehensive bioinformatics analysis, 8 hub genes, including PECAM1, CDK1, MKI67, SPP1, TOP2A, CHEK1, CCNB1, and RRM2, were identified to have high connectivity and could distinguish the stage of LUAD from both benign lung disease and normal tissue. At present, the treatment options for LUAD include surgery, chemotherapy, radiotherapy and targeted drug therapy, which improve the survival of patients with mild effects [23].
Platelet and endothelial cell adhesion molecule 1 (PECAM-1) is commonly detected in vascular endothelial cells and is involved in various physiological processes, including platelet aggregation, angiogenesis, and protection of the endothelium from endotoxin stress [24]. PECAM-1 is mediated by regulation of the tumor microenvironment (TME) and tumor cell proliferation, which is related to advanced tumor metastasis progression [25], and has a distinct differential expression in hepatocellular carcinoma (HCC) [26]. Cyclin-dependent kinase-1 (CDK1), a critical regulator of the G2/M checkpoint, can directly phosphorylate HIF-1α, upregulate HIF-1α transcription, and increase the invasion and migration of tumor cells [27]. Research has revealed that the nuclear/cytoplasmic expression ratio of CDK1 was determined as a self-sufficient prognostic reference point of colorectal cancer with histochemical staining [28]. CDK1, which is an effective prognostic indicator in patients with pancreatic ductal adenocarcinoma, could promote tumor progression [29]. Marker of proliferation Ki-67 (MKI67), a peripheral part of the mitotic chromosome, keeps the chromosome from collapsing into a single chromatin mass after the disintegration of the nuclear membrane; consequently, chromosomes can independently mobilize and effectively interact with mitotic spindles. The high expression of MKI67 mRNA is actually correlated with the advanced stage of non-muscle invasive bladder cancer [30]. Ki-67 functions in the proliferation of malignant cells at the front of infiltrating tumors, which is highly correlated with the invasiveness and poor clinical outcomes of triple-negative breast cancer [31], and has great potential as a biomarker of oral squamous cell carcinoma (OSCC) [32]. Decreased expression of secreted phosphoprotein 1 (SPP1), associated with EGFR mutation, is interconnected with the improvement of the overall survival rate and recurrence-free survival rate of LUAD [33]. SPP1 in hydrothorax can be applied in the detection of malignant pleural effusion and judgment of patients with NSCLC [34]. Additionally, the overexpression of SPP1 in OSCC and HCC is related to the occurrence and progression of tumors [35,36].
The overexpression of DNA topoisomerase II alpha (TOP2A) has a negative effect on the prognosis of breast cancer patients; hence, TOP2A-targeted therapy might be beneficial to the treatment and prognosis prediction of breast cancer [37]. Patients with TOP2A-positive breast cancer are more sensitive to anthracyclines than TOP2A-negative patients [38]. TOP2A is highly expressed in more advanced uterine leiomyosarcoma with a high mitotic index but not in nonmalignant uterine diseases [39]. It has been previously reported that the protein encoded by the checkpoint kinase-1 (CHEK1) gene, which is essential for cell cycle arrest in the presence of DNA damage or unreplicated chromatid, belongs to a conserved serine/threonine kinase family. It is a meaningful oncogene associated with poor prognosis and is overexpressed in both esophageal squamous cell carcinoma and HCC [40,41]. The expression of CHEK1 can be applied not only as a prognostic indicator but also as a marker for the selection of CHEK1 inhibitors in patients with acute myeloid leukemia [42]. The high expression rate of CHEK1 in breast cancer was found to be 61%, and high expression was related to tumor size, triple-negative subtype, basal phenotype, epithelial-stromal transformation, dysfunction of the DNA homologous repair pathway and poor prognosis [43]. Abnormal expression of cyclin B1 (CCNB1) has been observed in a variety of tumors, including pituitary adenomas, and increases moderately with the escalation of invasiveness [18]. CCNB1 is a pivotal factor in the proliferation of hepatocellular carcinoma cells, and FOXM1 binds the CCNB1 promoter region to regulate the transcription of CCNB1 [44]. CCNB1 is an influential biomarker for the prognosis of estrogen receptor (ER)+ breast cancer; targeting CCNB1 can prevent or even reverse resistance to hormone therapy and facilitate personalized treatment [45]. The expression of ribonucleotide reductase regulatory subunit M2 (RRM2) correlates with clinical stage and is increased significantly in neuroblastoma compared to adjacent benign tissues [46]. HPVE7 facilitates to RRM2 upregulation and promotes the occurrence of cervical carcinoma through angiogenesis induced by Ros-ERK1/2-HIF-1, and α-VEGF. The overexpression of RRM2 is intimately related to the occurrence and progression of human ovarian carcinoma and breast cancer [47,48].
Conclusions
8 hub genes in LUAD were identified from hundreds of candidate DEGs. The hub genes were markedly correlated with the overall survival of LUAD patients, and their expression was histologically validated. Studies have shown that dysregulated gene expression can lead to the occurrence of tumors. This study improves our understanding of the molecular determinants of LUAD progression and the expression reliability of biomarkers and provides new biomarkers that may potentially support the diagnosis and precise identification of treatment targets for LUAD. However,
Figures
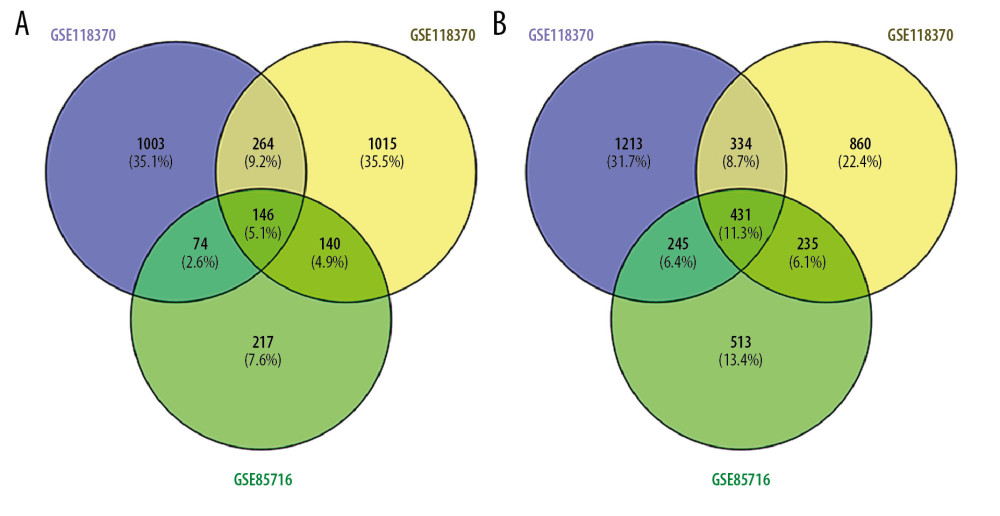 Figure 1. Venn diagram presenting the overlapping (A) uDEGs and (B) dDEGs in the 3 GEO datasets. In total, 146 uDEGs and 431 dDEGs were commonly identified between LUAD and corresponding normal adjacent lung samples. uDEGs – upregulated differentially expressed genes; dDEGs – downregulated differentially expressed genes; LUAD – lung adenocarcinoma.
 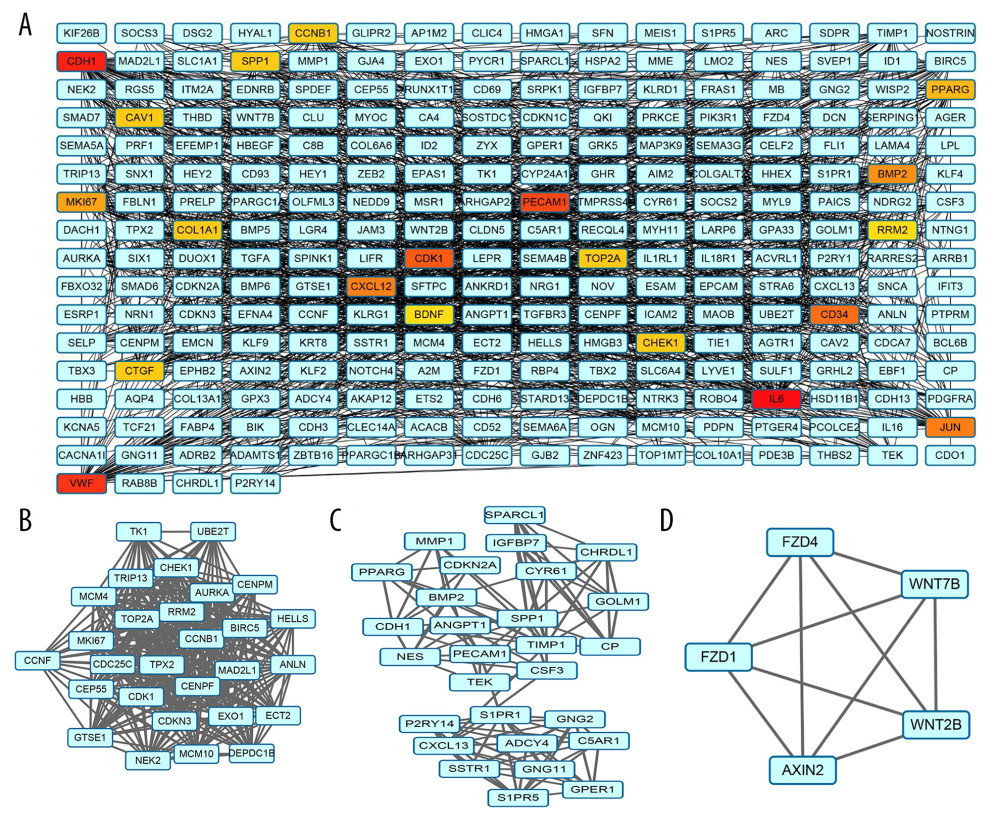 Figure 2. Construction of the protein-protein interaction (PPI) network complex with the STRING database and acquisition of 3 significant modules on the basis of the topological structure of the PPI network of the common uDEGs and dDEGs. (A) PPI network of uDEGs and dDEGs in LUAD tissues compared with corresponding normal adjacent tissues; (B) module 1, cluster score=25.407, 28 nodes and 343 edges; (C) module 2, cluster score=8.741, 28 nodes and 118 edges; (D) module 3, cluster score=5, 5 nodes and 10 edges. The blue squares indicate a node degree less than 30. uDEGs – upregulated differentially expressed genes; dDEGs – downregulated differentially expressed genes; LUAD – lung adenocarcinoma.
 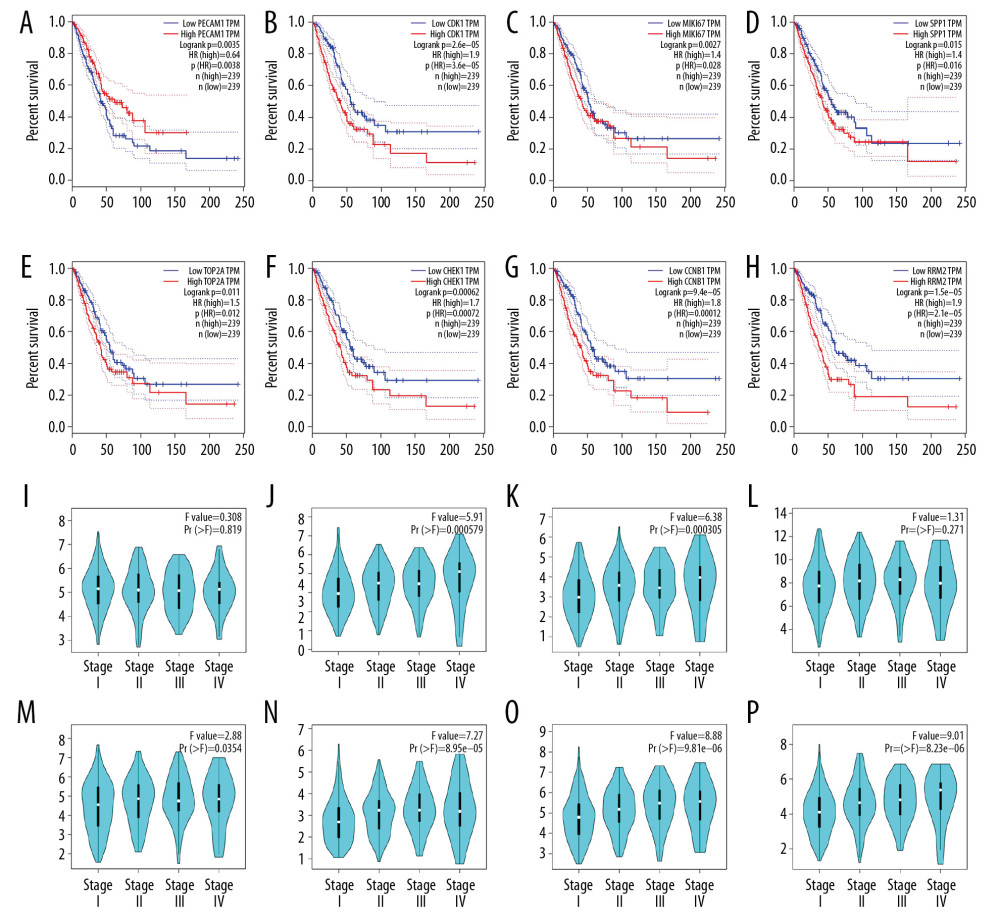 Figure 3. Kaplan-Meier survival curves indicated the prognostic value of hub genes in the form of overall survival (months) in human LUAD patients; (A) PECAM1, (B) CDK1, (C) MKI67, (D) SPP1, (E) TOP2A, (F) CHEK1, (G) CCNB1, (H) RRM2. Violin plots demonstrated an association between the pathological stage of human LUAD and the expression of 8 hub genes based on TCGA data analysis using GEPIA; (I) PECAM1, (J) CDK1, (K) MKI67, (L) SPP1, (M) TOP2A, (N) CHEK1, (O) CCNB1, (P) RRM2. LUAD – lung adenocarcinoma; TCGA – The Cancer Genome Atlas.
 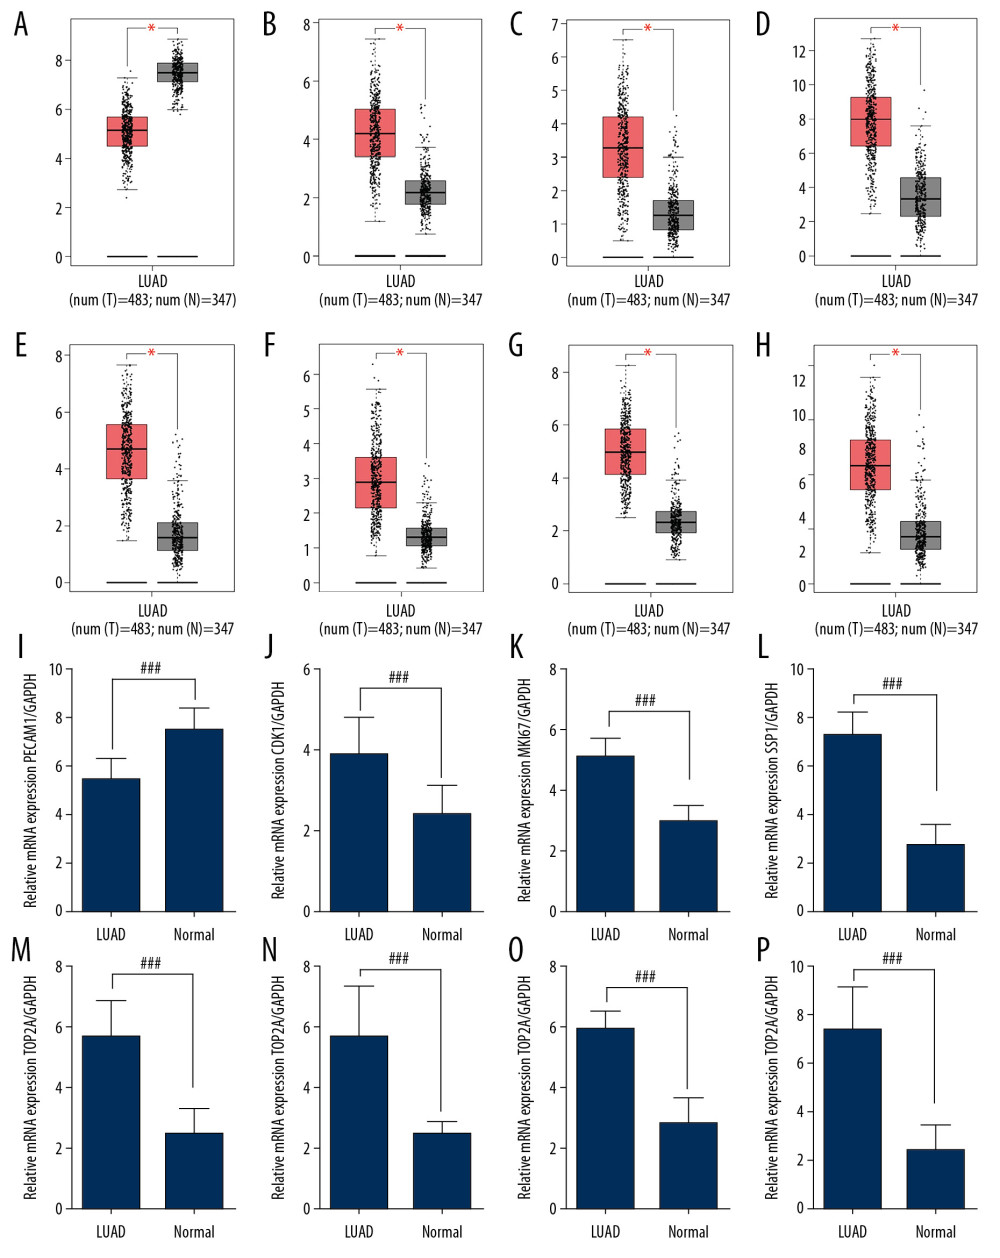 Figure 4. DEGs were validated in LUAD and normal lung tissue. The gene expression of (A) PECAM1, (B) CDK1, (C) MKI67, (D) SPP1, (E) TOP2A, (F) CHEK1, (G) CCNB1, (H) RRM2 in 483 LUAD patients and 347 normal tissues was evaluated by GEPIA. The relative mRNA expression levels of (I) PECAM1, (J) CDK1, (K) MKI67, (L) SPP1, (M) TOP2A, (N) CHEK1, (O) CCNB1, and (P) RRM2 between 28 LUAD patients and 8 normal lung tissues were determined by RT-qPCR. All data are shown as the mean±SD, ### P<0.001 versus the normal group. DEGs – differentially expressed genes; LUAD – lung adenocarcinoma; GEPIA – Gene Expression Profiling Interactive Analysis; mRNA – messenger RNA; RT-qPCR – real-time quantitative polymerase chain reaction; SD – standard deviation.
 Tables
Table 1. The main features of 3 studies of GEO gene expression microarray data.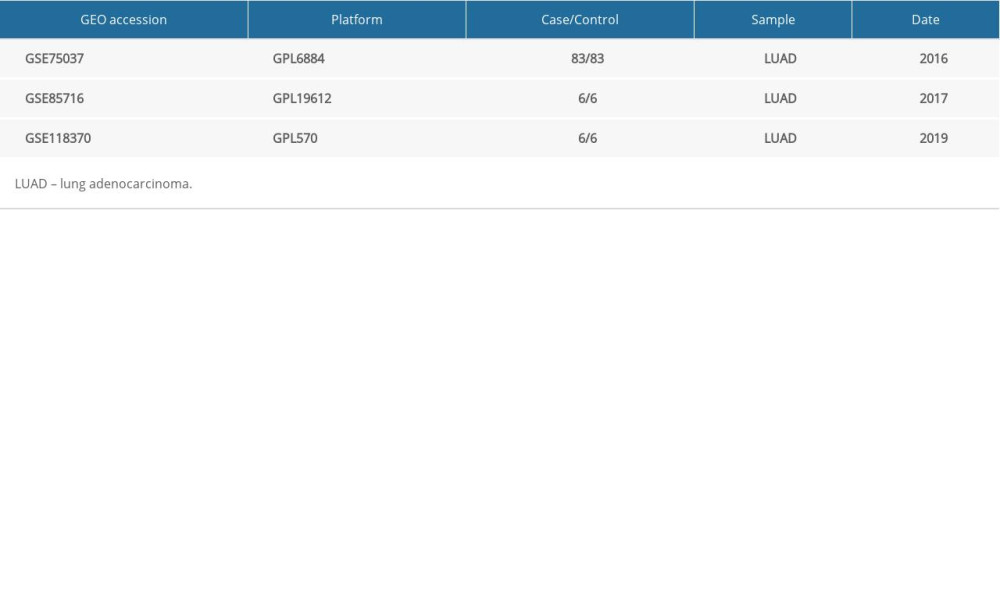 Table 2. Clinicopathologic features of patients with LUAD in JMU.
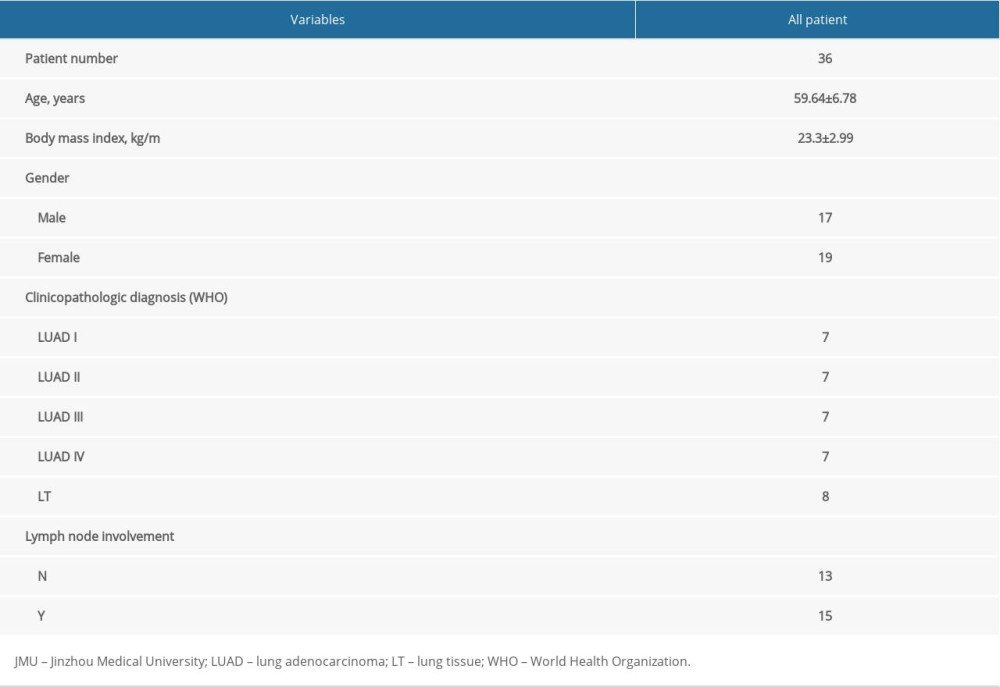 Table 3. Primer pair sequences for RT-qPCR of PECAM1, CDK1, MKI67, SPP1, TOP2A, CHEK1, CCNB1, RRM2, and GAPDH.
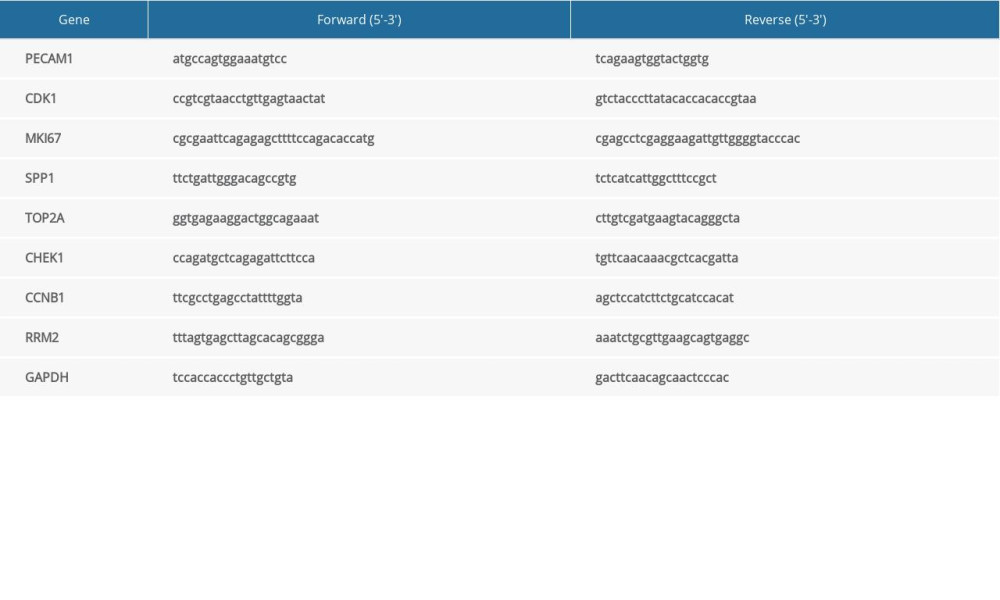 Table 4. The most significant 5 uDEGs and 5 dDEGs in GSE75037, GSE85716, and GSE118370 datasets.
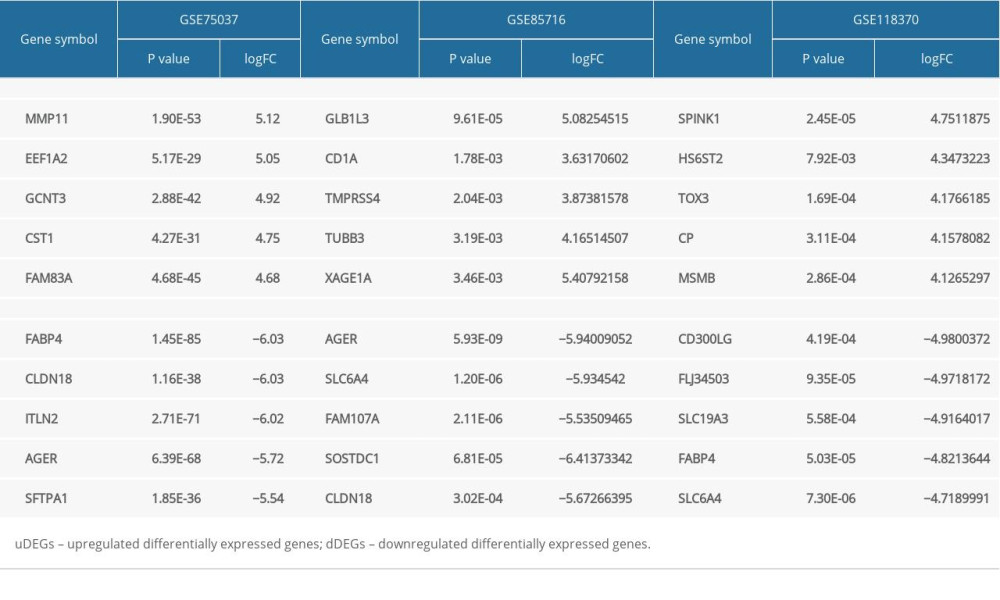 Table 5. TOP 5 GO function annotation of common uDEGs and dDEGs associated with LUAD.
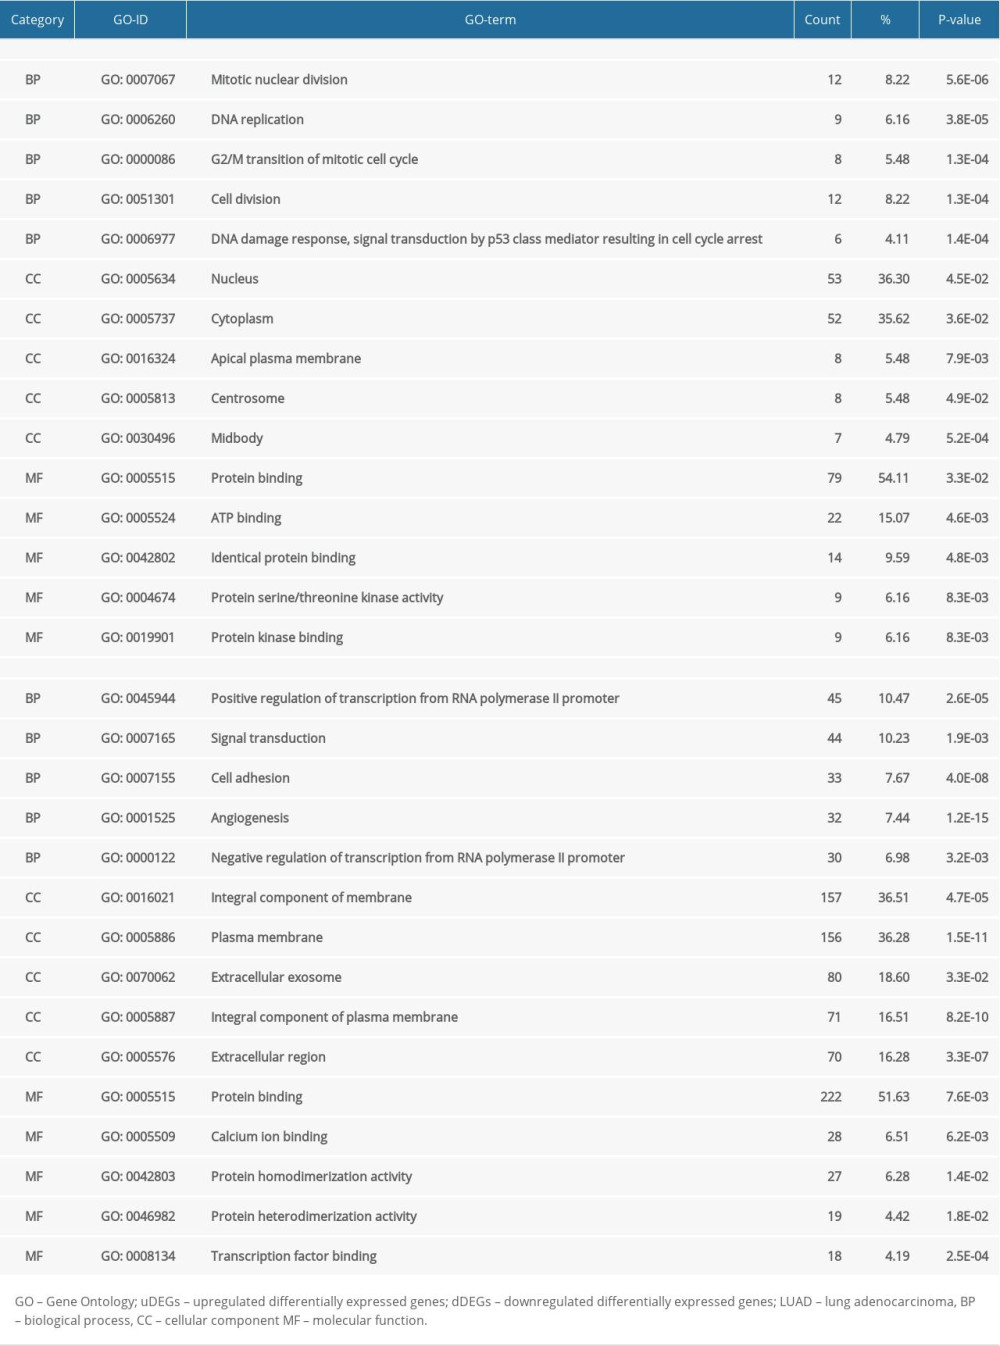 Table 6. KEGG pathway analysis of uDEGs and dDEGs.
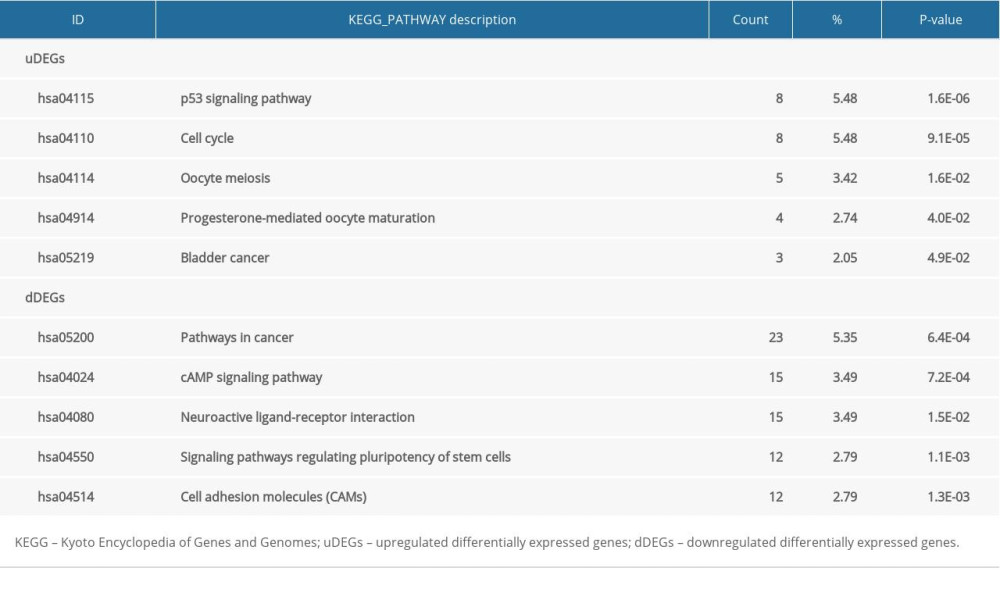 Table 7. KEGG pathway analysis of 3 key module in PPI network complex.
References
1. Bray F, Ferlay J, Soerjomataram I, Global cancer statistics 2018: GLOBOCAN estimates of incidence and mortality worldwide for 36 cancers in 185 countries: Cancer J Clin, 2018; 68; 394-424
2. Travis WD, Brambilla E, Nicholson AG, The 2015 World Health Organization classification of lung tumors: Impact of genetic, clinical and radiologic advances since the 2004 classification: J Thorac Oncol, 2015; 10; 1243-60
3. Travis WD, Brambilla E, Noguchi M, International Association for the Study of Lung Cancer/American Thoracic Society/European Respiratory Society international multidisciplinary classification of lung adenocarcinoma: J Thorac Oncol, 2011; 6; 244-85
4. Nakamura H, Takagi M, Clinical impact of the new IASLC/ATS/ERS lung adenocarcinoma classification for chest surgeons: Surg Today, 2015; 45; 1341-51
5. Behera M, Owonikoko TK, Gal AA: Clin Lung Cancer, 2016; 17; e57-64
6. Macheleidt IF, Dalvi PS, Lim SY, Preclinical studies reveal that LSD1 inhibition results in tumor growth arrest in lung adenocarcinoma independently of driver mutations: Mol Oncol, 2018; 12; 1965-79
7. Meng F, Zhang L, Ren Y, Ma Q, The genomic alterations of lung adenocarcinoma and lung squamous cell carcinoma can explain the differences of their overall survival rates: J Cell Physiol, 2019; 234; 10918-25
8. Inamura K, Clinicopathological characteristics and mutations driving development of early lung adenocarcinoma: tumor initiation and progression: Int J Mol Sci, 2018; 19 pii: E1259
9. Kadota K, Yeh YC, D’Angelo SP, Associations between mutations and histologic patterns of mucin in lung adenocarcinoma: Invasive mucinous pattern and extracellular mucin are associated with KRAS mutation: Am J Surg Pathol, 2014; 38; 1118-27
10. Girard L, Rodriguez-Canales J, Behrens C, An expression signature as an aid to the histologic classification of non-small cell lung cancer: Clin Cancer Res, 2016; 22; 4880-89
11. Peng Z, Wang J, Shan B, Genome-wide analyses of long noncoding RNA expression profiles in lung adenocarcinoma: Sci Rep, 2017; 7; 15331
12. Xu L, Lu C, Huang Y, SPINK1 promotes cell growth and metastasis of lung adenocarcinoma and acts as a novel prognostic biomarker: BMB Rep, 2018; 51; 648-53
13. Barrett T, Wilhite SE, Ledoux P, NCBI GEO: Archive for functional genomics data sets – update: Nucleic Acids Res, 2013; 41; D991-95
14. Huang da W, Sherman BT, Lempicki RA, Bioinformatics enrichment tools: Paths toward the comprehensive functional analysis of large gene lists: Nucleic Acids Res, 2009; 37; 1-13
15. Szklarczyk D, Morris JH, Cook H, The STRING database in 2017: Quality-controlled protein-protein association networks, made broadly accessible: Nucleic Acids Res, 2017; 45; D362-68
16. Shannon P, Markiel A, Ozier O, Cytoscape: A software environment for integrated models of biomolecular interaction networks: Genome Res, 2003; 13; 2498-504
17. Tang Z, Li C, Kang B, GEPIA: A web server for cancer and normal gene expression profiling and interactive analyses: Nucleic Acids Res, 2017; 45; W98-102
18. Zhao P, Zhang P, Hu W, Upregulation of cyclin B1 plays potential roles in the invasiveness of pituitary adenomas: J Clin Neurosci, 2017; 43; 267-73
19. Liu XX, Yang YE, Liu X, A two-circular RNA signature as a noninvasive diagnostic biomarker for lung adenocarcinoma: J Transl Med, 2019; 17; 50
20. Ning Y, Wang C, Liu X, CK2-mediated CCDC106 phosphorylation is required for p53 degradation in cancer progression: J Exp Clin Cancer Res, 2019; 38; 131
21. Batra A, Winquist E, Emerging cell cycle inhibitors for treating metastatic castration-resistant prostate cancer: Expert Opin Emerg Drugs, 2018; 23; 271-82
22. Ma R, Zhai X, Zhu X, Zhang L, LINC01585 functions as a regulator of gene expression by the CAMP/CREB signaling pathway in breast cancer: Gene, 2019; 684; 139-48
23. Zappa C, Mousa SA, Non-small cell lung cancer: Current treatment and future advances: Transl Lung Cancer Res, 2016; 5; 288-300
24. Abraham V, Cao G, Parambath A, Involvement of TIMP-1 in PECAM-1-mediated tumor dissemination: Int J Oncol, 2018; 53; 488-502
25. DeLisser H, Liu Y, Desprez PY, Vascular endothelial platelet endothelial cell adhesion molecule 1 (PECAM-1) regulates advanced metastatic progression: Proc Natl Acad Sci USA, 2010; 107; 18616-21
26. Sarathi A, Palaniappan A, Novel significant stage-specific differentially expressed genes in hepatocellular carcinoma: BMC Cancer, 2019; 19; 663
27. Warfel NA, Dolloff NG, Dicker DT, CDK1 stabilizes HIF-1alpha via direct phosphorylation of Ser668 to promote tumor growth: Cell Cycle, 2013; 12; 3689-701
28. Sung WW, Lin YM, Wu PR, High nuclear/cytoplasmic ratio of Cdk1 expression predicts poor prognosis in colorectal cancer patients: BMC Cancer, 2014; 14; 951
29. Piao J, Zhu L, Sun J, High expression of CDK1 and BUB1 predicts poor prognosis of pancreatic ductal adenocarcinoma: Gene, 2019; 701; 15-22
30. Breyer J, Wirtz RM, Laible M, ESR1, ERBB2, and Ki67 mRNA expression predicts stage and grade of non-muscle-invasive bladder carcinoma (NMIBC): Virchows Arch, 2016; 469; 547-52
31. Borges US, Costa-Silva DR, da Silva-Sampaio JP, A comparative study of Ki-67 antigen expression between luminal A and triple-negative subtypes of breast cancer: Med Oncol, 2017; 34; 156
32. Verma R, Singh A, Jaiswal R, Association of Ki-67 antigen and p53 protein at invasive tumor front of oral squamous cell carcinoma: Indian J Pathol Microbiol, 2014; 57; 553-57
33. Shen XY, Liu XP, Song CK, Genome-wide analysis reveals alcohol dehydrogenase 1C and secreted phosphoprotein 1 for prognostic biomarkers in lung adenocarcinoma: J Cell Physiol, 2019; 234; 22311-20
34. Zhang H, Liu HB, Yuan DM, Prognostic value of secreted phosphoprotein-1 in pleural effusion associated with non-small cell lung cancer: BMC Cancer, 2014; 14; 280
35. Huang CF, Yu GT, Wang WM, Prognostic and predictive values of SPP1, PAI and caveolin-1 in patients with oral squamous cell carcinoma: Int J Clin Exp Pathol, 2014; 7; 6032-39
36. Zheng Y, Huang Q, Ding Z, Genome-wide DNA methylation analysis identifies candidate epigenetic markers and drivers of hepatocellular carcinoma: Brief Bioinform, 2018; 19; 101-8
37. Sahin S, Isik Gonul I, Cakir A, Clinicopathological significance of the proliferation markers Ki67, RacGAP1, and topoisomerase 2 alpha in breast cancer: Int J Surg Pathol, 2016; 24; 607-13
38. Nikolenyi A, Uhercsak G, Csenki M, Tumour topoisomerase II alpha protein expression and outcome after adjuvant dose-dense anthracycline-based chemotherapy: Pathol Oncol Res, 2012; 18; 61-68
39. Baiocchi G, Poliseli FL, De Brot L, TOP2A copy number and TOP2A expression in uterine benign smooth muscle tumours and leiomyosarcoma: J Clin Pathol, 2016; 69; 884-89
40. Xie Y, Wei RR, Huang GL, Checkpoint kinase 1 is negatively regulated by miR-497 in hepatocellular carcinoma: Med Oncol, 2014; 31; 844
41. Li J, Tang Y, Huang L, Genetic variants in CHEK1 gene are associated with the prognosis of thoracic esophageal squamous cell carcinoma patients treated with radical resection: J Huazhong Univ Sci Technolog Med Sci, 2016; 36; 828-33
42. David L, Fernandez-Vidal A, Bertoli S, CHK1 as a therapeutic target to bypass chemoresistance in AML: Sci Signal, 2016; 9; ra90
43. Ebili HO, Iyawe VO, Adeleke KR, Checkpoint kinase 1 expression predicts poor prognosis in Nigerian breast cancer patients: Mol Diagn Ther, 2018; 22; 79-90
44. Chai N, Xie HH, Yin JP, FOXM1 promotes proliferation in human hepatocellular carcinoma cells by transcriptional activation of CCNB1: Biochem Biophys Res Commun, 2018; 500; 924-29
45. Ding K, Li W, Zou Z, CCNB1 is a prognostic biomarker for ER+ breast cancer: Med Hypotheses, 2014; 83; 359-64
46. Li J, Pang J, Liu Y, Suppression of RRM2 inhibits cell proliferation, causes cell cycle arrest and promotes the apoptosis of human neuroblastoma cells and in human neuroblastoma RRM2 is suppressed following chemotherapy: Oncol Rep, 2018; 40; 355-60
47. Wang LM, Lu FF, Zhang SY, Overexpression of catalytic subunit M2 in patients with ovarian cancer: Chin Med J (Engl), 2012; 125; 2151-56
48. Bell R, Barraclough R, Vasieva , Gene expression meta-analysis of potential metastatic breast cancer markers: Curr Mol Med, 2017; 17; 200-10
Figures
 Figure 1. Venn diagram presenting the overlapping (A) uDEGs and (B) dDEGs in the 3 GEO datasets. In total, 146 uDEGs and 431 dDEGs were commonly identified between LUAD and corresponding normal adjacent lung samples. uDEGs – upregulated differentially expressed genes; dDEGs – downregulated differentially expressed genes; LUAD – lung adenocarcinoma.
 Figure 2. Construction of the protein-protein interaction (PPI) network complex with the STRING database and acquisition of 3 significant modules on the basis of the topological structure of the PPI network of the common uDEGs and dDEGs. (A) PPI network of uDEGs and dDEGs in LUAD tissues compared with corresponding normal adjacent tissues; (B) module 1, cluster score=25.407, 28 nodes and 343 edges; (C) module 2, cluster score=8.741, 28 nodes and 118 edges; (D) module 3, cluster score=5, 5 nodes and 10 edges. The blue squares indicate a node degree less than 30. uDEGs – upregulated differentially expressed genes; dDEGs – downregulated differentially expressed genes; LUAD – lung adenocarcinoma.
 Figure 3. Kaplan-Meier survival curves indicated the prognostic value of hub genes in the form of overall survival (months) in human LUAD patients; (A) PECAM1, (B) CDK1, (C) MKI67, (D) SPP1, (E) TOP2A, (F) CHEK1, (G) CCNB1, (H) RRM2. Violin plots demonstrated an association between the pathological stage of human LUAD and the expression of 8 hub genes based on TCGA data analysis using GEPIA; (I) PECAM1, (J) CDK1, (K) MKI67, (L) SPP1, (M) TOP2A, (N) CHEK1, (O) CCNB1, (P) RRM2. LUAD – lung adenocarcinoma; TCGA – The Cancer Genome Atlas.
 Figure 4. DEGs were validated in LUAD and normal lung tissue. The gene expression of (A) PECAM1, (B) CDK1, (C) MKI67, (D) SPP1, (E) TOP2A, (F) CHEK1, (G) CCNB1, (H) RRM2 in 483 LUAD patients and 347 normal tissues was evaluated by GEPIA. The relative mRNA expression levels of (I) PECAM1, (J) CDK1, (K) MKI67, (L) SPP1, (M) TOP2A, (N) CHEK1, (O) CCNB1, and (P) RRM2 between 28 LUAD patients and 8 normal lung tissues were determined by RT-qPCR. All data are shown as the mean±SD, ### P<0.001 versus the normal group. DEGs – differentially expressed genes; LUAD – lung adenocarcinoma; GEPIA – Gene Expression Profiling Interactive Analysis; mRNA – messenger RNA; RT-qPCR – real-time quantitative polymerase chain reaction; SD – standard deviation.
 Tables
 Table 1. The main features of 3 studies of GEO gene expression microarray data.
 Table 2. Clinicopathologic features of patients with LUAD in JMU.
 Table 3. Primer pair sequences for RT-qPCR of PECAM1, CDK1, MKI67, SPP1, TOP2A, CHEK1, CCNB1, RRM2, and GAPDH.
 Table 4. The most significant 5 uDEGs and 5 dDEGs in GSE75037, GSE85716, and GSE118370 datasets.
 Table 5. TOP 5 GO function annotation of common uDEGs and dDEGs associated with LUAD.
 Table 6. KEGG pathway analysis of uDEGs and dDEGs.
 Table 7. KEGG pathway analysis of 3 key module in PPI network complex.
 Table 1. The main features of 3 studies of GEO gene expression microarray data.
 Table 2. Clinicopathologic features of patients with LUAD in JMU.
 Table 3. Primer pair sequences for RT-qPCR of PECAM1, CDK1, MKI67, SPP1, TOP2A, CHEK1, CCNB1, RRM2, and GAPDH.
 Table 4. The most significant 5 uDEGs and 5 dDEGs in GSE75037, GSE85716, and GSE118370 datasets.
 Table 5. TOP 5 GO function annotation of common uDEGs and dDEGs associated with LUAD.
 Table 6. KEGG pathway analysis of uDEGs and dDEGs.
 Table 7. KEGG pathway analysis of 3 key module in PPI network complex.
 In Press
08 Mar 2024 : Clinical Research
Evaluation of Foot Structure in Preschool Children Based on Body MassMed Sci Monit In Press; DOI: 10.12659/MSM.943765
15 Apr 2024 : Laboratory Research
The Role of Copper-Induced M2 Macrophage Polarization in Protecting Cartilage Matrix in OsteoarthritisMed Sci Monit In Press; DOI: 10.12659/MSM.943738
07 Mar 2024 : Clinical Research
Knowledge of and Attitudes Toward Clinical Trials: A Questionnaire-Based Study of 179 Male Third- and Fourt...Med Sci Monit In Press; DOI: 10.12659/MSM.943468
08 Mar 2024 : Animal Research
Modification of Experimental Model of Necrotizing Enterocolitis (NEC) in Rat Pups by Single Exposure to Hyp...Med Sci Monit In Press; DOI: 10.12659/MSM.943443
Most Viewed Current Articles
17 Jan 2024 : Review article
Vaccination Guidelines for Pregnant Women: Addressing COVID-19 and the Omicron VariantDOI :10.12659/MSM.942799
Med Sci Monit 2024; 30:e942799
14 Dec 2022 : Clinical Research
Prevalence and Variability of Allergen-Specific Immunoglobulin E in Patients with Elevated Tryptase LevelsDOI :10.12659/MSM.937990
Med Sci Monit 2022; 28:e937990
16 May 2023 : Clinical Research
Electrophysiological Testing for an Auditory Processing Disorder and Reading Performance in 54 School Stude...DOI :10.12659/MSM.940387
Med Sci Monit 2023; 29:e940387
01 Jan 2022 : Editorial
Editorial: Current Status of Oral Antiviral Drug Treatments for SARS-CoV-2 Infection in Non-Hospitalized Pa...DOI :10.12659/MSM.935952
Med Sci Monit 2022; 28:e935952


