04 August 2020: Database Analysis
TPX2 Promotes Metastasis and Serves as a Marker of Poor Prognosis in Non-Small Cell Lung Cancer
Fang Zhou1ACE, Meng Wang1D, Mijiti Aibaidula2F, Zhiguo Zhang2D, Abudusaimaiti Aihemaiti2B, Rezhake Aili2B, Hao Chen2B, Shuangfeng D Dong2B, Wei Wei2B, Abulizi Maimaitiaili2ACG*DOI: 10.12659/MSM.925147
Med Sci Monit 2020; 26:e925147
Abstract
BACKGROUND: Metastasis contributes to the high mortality rate of non-small cell lung cancer (NSCLC), and gaining a better understanding of its metastatic mechanisms would aid in initiating effective clinical treatment.
MATERIAL AND METHODS: In this study, bioinformatics analyses of the GEO database and TCGA-LUAD were first used to identify the key node gene regulating NSCLC malignant progression. Further in vitro experiments, including wound healing assay, invasion assay, Western blot assay, and luciferase report assay, were used to clarify the functions and mechanism of TPX2 in NSCLC.
RESULTS: Results of the TCGA analysis showed that TPX2 was significantly positively correlated with tumor metastasis and growth and the clinical stage of NSCLC. In addition, high levels of TPX2 significantly indicated a poor survival rate. In vitro experimental results also revealed that the upregulation of TPX2 significantly promoted NSCLC cell migration and invasion and could affect cell replasticity. Further results indicated that TPX2 significantly activated the epithelial-mesenchymal transition process and promoted the expression and activities of matrix metalloproteinase (MMP)2 and MMP9.
CONCLUSIONS: This study demonstrated that TPX2 promotes the metastasis and malignant progression of NSCLC and could thus serve as a marker of poor prognosis in NSCLC.
Keywords: Carcinoma, A549 cells, Biomarkers, Tumor, Cell Cycle Proteins, cell plasticity, Computational Biology, Databases, Genetic, Disease Progression, Matrix Metalloproteinase 2, Matrix Metalloproteinase 9, Microtubule-Associated Proteins, Transfection
Background
Lung cancer ranks as the leading cause of cancer-related deaths worldwide. Non-small cell lung cancer (NSCLC) is one type of lung cancer, and it has a high incidence rate, accounting for about 85% of all lung cancers [1,2]. Patients with NSCLC usually have a poor prognosis due to diagnosis at an advanced stage [3]. More than 1.5 million deaths are caused by metastatic NSCLC each year, and these place a heavy burden on social health [1]. Only a small number of early-stage NSCLC patients can be treated with surgery and achieve a high 5-year survival rate. For more advanced NSCLC, chemotherapy and radiotherapy are suggested, but the 5-year survival rate is only ~23%. Immunological, radiotherapy, and targeted therapies are associated with some success in treating advanced NSCLC, but there are still limitations precluding their uses in some cases [4–8]. For immunological therapies, targeting activity is the key to successful treatment, but a high treatment cost restricts the further promotion of this therapy [9]. Thus, a better understanding of the mechanisms of NSCLC metastasis is urgently needed to advance clinical treatments for patients with the disease.
Circulating tumor cells (CTCs) represent a pattern of blood-borne metastasis, which is a necessary way for tumors to become established at distant sites [10]. Gene expression profile data can reflect the changes of functions and signaling pathways in cells and thus reveal the pathological mechanisms underlying various diseases [11–13]. In the present study, the GEO database of GSE50991 containing mRNA expression profiles of circulating and non-metastatic lung tumor cells was used [14]. By investigating differential gene expression and function and conducting signaling pathway enrichment analyses [15], we identified
In this study, we aimed to identify the key node gene in regulating the metastasis and malignant progression of NSCLC and then to verify the relationship between TPX2 and the clinicopathological features of NSCLC. We also aimed to further clarify the molecular mechanisms of TPX2 on cell metastasis in NSCLC.
Material and Methods
ANALYSIS OF MRNA EXPRESSION PROFILES:
The mRNA expression profile of GSE50991 was downloaded from the GEO database for use in this study [14]. Nine independent experiments were conducted to compare the mRNA expression profiles of circulating and nonmetastatic NSCLC tumor cells separately. We set the cutoff limit of |log2fold change| ≥2 for the differentially expressed genes (DEGs). The R packages pheatmap and limma were used to analyze the DEGs among these 18 groups. The DEGs were further subjected to function and pathway analyses. The protein-protein interaction (PPI) annotation and visualization were retrieved using the STRING database and Cytoscape software. The Cytoscape apps CentiScape and MCODE were used for further topological analysis. The GO and KEGG pathway analyses were conducted by using the Metascape website (https://metascape.org), while the enriched functions and pathways were visualized through the R package of ggplot2. The gene set enrichment analysis (GSEA) of total mRNA expression profiles was conducted using the R packages of clusterProfiler, enrichplot, and ggplot2 [21].
ANALYSIS OF THE TCGA DATA:
The RNA-seq gene expression data of 594 samples (535 LUAD samples and 59 normal tissue samples) generated by Illumina HiSeq were obtained from The Cancer Genome Atlas (TCGA). The clinical information associated with samples was downloaded from the GDC data portal. The immunochemistry results of TPX2 in NSCLC were obtained from the open website of The Human Protein Atlas (https://www.proteinatlas.org/). The clinical analysis of TPX2 in NSCLC was conducted by combining the TCGA and Protein Atlas-downloaded data (Supplementary Table 1). We set the median value as the dividing point for high expression and low expression of TPX2 in the clinical analyses.
CELL CULTURE AND TRANSFECTION:
The NSCLC cells of A549, H1975, H1299, H522, and H1650 were cultured in RPMI-1640 medium supplemented with 10% fetal bovine serum (Hyclone) and penicillin (50 μg/mL) plus streptomycin (50 μg/mL). All cultures were maintained under a humidified atmosphere containing 5% CO2. When cells reached an acceptable density, the TPX2 overexpression plasmid and shTPX2 knockdown plasmid were transfected into NSCLC cells with the transfection reagent (Roche, Switzerland), separately. The images of cells were visualized using a microscope (Nikon, Japan).
WOUND HEALING ASSAYS:
Treated NSCLC cells were seeded into 24-well culture plates at a density of 5×10⁵ cells/well. After about 12 h of incubation, a 200 μL pipette tip was used to scratch a wound into the surface. After incubation with serum-free medium for another 48 h, images of the healing were taken. All experiments were performed at least in triplicate, and mean±SD values are presented.
INVASION ASSAYS:
Treated NSCLC cells were diluted with serum-free medium at a concentration of 1×10⁵ cells/mL, and 200 μL of the diluted medium was then added to a Matrigel-coated top chamber. After 48 h of invasion in a humidified atmosphere containing 5% CO2, the passed cells were fixed in 4% paraformaldehyde and stained with crystal violet solution, and images of the passed NSCLC cells were then taken. All experiments were performed at least in triplicate, and the mean ± SD values are presented.
WESTERN BLOTTING:
The total proteins in treated cells were isolated by using the RIPA lysate buffer, and the protein concentrations were measured by bicinchoninic acid (BCA) protein assay kit (Thermo, USA). Western blotting was performed through sodium dodecyl sulfate polyacrylamide gel electrophoresis and subsequent transfer to polyvinylidene difluoride membranes. The membranes were then probed with primary antibodies of TPX2, E-cad, claudin 3, vimentin, fibronectin, or GAPDH, followed by incubation with a corresponding second antibody (1: 10 000, Santa Cruz Biotechnology, USA). All primary antibodies were purchased from Abcam and incubated with 1: 1000 dilutions. Densitometric analysis was performed by using the ImageJ software. All experiments were performed at least in triplicate, and the mean±SD values are presented.
LUCIFERASE REPORTER ASSAYS:
The luciferase reporter plasmids (GeneCopoeia, China) were designed by inserting the promoter clones for the matrix metalloproteinase 2 (
MMP ACTIVITY ASSAYS:
The MMP activity assays were performed by using the MMP activity assay kit (Abcam, USA). The media collected from treated NSCLC cells were incubated with the APMA working solution for about 15 min at room temperature. Then, the MMP Green Substrate solution was added and incubated for another 1 h at 37°C. Fluorescence detection was performed by using a microplate reader system at wavelengths of 490 and 595 nm. All experiments were performed at least in triplicate, and the mean±SD values are presented.
STATISTICAL ANALYSIS:
IBM SPSS Statistics 22.0 software (Chicago, IL, USA) was used to perform statistical analyses. Gap closure was analyzed by one-way ANOVA followed by pairwise comparison with the control groups by paired
Results
SELECTION OF THE KEY CANDIDATE GENE IN REGULATING THE MALIGNANT PROGRESSION OF NSCLC:
mRNA expression profile data downloaded from the GEO database were used to screen for the key candidate gene. The heatmap analysis results showed very different expressed gene profiles between the circulating tumor cells and non-metastatic tumor cells of NSCLC (Figure 1A). The volcano plot further described the DEGs between these 2 groups, in which many genes were significantly upregulated, whereas others were significantly downregulated (Figure 1B). To screen for the key candidate gene regulating the malignant progression of NSCLC, the upregulated genes were subjected to PPI analysis. The constructed PPI network considered 601 nodes and 2416 edges (Figure 1C, left). By using the Cytoscape APPs of CentiScape and MCODE, we further screened the topological network with features of Degree and K-core, and a hub network was identified with the MCODE-score of 21.478 (Figure 1C, right). As a result, the potential hub node of TPX2 was identified as a candidate gene in regulating the malignant progression of NSCLC.
TPX2 PROMOTES METASTASIS AND MALIGNANT PROGRESSION OF NSCLC:
To explore the correlation between TPX2 expression and NSCLC, the LUAD dataset from TCGA was analyzed. The TPX2 immunochemistry results showed a remarkable increase of TPX2 expression in metastatic lung cancer tissues compared with nonmetastatic lung cancer tissues (Figure 2A). Statistical results showed that TPX2 expression was significantly increased when lung cancer cells metastasized (Figure 2B). Similarly, TPX2 expression had significantly positive correlations with tumor size (Figure 2C) and clinical stage (Figure 2D). Further analysis revealed that NSCLC patients with high TPX2 expression had a significantly lower survival rate compared with those with low TPX2 expression (P=0.0025, Figure 2E).
TPX2 AFFECTS MIGRATION, INVASION, AND CELL REPLASTICITY IN NSCLC:
To clarify the exact role of TPX2 in NSCLC, the mRNA expression profile data were subjected to GSEA analysis. The GSEA results showed that when metastasis occurred, the junction between cell and cell or that between cell and matrix decreased; the regulation of apoptosis decreased, while the malignant progression of NSCLC increased; and the epithelial-mesenchymal transition (EMT) process and ATP generation increased (Figure 3A). The DEGs were further subjected to GO and KEGG analyses, and the results were consistent with the GSEA results. The pathways and functions associated with the upregulated genes included the regulation of tube diameter, the EMT process, and the cell cycle (Figure 3B). Meanwhile, the pathways and functions associated with downregulated genes were cell adhesion, extracellular matrix organization, and the apoptosis signaling pathway (Figure 3C).
Based on the omics analysis results, we suspected that TPX2 might play an important role in regulating NSCLC metastasis. Thus, we designed in vitro experiments for verification. First, 5 NSCLC cell lines were chosen to detect the background expression levels of TPX2. A549 and H1650 were separately screened as TPX2 low-expression and high-expression models for subsequent experiments (Figure 4A). The wound healing assay showed that after 48 h of treatment, scratch wounds were significantly thinner in the high TPX2 expression groups (Figure 4B). In the Matrigel invasion assay, the passed cells were significantly increased when TPX2 was upregulated in the A549 cells and significantly decreased when TPX2 was knocked down in the H1650 cells (Figure 4C). The morphological results showed notable differences between the control and TPX2 overexpression groups, including pseudopod disappearance and cell rounding (Figure 4D).
TPX2 PROMOTES THE EMT PROCESS AND THE EXPRESSION AND ACTIVITY OF MMP2 AND MMP9:
During the omics analysis, we found significant differences in the regulation of the EMT process and extracellular matrix organization, and we suspected that TPX2 promoted the metastasis and malignant progression of NSCLC through EMT and MMPs. The Western blot results showed that when TPX2 was upregulated in the A549 cells, the expression of the epithelial marker proteins E-cad and claudin 3 was significantly decreased, whereas the expression of the mesenchymal marker proteins vimentin and fibronectin was significantly increased. Similarly, when TPX2 was knocked down in the H1650 cells, the expression of the epithelial marker proteins was significantly upregulated and that of the mesenchymal marker proteins was significantly downregulated (Figure 5A). In addition, MMP2 and MMP9 transcription was significantly increased after overexpression of TPX2 in A549 cells and significantly decreased when TPX2 was knocked down in H1650 cells (Figure 5B). The results of the MMP activity assays further revealed that the enzyme activities of MMP2 and MMP9 significantly increased with the upregulation of TPX2 in A549 cells and significantly decreased with the downregulation of TPX2 in H1650 cells (Figure 5C).
Discussion
Bioinformatics analysis allows the identification of tumor-associated node genes from large data repositories to assist in the clarification of mechanisms and the prognostic assessment of cancer [15,22]. In the present study, we chose 9 samples of circulating NSCLC tumor cells and 9 samples of nonmetastatic NSCLC tumor cells in a GEO database to identify DEGs. Through further topological network analysis, we screened the node gene
As a microtubule-associated protein, TPX2 has been reported to mediate spindle filament assembly during mitosis and to be related to cell proliferation [23]. Although a number of studies have clarified the relationship between TPX2 and tumor apoptosis and metastasis in liver and gastric cancer [16,19], the detailed mechanism of TPX2 in NSCLC remains unclear. In this study, results from omics data analysis showed that the cell adhesion function and EMT process were significantly dysregulated after NSCLC metastasized. Further
Conclusions
In summary, this study demonstrated that TPX2 promoted NSCLC metastasis and malignant progression. The effects of TPX2 in NSCLC may have been mediated through regulation of cytoskeleton remodeling as well as the further activation of the EMT process and MMP expression and enzyme activities (Figure 6). TPX2 might serve as a marker of metastasis and poor prognosis in NSCLC, and it could potentially serve as a target for the clinical treatment of NSCLC.
Figures
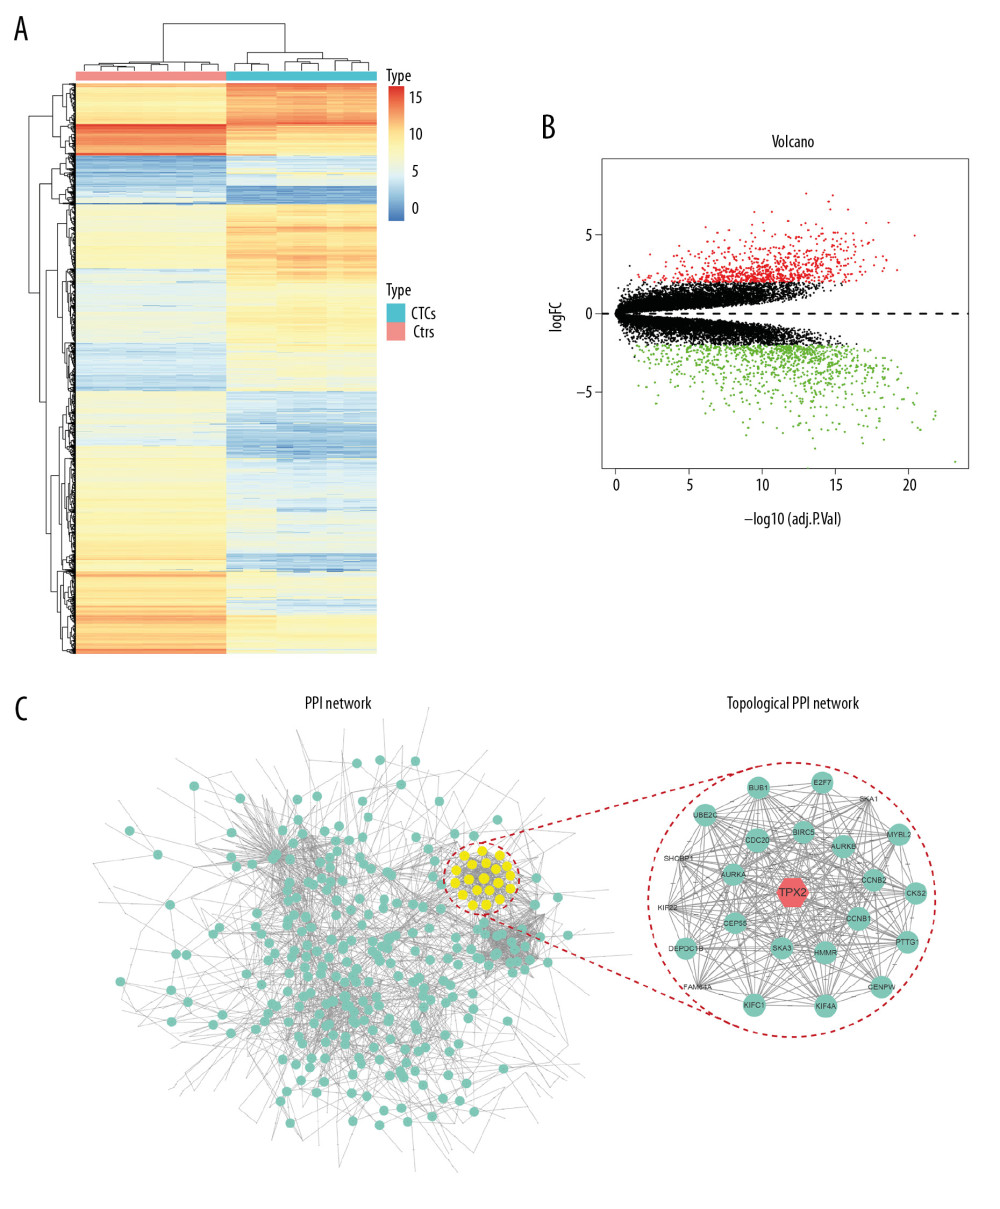 Figure 1. TPX2 was selected as the key candidate gene in regulating the malignant progression of NSCLC. (A) Heatmap analysis of DEGs revealed a substantial difference between circulating and nonmetastatic NSCLC tumor cells. (B) Volcano plot for the DEGs between circulating and nonmetastatic NSCLC tumor cells, where the red and green plots indicating the upregulated and downregulated genes, respectively. (C) PPI network analysis of DEGs revealed NSCLC-related PPI hubs, and topological PPI network indicated TPX2 as a key node gene. DEGs – differentially expressed genes; CTCs – circulating tumor cells; Ctrl – nonmetastatic NSCLC tumor cells; PPI – protein–protein interaction.
 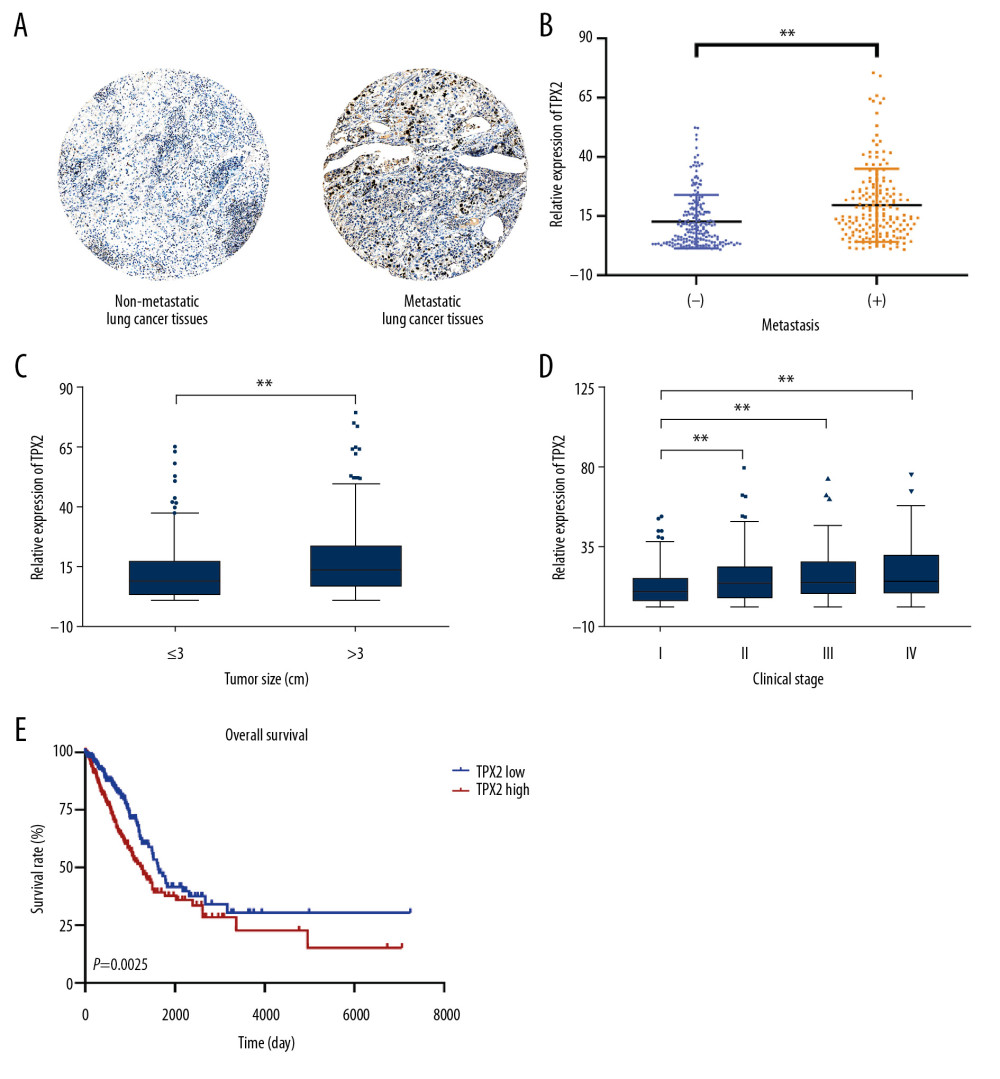 Figure 2. Correlation of TPX2 with NSCLC tumor characteristics in clinical samples. (A) TPX2 staining was weakly positive and strongly positive in nonmetastatic and metastatic lung cancer tissues, separately. (B) TPX2 expression was significantly upregulated in the metastatic NSCLC samples compared with the nonmetastatic NSCLC samples. (C) TPX2 expression was significantly increased with the NSCLC tumor size. (D) TPX2 expression was significantly increased with the NSCLC clinical stage. (E) Overall survival analysis of TPX2 on patients with NSCLC (mean±SD; ** P<0.01).
 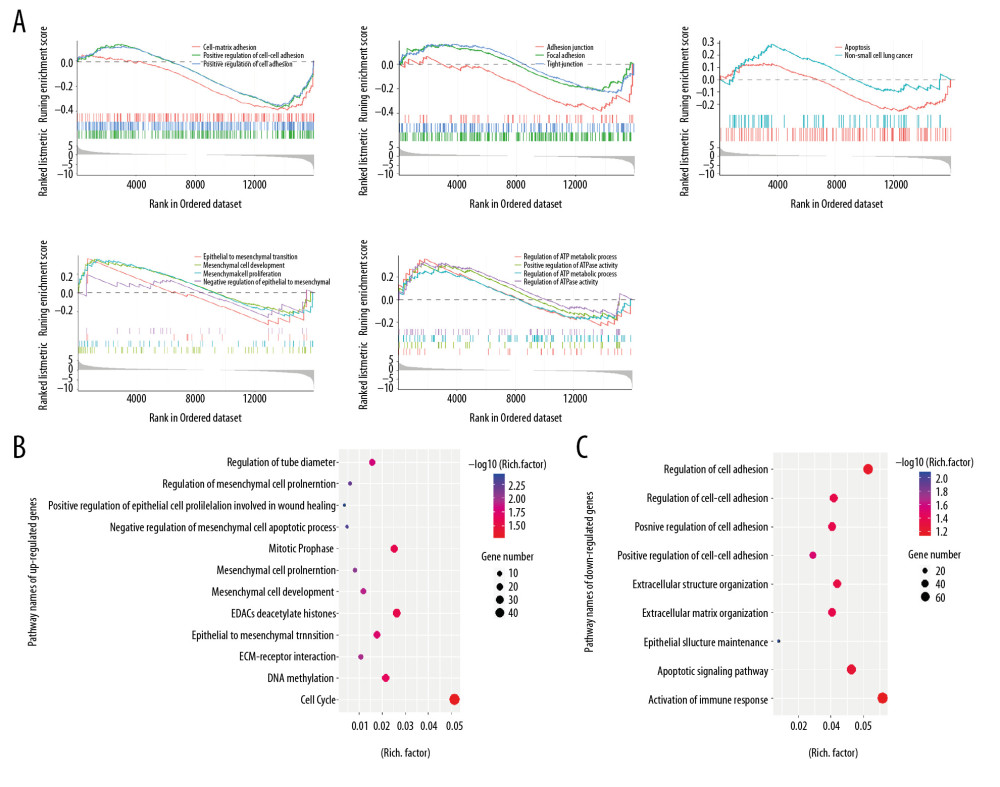 Figure 3. Function and pathway analyses of the mRNA expression profiles. (A) GSEA results of total mRNA showed differential regulation among cell adhesion, EMT, and ATP metabolism. (B) GO and KEGG analyses of the upregulated genes. (C) GO and KEGG analyses of the downregulated genes. GSEA – Gene Set Enrichment Analysis; GO – Gene Ontology; KEGG – Kyoto Encyclopedia of Genes and Genomes.
 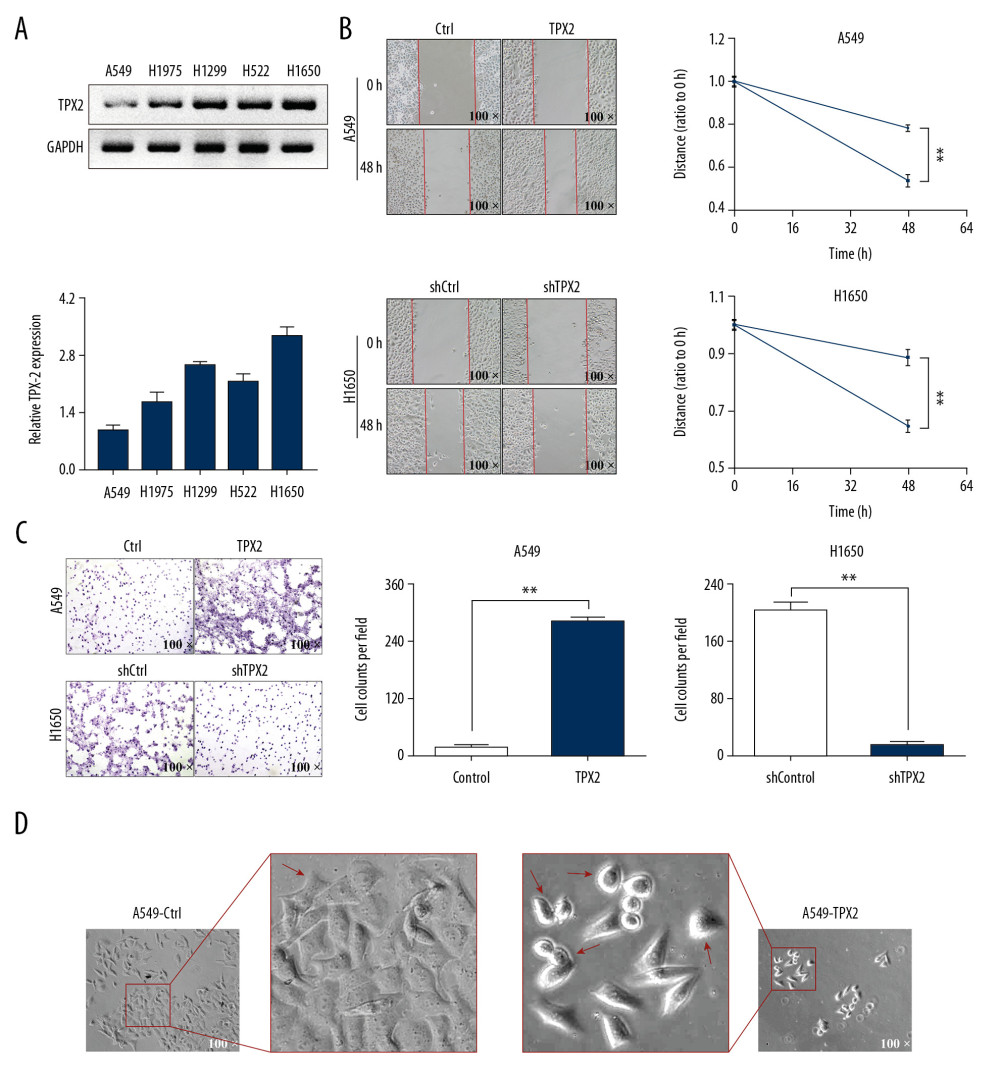 Figure 4. TPX2 affected NSCLC migration, invasion, and cell replasticity. (A) Relative TPX2 expression analysis in 5 NSCLC cell lines; the ratio of densitometry value to the corresponding GAPDH value was used to reveal the relative protein expression. (B) The upregulation of TPX2 promoted the migration of the A549 cells, whereas its downregulation inhibited the migration of the H1650 cells. (C) The upregulation of TPX2 promoted the invasion of the A549 cells, whereas its downregulation inhibited the invasion of the H1650 cells. (D) Morphological observations of different treated A549 cells in pseudopod and cell rounding (mean±SD; n=3 in triplicate; ** P<0.01).
 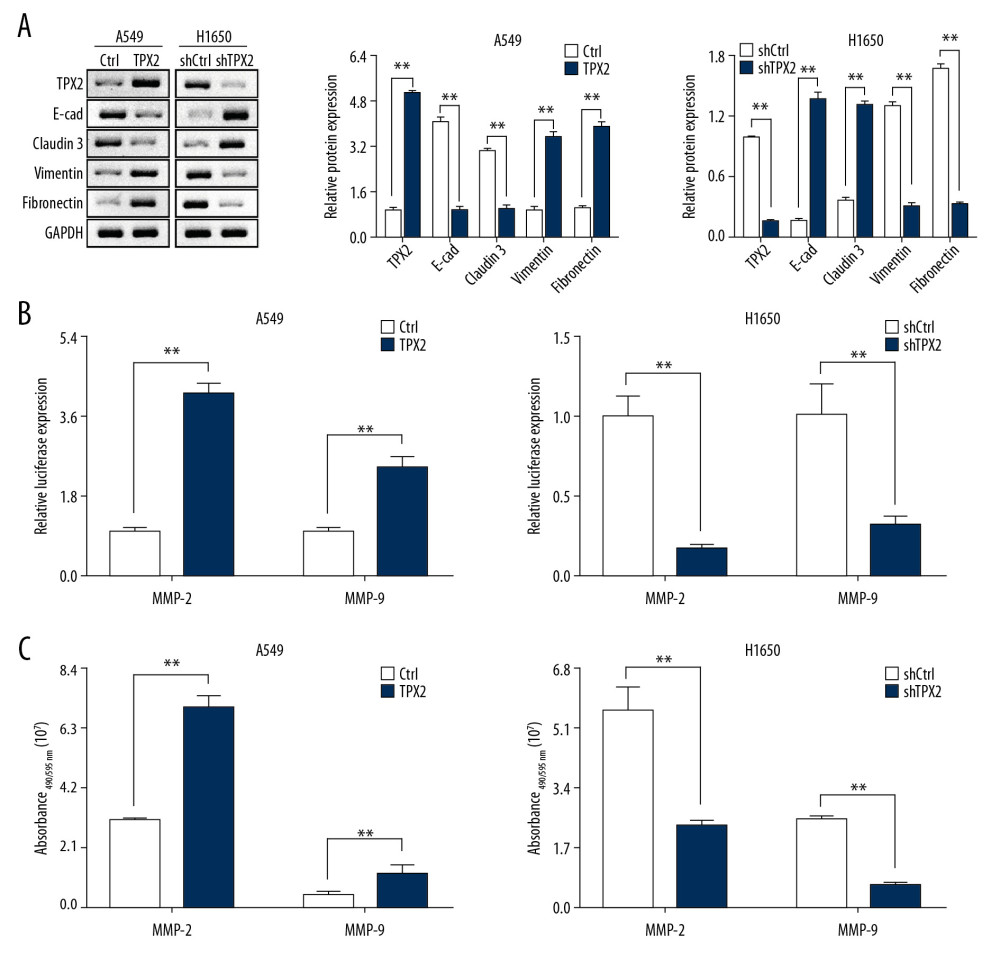 Figure 5. Correlations of TPX2 with EMT and MMPs in NSCLC cells. (A) The expression of epithelial marker proteins was consistent with TPX2 content, whereas the expression of mesenchymal marker proteins was opposite the expression of TPX2. (B) Luciferase reporter assay results suggested that TPX2 promoted the transcriptional activities of MMP2 and MMP9. (C) The enzyme activities of MMP2 and MMP9 were detected by using the activity detecting kit. Expression of both MMP2 and MMP9 activities was significantly higher in the TPX2 overexpression group of A549 cells, whereas in the knockdown group of H1650 cells, the MMP2 and MMP9 activities were significantly decreased when TPX2 was knocked down (mean±SD; n=3 in triplicate; ** P<0.01).
 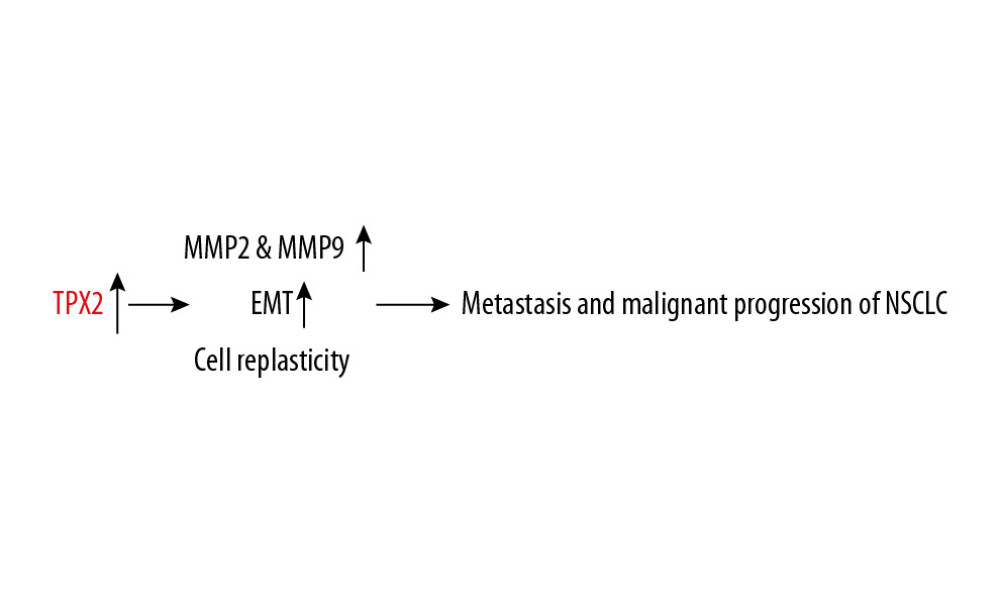 Figure 6. Proposed regulatory mechanism of TPX2 in the metastasis and malignant progression of NSCLC.
 References
1. Bray F, Ferlay J, Soerjomataram I, Global cancer statistics 2018: GLOBOCAN estimates of incidence and mortality worldwide for 36 cancers in 185 countries: Cancer J Clin, 2018; 68(6); 394-424
2. Vesel M, Rapp J, Feller D, ABCB1 and ABCG2 drug transporters are differentially expressed in non-small cell lung cancers (NSCLC) and expression is modified by cisplatin treatment via altered Wnt signaling: Respir Res, 2017; 18(1); 52
3. Jamal-Hanjani M, Wilson GA, McGranahan N, Tracking the evolution of non-small-cell lung cancer: N Engl J Med, 2017; 376; 2109-21
4. Miller KD, Nogueira L, Mariotto AB, Cancer treatment and survivorship statistics, 2019: Cancer J Clin, 2019; 69; 363-85
5. Zarogoulidis K, Zarogoulidis P, Darwiche K, Treatment of non-small cell lung cancer (NSCLC): J Thorac Dis, 2013; 5(Suppl 4); S389-96
6. Yoon SM, Shaikh T, Hallman M, Therapeutic management options for stage III non-small cell lung cancer: World J Clin Oncol, 2017; 8; 1-20
7. Elsayad K, Samhouri L, Scobioala S, Is tumor volume reduction during radiotherapy prognostic relevant in patients with stage III non-small cell lung cancer?: J Cancer Res Clin Oncol, 2018; 144; 1165-71
8. Shi L, He Y, Yuan Z, Radiomics for response and outcome assessment for non-small cell lung cancer: Technol Cancer Res Treat, 2018; 17 1533033818782788
9. Antonia SJ, Villegas A, Daniel D, Durvalumab after chemoradiotherapy in stage III non-small-cell lung cancer: N Engl J Med, 2017; 377; 1919-29
10. Plaks V, Koopman CD, Werb Z, Cancer. Circulating tumor cells: Science, 2013; 341; 1186-88
11. Li H, Zhao X, Wang J, Bioinformatics analysis of gene expression profile data to screen key genes involved in pulmonary sarcoidosis: Gene, 2017; 596; 98-104
12. Huang Y, Tao Y, Li X, Bioinformatics analysis of key genes and latent pathway interactions based on the anaplastic thyroid carcinoma gene expression profile: Oncol Lett, 2017; 13; 167-76
13. Jiang W, Liu P, Zhang J, Yang W: Indian J Microbiol, 2020; 60; 62-69
14. Mishra DK, Creighton CJ, Zhang Y: Ann Thorac Surg, 2015; 99; 1149-56
15. Zhang Q, Qin Y, Zhao J, Thymidine phosphorylase promotes malignant progression in hepatocellular carcinoma through pentose Warburg effect: Cell Death Dis, 2019; 10; 43
16. Liang B, Jia C, Huang Y, TPX2 level correlates with hepatocellular carcinoma cell proliferation, apoptosis, and EMT: Dig Dis Sci, 2015; 60; 2360-72
17. Yan L, Li Q, Yang J, Qiao B, TPX2-p53-GLIPR1 regulatory circuitry in cell proliferation, invasion, and tumor growth of bladder cancer: J Cell Biochem, 2018; 119; 1791-803
18. Song T, Xu A, Zhang Z, CircRNA hsa_circRNA_101996 increases cervical cancer proliferation and invasion through activating TPX2 expression by restraining miR-8075: J Cell Physiol, 2019; 234; 14296-305
19. Liang B, Zheng W, Fang L, Overexpressed targeting protein for Xklp2 (TPX2) serves as a promising prognostic marker and therapeutic target for gastric cancer: Cancer Biol Ther, 2016; 17; 824-32
20. Schneider MA, Christopoulos P, Muley T, AURKA, DLGAP5, TPX2, KIF11 and CKAP5: Five specific mitosis-associated genes correlate with poor prognosis for non-small cell lung cancer patients: Int J Oncol, 2017; 50; 365-72
21. Yu G, Wang LG, clusterProfiler: An R package for comparing biological themes among gene clusters: OMICS, 2012; 16; 284-87
22. Keerthikumar S, An introduction to proteome bioinformatics: Methods Mol Biol, 2017; 1549; 1-3
23. Stewart S, Fang G, Anaphase-promoting complex/cyclosome controls the stability of TPX2 during mitotic exit: Mol Cell Biol, 2005; 25; 10516-27
24. Higuchi T, Uhlmann F, Stabilization of microtubule dynamics at anaphase onset promotes chromosome segregation: Nature, 2005; 433; 171-76
25. Huang C, Han Z, Wu D, Effects of TPX2 gene on radiotherapy sensitization in breast cancer stem cells: Oncol Lett, 2017; 14; 1531-35
Figures
 Figure 1. TPX2 was selected as the key candidate gene in regulating the malignant progression of NSCLC. (A) Heatmap analysis of DEGs revealed a substantial difference between circulating and nonmetastatic NSCLC tumor cells. (B) Volcano plot for the DEGs between circulating and nonmetastatic NSCLC tumor cells, where the red and green plots indicating the upregulated and downregulated genes, respectively. (C) PPI network analysis of DEGs revealed NSCLC-related PPI hubs, and topological PPI network indicated TPX2 as a key node gene. DEGs – differentially expressed genes; CTCs – circulating tumor cells; Ctrl – nonmetastatic NSCLC tumor cells; PPI – protein–protein interaction.
 Figure 2. Correlation of TPX2 with NSCLC tumor characteristics in clinical samples. (A) TPX2 staining was weakly positive and strongly positive in nonmetastatic and metastatic lung cancer tissues, separately. (B) TPX2 expression was significantly upregulated in the metastatic NSCLC samples compared with the nonmetastatic NSCLC samples. (C) TPX2 expression was significantly increased with the NSCLC tumor size. (D) TPX2 expression was significantly increased with the NSCLC clinical stage. (E) Overall survival analysis of TPX2 on patients with NSCLC (mean±SD; ** P<0.01).
 Figure 3. Function and pathway analyses of the mRNA expression profiles. (A) GSEA results of total mRNA showed differential regulation among cell adhesion, EMT, and ATP metabolism. (B) GO and KEGG analyses of the upregulated genes. (C) GO and KEGG analyses of the downregulated genes. GSEA – Gene Set Enrichment Analysis; GO – Gene Ontology; KEGG – Kyoto Encyclopedia of Genes and Genomes.
 Figure 4. TPX2 affected NSCLC migration, invasion, and cell replasticity. (A) Relative TPX2 expression analysis in 5 NSCLC cell lines; the ratio of densitometry value to the corresponding GAPDH value was used to reveal the relative protein expression. (B) The upregulation of TPX2 promoted the migration of the A549 cells, whereas its downregulation inhibited the migration of the H1650 cells. (C) The upregulation of TPX2 promoted the invasion of the A549 cells, whereas its downregulation inhibited the invasion of the H1650 cells. (D) Morphological observations of different treated A549 cells in pseudopod and cell rounding (mean±SD; n=3 in triplicate; ** P<0.01).
 Figure 5. Correlations of TPX2 with EMT and MMPs in NSCLC cells. (A) The expression of epithelial marker proteins was consistent with TPX2 content, whereas the expression of mesenchymal marker proteins was opposite the expression of TPX2. (B) Luciferase reporter assay results suggested that TPX2 promoted the transcriptional activities of MMP2 and MMP9. (C) The enzyme activities of MMP2 and MMP9 were detected by using the activity detecting kit. Expression of both MMP2 and MMP9 activities was significantly higher in the TPX2 overexpression group of A549 cells, whereas in the knockdown group of H1650 cells, the MMP2 and MMP9 activities were significantly decreased when TPX2 was knocked down (mean±SD; n=3 in triplicate; ** P<0.01).
 Figure 6. Proposed regulatory mechanism of TPX2 in the metastasis and malignant progression of NSCLC.
 In Press
07 Mar 2024 : Clinical Research
Knowledge of and Attitudes Toward Clinical Trials: A Questionnaire-Based Study of 179 Male Third- and Fourt...Med Sci Monit In Press; DOI: 10.12659/MSM.943468
08 Mar 2024 : Animal Research
Modification of Experimental Model of Necrotizing Enterocolitis (NEC) in Rat Pups by Single Exposure to Hyp...Med Sci Monit In Press; DOI: 10.12659/MSM.943443
18 Apr 2024 : Clinical Research
Comparative Analysis of Open and Closed Sphincterotomy for the Treatment of Chronic Anal Fissure: Safety an...Med Sci Monit In Press; DOI: 10.12659/MSM.944127
08 Mar 2024 : Laboratory Research
Evaluation of Retentive Strength of 50 Endodontically-Treated Single-Rooted Mandibular Second Premolars Res...Med Sci Monit In Press; DOI: 10.12659/MSM.944110
Most Viewed Current Articles
17 Jan 2024 : Review article
Vaccination Guidelines for Pregnant Women: Addressing COVID-19 and the Omicron VariantDOI :10.12659/MSM.942799
Med Sci Monit 2024; 30:e942799
14 Dec 2022 : Clinical Research
Prevalence and Variability of Allergen-Specific Immunoglobulin E in Patients with Elevated Tryptase LevelsDOI :10.12659/MSM.937990
Med Sci Monit 2022; 28:e937990
16 May 2023 : Clinical Research
Electrophysiological Testing for an Auditory Processing Disorder and Reading Performance in 54 School Stude...DOI :10.12659/MSM.940387
Med Sci Monit 2023; 29:e940387
01 Jan 2022 : Editorial
Editorial: Current Status of Oral Antiviral Drug Treatments for SARS-CoV-2 Infection in Non-Hospitalized Pa...DOI :10.12659/MSM.935952
Med Sci Monit 2022; 28:e935952


