07 October 2020: Clinical Research
Overexpression of Facilitates Tumor Development and Is Correlated with Poor Prognosis in Clear Cell Renal Cell Carcinoma
Peng Chen1BCDEF, Ziying Zhang12BCDEF, Xiang Chen1ACDEG*DOI: 10.12659/MSM.926755
Med Sci Monit 2020; 26:e926755


Abstract
BACKGROUND: Protein kinase membrane-associated tyrosine/threonine (PKMYT1) has been found in many tumors, but its association with clear cell renal cell carcinoma (ccRCC) remains unclear.
MATERIAL AND METHODS: PKMYT1 expression in ccRCC was examined in the Cancer Genome Atlas (TCGA), Gene Expression Omnibus (GEO), and Tumor Immune Estimation Resource databases. The correlation between PKMYT1 expression and clinicopathological parameters was explored via the chi-square test. Receiver operating characteristic curves were used to estimate the diagnostic performance of PKMYT1. Kaplan-Meier curves, a Cox model, nomogram, time-dependent receiver operating characteristic curves, and decision curve analysis (DCA) were used to evaluate the prognostic value and clinical utility of PKMYT1. Genes coexpressed with PKMYT1 in ccRCC were identified based on TCGA, the gene expression profiling interactive, and cBioPortal. Gene Set Enrichment Analysis revealed biological pathways associated with PKMYT1 in ccRCC.
RESULTS: Weighted gene coexpression network analysis identified PKMYT1 as one of the genes most significantly correlated with progression of histological grade. PKMYT1 was significantly upregulated in ccRCC compared with normal tissue (P<0.001), with a trend toward differentiating between individuals with ccRCC and those who were healthy (area under the curve=0.942). High PKMYT1 expression was correlated with unsatisfactory survival (hazard ratio=1.67, P=0.001), indicating that it is a risk factor for ccRCC. A nomogram incorporating PKMYT1 level was created and showed a clinical net benefit. PKMYT1 was strongly positively correlated with the anti-silencing function of 1B histone chaperone (ASF1B) gene in ccRCC.
CONCLUSIONS: PKMYT1 is upregulated in ccRCC and its presence indicates poor prognosis, making it a potential therapeutic target for ccRCC.
Keywords: Biological Processes, Carcinoma, Renal Cell, database, Databases, Nucleic Acid, Gene Expression Regulation, Enzymologic, Kidney Neoplasms, Membrane Proteins, Neoplasm Proteins, Protein Serine-Threonine Kinases, Protein-Tyrosine Kinases
Background
Kidney cancer is the 12th most common solid neoplasm, with approximately 400 000 new diagnoses and 175 000 tumor-associated deaths globally in 2018 [1]. Renal cell carcinoma (RCC) accounts for approximately 90% of all renal tumors and is derived from epithelial cells in renal tubules [2,3]. There are 3 primary histologic subtypes of RCC: clear cell RCC (ccRCC) (about 75–80% of RCC), papillary RCC (pRCC) (about 10%), and chromophobe RCC (chRCC) (about 5%) [4,5]. Rapid development in the molecular characterization of ccRCC has facilitated advances in targeted therapy, thus improving median survival of patients with advanced-stage RCC stage from less than 10 months before 2004 to 30 months by 2011 [6]. Specifically, ccRCC is usually characterized by few specific symptoms and/or laboratory abnormalities. About 20% to 30% of individuals with RCC present with advanced-stage disease at initial diagnosis. In addition, approximately 30% of patients who have localized ccRCC experience recurrence or metastasis after tumor-targeted surgery [7,8]. Thus, it is essential to further investigate reliable ccRCC-associated molecular biomarkers, thereby facilitating early diagnosis, monitoring of tumor development, and discovery of novel therapeutic targets [9].
Nevertheless, an understanding of the correlation between
Material and Methods
EXTRACTION OF DIFFERENTIALLY EXPRESSED GENE:
A flow diagram of our research approach is shown in Figure 1. The Cancer Genome Atlas (TCGA) database (https://tcga-data.nci.nih.gov/tcga/) was used to acquire publicly available messenger RNA (mRNA) profiles and corresponding clinicopathological data from 539 ccRCC tissues and 72 adjacent normal samples, Information recorded included: sex; race; laterality; tumor, node classification, and metastasis classification; tumor, node metastasis (TNM) stage; histologic grade; tumor status; relapse; and vital status. Differentially expressed genes (DEGs) were identified from TCGA database and GEO datasets (http://www.ncbi.nlm.nih.gov/geo/) (including GSE15641 [25], GSE36895 [26] and GSE40435 [27], as well as GSE105261 [28]) through the “DEseq2” package and via the “Limma” package, respectively. The thresholds were |log2-fold change (FC)| >2.0 and false discovery rate (FDR) <0.01 [29].
:
Coexpression methodology with weighted gene coexpression network analysis was transformed into connection weights or topology overlap measurements to assess the correlations among the identified DEGs [30,31]. The R package of weighted gene coexpression network analysis software was used to formulate a coexpression network for 2369 DEGs in 519 ccRCC tissues with specific clinicopathological data. We considered module significance (MS) as the average gene significance (GS) for all genes in a module [32]. We estimated the association between the module eigengene (ME) and clinical traits to investigate relevant modules. Commonly, the module with the greatest absolute value of MS was considered to be the one the most associated with a clinical trait, which then was selected for further analysis. The module membership (MM) was used to describe the significance of genes in the module. Thus, we identified the PKMYT1 gene in a module via MM and GS [33]. The levels of expression of PKMYT1 in different tumors were identified through the Tumor Immune Estimation Resource (TIMER) database (http://timer.cistrome.org/).
SURVIVAL ANALYSIS:
Pearson’s test was used to assess the correlation between PKMYT1 expression and clinicopathological variables in ccRCC. Kaplan-Meier plots with log-rank tests were applied to evaluate the association between overall survival (OS) of patients with ccRCC and PKMYT1 expression. A receiver operating characteristic curve (ROC) with areas under the curve (AUC) was formulated to assess the diagnostic efficiency of PKMYT1 in ccRCC [34,35]. Cox regression analysis was used to calculate the hazard ratio (HR) with 95% confidence interval (CI) to estimate the prognostic effect of PKMYT1 in ccRCC.
NOMOGRAM FORMULATION AND VALIDATION:
A nomogram was developed with the “rms” R package to estimate the probability of 3-, 5-, and 10-year OS in patients with ccRCC. A concordance index (C-index) and calibration plot were applied to evaluate the nomogram discrimination and the consistence between nomogram prediction and practical observation, respectively [34,35]. The time-dependent ROC curves were applied to evaluate the predictive capability of the nomogram, PKMYT1 expression level, and additional clinicopathologic variables for 3-, 5-, and 10-year OS. DCA is a novel statistical method for evaluating the utility of a predictive model in clinical decision-making and to help select the best model for use in clinical practice [36]. DCA can estimate the clinical net benefit of every model in contrast to all or no strategies. The best model is the one with the greatest net benefit, as calculated [35,37]. We conducted DCA to compare the potential predictive benefit of the nomogram, PKMYT1 expression, and traditional clinical parameters.
:
The cBioPortal database (https://www.cbioportal.org/) (last accessed May 20, 2020) was used to analyze the frequency of PKMYT1 mutations in ccRCC. The Catalogue of Somatic Mutations in Cancer (COSMIC) (https://cancer.sanger.ac.uk/cosmic/) is a high-resolution database used to investigate the impact of somatic mutations on multiple human cancers, which was used to explore mutations in PKMYT1 in ccRCC [38,39].
GENE COEXPRESSION ANALYSIS:
We identified long noncoding RNAs (lncRNAs), micro-RNAs (miRNAs), mRNA, and RNA-binding protein (RBP), as well as transcription factors (TFs), that interact with PKMYT1 using the RNA InterActome (RAID) database (RAID v2.0, www.rna-society.org/raid/) [40]. The Gene Expression Profiling Interactive Analysis (GEPIA) (http://gepia.cancer-pku.cn/index.html) is a database-based resource which incorporates 9736 tumors and 8587 normal tissues from TCGA and the Genotype-Tissue Expression datasets, thus analyzing RNA sequencing expression [41]. The correlation coefficient was generated via the Spearman method, which was used to estimate the degree of gene expression correlation. PKMYT1 and the genes positively coexpressed with PKMYT1 expression in ccRCC are shown on the x-axis and the y-axis, respectively.
FUNCTION ENRICHMENT ANALYSES:
The Gene Ontology (GO) and Kyoto Encyclopedia of Genes and Genomes (KEGG) enrichment analyses were formulated by using the clusterProfiler package (version 3.14.3). Thus, the biological attributes of the genes that were positively correlated with PKMYT1 were investigated [42]. Gene Set Enrichment Analysis (GSEA) (https://www.broadinstitute.org/gsea/) was used to determine the significance of the potential biological mechanisms in the high and low PKMYT1 expression groups. Gene sets with a normalized (NOM) P<0.05 and FDR <0.25 were considered significantly enriched.
STATISTICAL ANALYSIS:
R language software (R 3.6.3 version) was used for statistical analysis. A Wilcoxon rank sum test was conducted to compare
Results
:
Based on the cutoff value of FDR <0.05 and |FC|>2, there were 2369 DEGs between ccRCC and normal kidney samples, including 1115 upregulated and 1254 downregulated DEGs. The heat map and volcano plot for mRNA profiles are shown in Figure 2A and 2B, respectively. A total of 2369 DEGs were clustered to formulate the coexpression network through weighted correlation network analysis [43]. The soft threshold power value of 3 defined the adjacency matrix, and MEs up to 0.75 were merged (Supplementary Figure 1). Ten different gene coexpression modules were identified in ccRCC after the insignificant gray module was excluded (Figure 2C). The results of an eigengene connectivity analysis of those modules are shown in Figure 2D and 2E. The yellow module, which was most significantly correlated with histological grade of ccRCC, was pivotal for predicting development of ccRCC (r=0.31; P=1e–12) (Figure 2F). PKMYT1 was one of the most significant genes in the yellow module (GS=0.951435, MM=0.935643) (Figure 2G), which indicates that PKMYT1 is one of the DEGs that is the most significantly correlated with histological grade in ccRCC and it potentially predicts the prognosis of ccRCC based on histological grade.
:
As shown in Figure 3A, PKMYT1 expression was significantly increased in multiple solid tumors, especially in bladder urothelial carcinoma and esophageal carcinoma. Mining TCGA and multiple GEO datasets (including GSE15641, GSE36895, GSE40435, and GSE105261) further demonstrated that PKMYT1 was markedly upregulated in ccRCC samples compared with normal kidney tissues (Figure 3B–3F).
:
The association between PKMYT1 expression and clinicopathological variables in 530 cases of ccRCC from the TCGA database was further analyzed through Pearson’s χ2 test. As shown in Table 1, PKMYT1 was significantly correlated with T classification (P<0.0001), N classification (P=0.027), M classification (P=0.0058), TNM stage (P=0.0021), histologic grade (P=0.0002), tumor status (P=0.0037), status of relapse (P=0.0065), and vital status (P=0.0009). More specifically, PKMYT expression was enhanced in patients whose tumors had more advanced T, N, M classification, TNM stage, and histological grade, and those in whom ccRCC had relapsed (Figure 4A–4G). There was no significant association between PKMYT1 mRNA levels and additional clinicopathological factors, such as age, sex, and laterality of the neoplasm (Supplementary Figure 2A–2C).
:
An ROC curve was used to further clarify the diagnostic efficiency of PKMYT1 expression in ccRCC cases for which information was extracted from the TCGA dataset. It showed that expression of the gene was satisfactory for differentiating between ccRCC and tissue from healthy individuals, achieving an AUC of 0.942 (95% CI: 0.906–0.978) (Figure 5A). In addition, the AUC values for the ability of PKMYT1 to distinguish between normal renal tissue and ccRCC at TNM stages I, II, III, and IV were 0.946 (95% CI: 0.908–0.985), 0.899 (95% CI: 0.833–0.965), 0.951 (95% CI: 0.914–0.988), and 0.971 (95% CI: 0.942–0.999), respectively (Figure 5B–5E). Similarly, PKMYT1 also demonstrated significant diagnostic value in distinguishing normal tissue from ccRCC of histological grades G1, G2, G3, and G4, with AUCs of 0.944 (95% CI: 0.897–0.991), 0.932 (95% CI: 0.890–0.973), 0.954 (95% CI: 0.919–0.989), and 0.971 (95% CI: 0.943–0.999), respectively (Figure 5F–5I). These findings demonstrate that PKMYT1 is a potentially reliable and promising biomarker for diagnosis of even early-stage ccRCC.
To determine whether PKMYT1 exerted a significant effect on the prognosis of ccRCC, all ccRCC cases for which information was extracted from the TCGA database were stratified into high- and low-expression groups, based on the median value for PKMYT1 expression. The Kaplan-Meier curve with log-rank test showed that prognosis of ccRCC was worse in those with high expression of PKMYT1 than in those with low expression of the gene (HR=1.67, 95% CI: 1.23–2.27, P=0.001) (Figure 6A). High PKMYT1 expression indicated shorter OS than low PKMYT1 expression in men (HR=1.81, 95% CI: 1.23–2.67, P=0.002) and older patients (HR=1.61, 95% CI: 1.10–2.37, P=0.015) with TNM stage II ccRCC (HR=8.36, 95% CI: 1.83–38.2, P=0.006), histological grade G4 disease (HR=1.71, 95% CI: 1.00–2.91, P=0.049), and relapse (HR=1.69, 95% CI: 1.14–2.51, P=0.009) (Figure 6B–6F).
Cox regression analysis was conducted to assess the prognostic performance of PKMYT1 mRNA level in ccRCC. Univariate analysis showed that high PKMYT1 expression (HR=1.82, 95% CI: 1.32–2.52, P<0.001) was significantly associated with inferior OS (Table 2). The multivariate analysis also found that a high PKMYT1 mRNA level (HR=1.79, 95% CI: 1.29–2.49, p=0.001) had the ability to predict unsatisfactory prognosis. Thus, high PKMYT1 expression can be considered an independent risk factor for OS in ccRCC patients.
A NOVEL NOMOGRAM MODEL WAS ESTABLISHED AND VALIDATED USING ROC AND DCA:
We next formulated a nomogram that incorporated statistically significant clinical parameters identified by multivariate analysis, thus predicting 3-, 5-, and 10-year OS for patients with ccRCC. Histologic grade made the greatest contribution to prognosis, followed by tumor status, TNM stage, and PKMYT1 expression (Figure 7A). The nomogram performed favorably for prediction, with a C-index of 0.784. The calibration plot for the probability of survival at 3, 5, and 10 years revealed great concordance between the prediction of the nomogram and actual observations (Figure 7B–7D).
We further performed ROC analysis to compare the predictive efficiency of our nomogram with that for PKMYT1 expression, histological grade, TNM stage, and tumor status. In the ROC curves of 3-year OS in the TCGA dataset, our nomogram displayed the highest AUC value of 0.808 (95% CI: 0.779–0.867), followed by that for TNM stage (0.765, 95% CI: 0.659–0.797), tumor status (0.724, 95% CI: 0.687–0.767), histological grade (0.697, 95% CI: 0.662–0.717), and PKMYT1 expression (0.659, 95% CI: 0.599–0.707) (Figure 8A). Similarly, the AUC for the nomogram in predicting 5-year OS achieved a value of 0.758 (95% CI: 0.693–0.801), which was greater than those for TNM stage (0.716, 95% CI: 0.654–0.736), PKMYT1 expression (0.699, 95% CI: 0.628–0.746), histological grade (0.669, 95% CI: 0.592–0.698), and tumor status (0.596, 95% CI: 0.518–0.622) (Figure 8B). The AUC values for the nomogram, tumor status, histological grade, TNM stage, and PKMYT1 expression for 10-year OS were 0.739 (95% CI: 0.652–0.863), 0.678 (95% CI: 0.592–0.723), 0.661 (95% CI: 0.604–0.738), 0.653 (95% CI: 0.588–0.768), and 0.639 (95% CI: 0.572–0.743) (Figure 8C). These results underscore that our nomogram, which comprised PKMYT1 expression level and other clinical parameters, is an optimal model for predicting long-term prognosis of ccRCC. PKMYT1 expression had a slightly lower or similar predictive performance for predicting prognosis of ccRCC compared with that of the additional clinical indicators (including histologic grade, TNM stage, and tumor status).
In addition, we developed DCA curves to assess the clinical effect of our nomogram and other indicators, thus helping us to visually estimate their utility. As shown in Figure 8D, the DCA of our nomogram showed the greatest net benefits, followed by histological grade, PKMYT1 expression, TNM stage, and tumor status, which suggests that PKMYT1 expression level has relatively satisfactory clinical utility for predicting the prognosis of ccRCC.
:
The mutation frequency of PKMYT1 in ccRCC was assessed through cBioPortal, which accounted for 0.1% (Figure 9A). Specifically, the mutant types of PKMYT1 in ccRCC were investigated through the COSMIC database. As shown in Figure 9B, missense mutation was the most frequent type of PKMYT1 mutation in ccRCC (27.91%), followed by synonymous mutation (11.63%), nonsense mutation (2.03%), and frameshift mutation (0.87%). Nucleotide alterations primarily consisted of C>T, G>A, C>A and G>C mutations, the greatest proportion of which (33.57%) were C>T (Figure 9C).
:
Using the RAID database, we investigated molecules that have potential to interact with PKMYT1. Specifically, PKMYT1 displayed crosstalk with 3 lncRNAs (lncMTX2, TUG1, and linc00673), multiple miRNAs (such as has-miR-20b-5p, has-miR-371b-5p, has-miR-519d-3p, and has-miR-106b-5p), mRNAs (such as AR, CSF3R, CCAR1, KIAA1109, and SIGLEC1), RBPs (such as WDR33, GRWD1, CPSF1, METAP2, and FMR1), and TFs (such as HNF4A, SWARCC2, TAF1, REST, and FXR1) (Figure 10A). Furthermore, TCGA database (Figure 10B), the cBioPortal dataset (Figure 10C), and the GEPIA dataset (Table 3) were overlapped to select 52 common genes that are positively coexpressed with PKMYT1 in ccRCC (Figure 10D). The functional and pathway enrichment analysis was conducted to explore the biological significance of these coexpressed genes. GO analysis demonstrated that pathway enrichment with the top 15 genes was associated with organelle fission, nuclear division, cell cycle G2/M phase transition, and signal transduction by p53 class mediator (Figure 11A), which was roughly consistent with the findings of the KEGG analysis (Figure 11B). As revealed in the results from GSEA, high expression of PKMYT1 was positively correlated with the cell cycle (NES=2.389, P<0.0001), p53 signaling pathway (NES=2.164, P<0.0001), DNA replication (NES=1.908, P=0.009), and base excision repair (NES=1.854, P=0.007) (Figure 11C). Therefore, PKMYT1 plays an essential role in facilitating cell proliferation in ccRCC.
:
To further explore the underlying modulation of PKMYT1 in ccRCC, data extraction was conducted in a ccRCC cohort via cBioPortal. The regression analysis revealed that PKMYT1 and the anti-silencing function 1B (ASF1B) gene displayed the greatest correlation coefficient (Spearman’s correlation=0.85, P=1.07e–145; Pearson’s correlation=0.89, P=4.11e–174) (Figure 12A). Similarly, data based on GEPIA also demonstrated that there was a strongly positive correlation between PKMYT1 and ASF1B transcription (R=0.65, P<0.0001) (Figure 12B). A heat map in accordance with the TCGA database further confirmed the previously described positive correlation (Figure 12C). These findings suggest that PKMYT1 may be involved in ASF1B signaling pathways, and may be a functional partner of ASF1B in ccRCC. An analysis of RNA sequencing and clinical information extracted from TCGA dataset demonstrated that levels of ASF1B expression were significantly enhanced in ccRCC compared with normal tissue (Figure 12D). Furthermore, based on the Human Protein Atlas (HPA) database, a high ASF1B level was significantly correlated with diminished OS in ccRCC (P=0.006) (Figure 12E).
Discussion
Globally, RCC is the 9th most common tumor in men and the 10th most common in women, resulting in over 140 000 cancer-associated deaths annually [44–46]. ccRCC is the most frequent histological subtype of RCC, with high likelihood of invasion, metastasis, and resistance to chemotherapy, which makes eliminating this neoplasm more challenging [47,48]. Thus, a growing number of studies are focusing on the pathogenesis and diagnosis of and therapy for ccRCC.
In our study, we showed the level of expression and clinical significance of
In the present study, we highlighted that
ASF1, a histone H3–H4 chaperone that comprises 2 ASF1 isoforms (
Our study deepens our comprehension of the correlation between
Conclusions
Our study is the first to assess the upregulation and negative prognostic role of
Figures
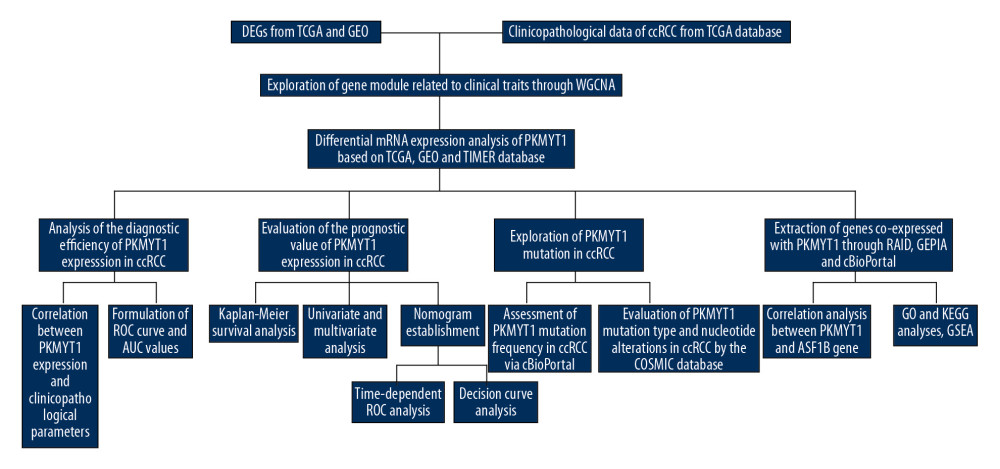 Figure 1. Flowchart of the study design.
 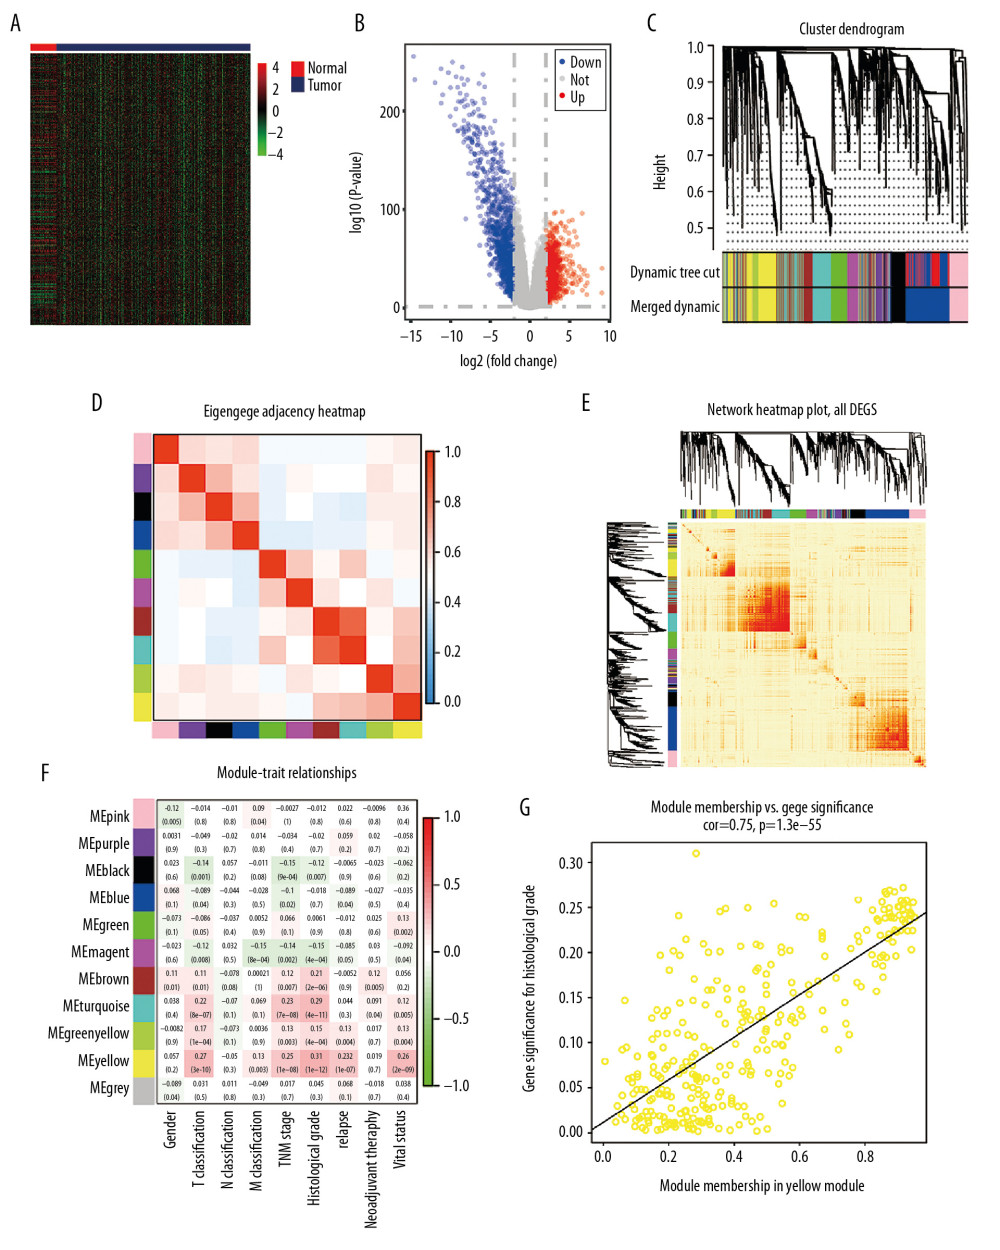 Figure 2. Bioinformatic analysis of ccRCC and normal kidney samples in the TCGA database.(A, B) The heatmap and volcano plot of the DEGs between 539 ccRCC cases and 72 normal samples. (C) Cluster dendrogram of DEGs and module screening based on gene expression profiles of 539 ccRCC samples. (D, E) Heatmap of the correlation coefficient expressed between modules. (F) Relationships between consensus module eigengenes and various clinical traits. (G) Analogous scatter plots for the yellow module. ccRCC – clear cell renal cell carcinoma; TCGA – The Cancer Genome Atlas; DEGs – differently expressed genes.
 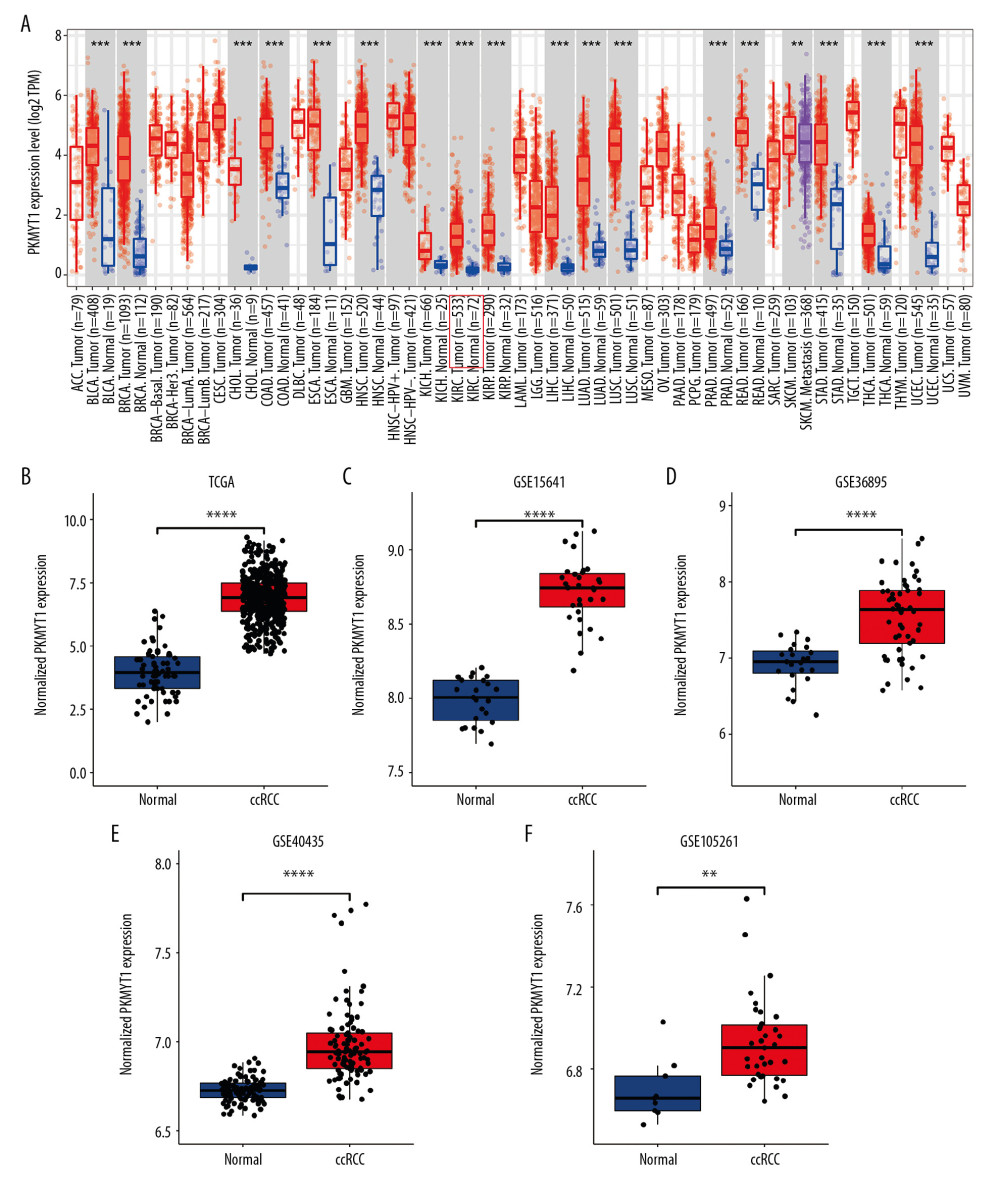 Figure 3. PKMYT1 is prominently overexpressed in ccRCC. (A) PKMYT1 mRNA expression in multiple neoplasms and adjacent normal samples from the TIMER database. PKMYT1 mRNA level in ccRCC and normal kidney tissues from (B) the TCGA database, (C) GSE15641, (D) GSE36895, (E) GSE40435, and (F) GSE105261. ccRCC – clear cell renal cell carcinoma; TIMER – Tumor Immune Estimation Resource.
 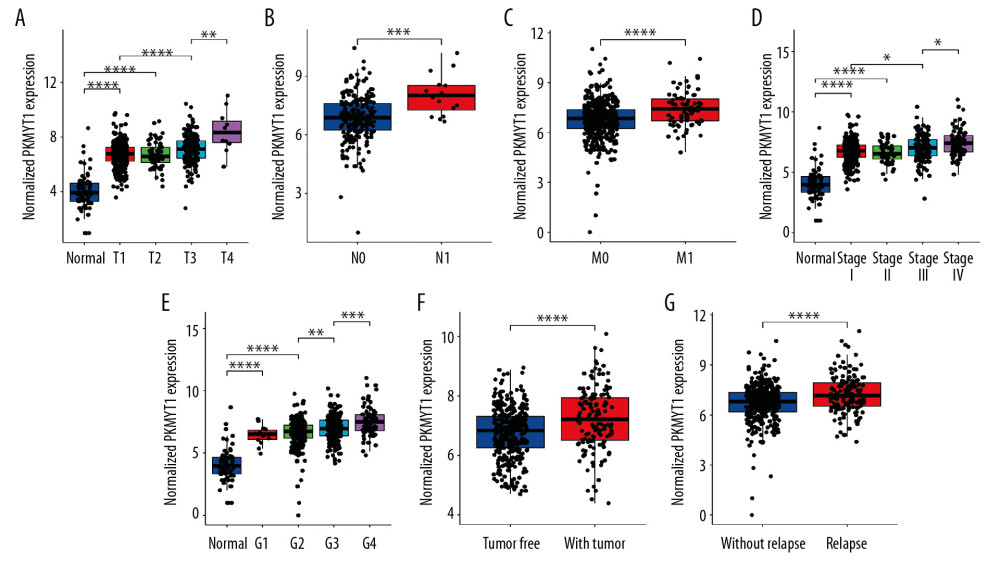 Figure 4. PKMYT1 mRNA expression is significantly correlated with diversiform clinical variables in ccRCC cases from the TCGA database. PKMYT1 in individuals with ccRCC stratified by (A) T classification, (B) N classification, (C) M classification, (D) TNM stage, (E) histologic grade, (F) tumor status, and (G) the status of relapse. ccRCC – clear cell renal cell carcinoma; TCGA – The Cancer Genome Atlas; TNM – tumor, node, metastasis.
 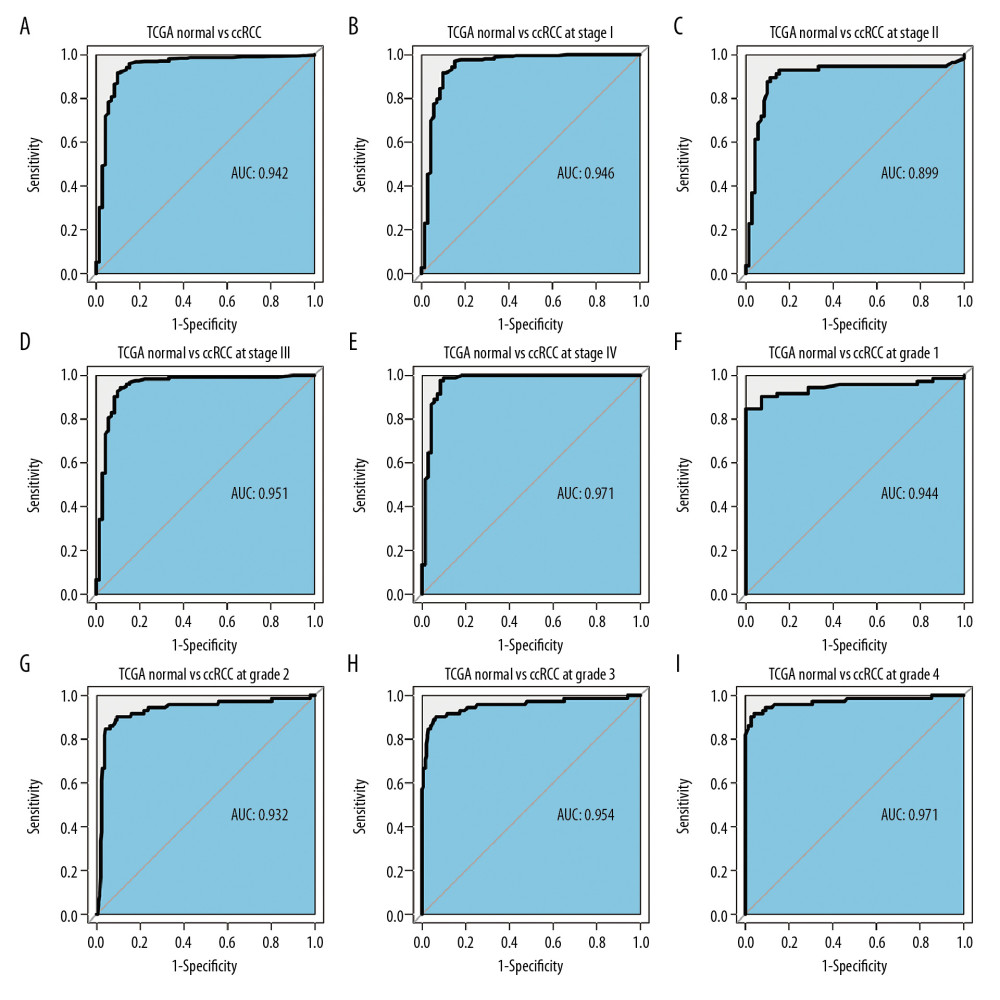 Figure 5. PKMYT1 can effectively diagnose ccRCC. ROC curves reveal that PKMYT1 expression can differentiate adjacent normal tissues from (A) ccRCC and ccRCC at (B) TNM I stage, (C) TNM II stage, (D) TNM III stage, (E) TNM IV stage, (F) histological stage 1, (G) histological stage 2, (H) histological stage 3, and (I) histological stage 4. ccRCC – clear cell renal cell carcinoma; ROC: receiver operating characteristic; TNM – tumor, node, metastasis.
 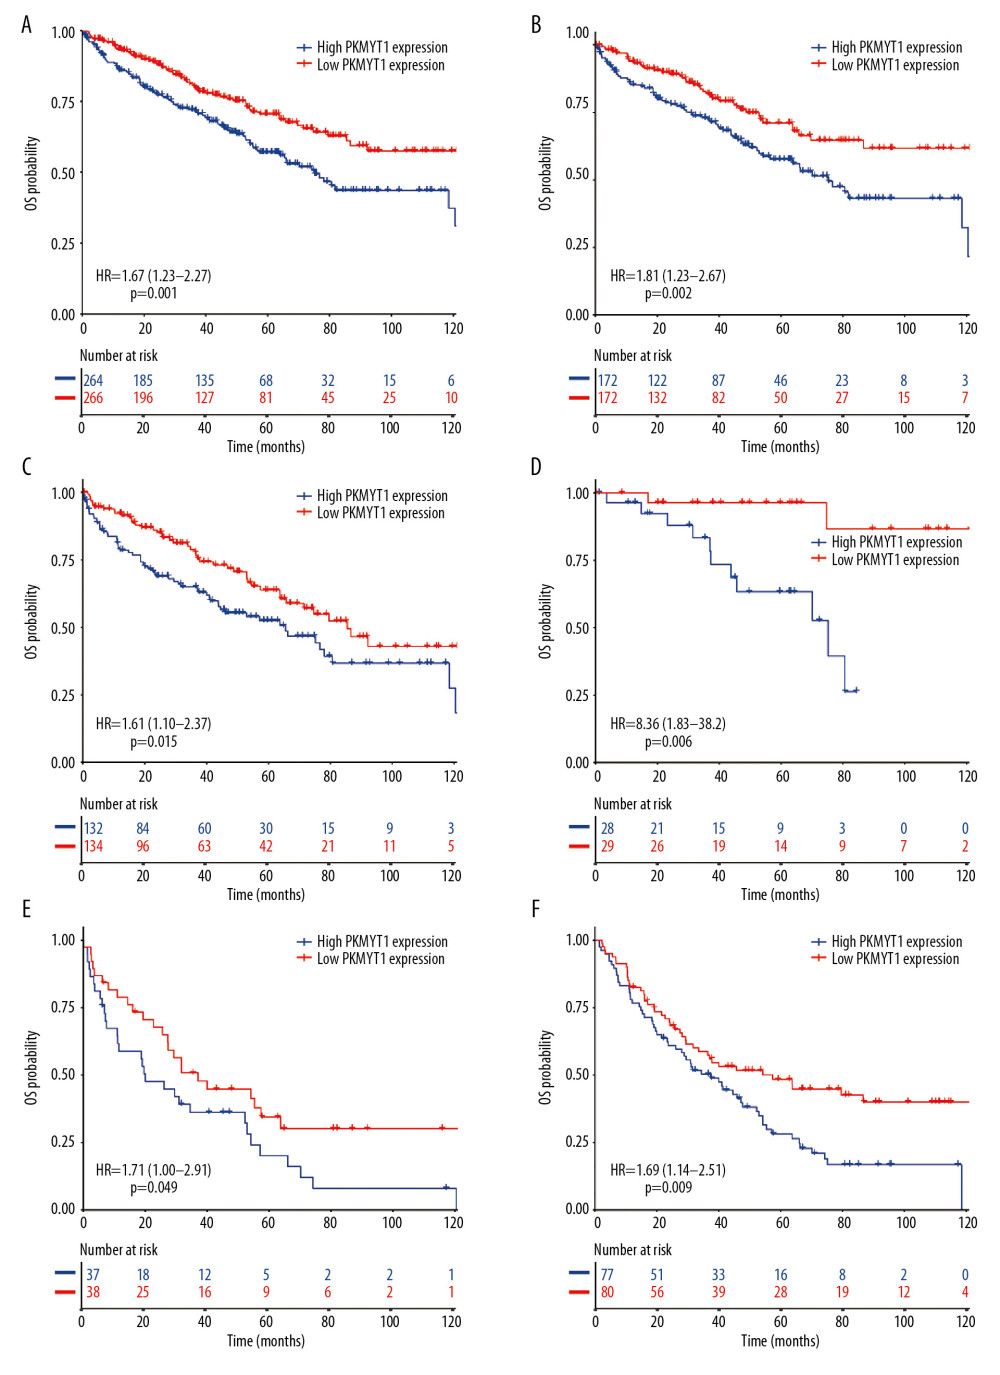 Figure 6. Overexpressed PKMYT1 exerts negative effects on ccRCC prognosis. Survival analysis reveals OS between high PKMYT1 and low PKMYT1 mRNA levels in (A) all ccRCC cases from the TCGA database, (B) male patients, (C) cases with age >60 years, (D) TNM stage II, (E) cases at histological grade 4, and (F) ccRCC that has relapsed. ccRCC – clear cell renal cell carcinoma; OS – overall survival; TCGA – The Cancer Genome Atlas; TNM, tumor, node, metastasis.
 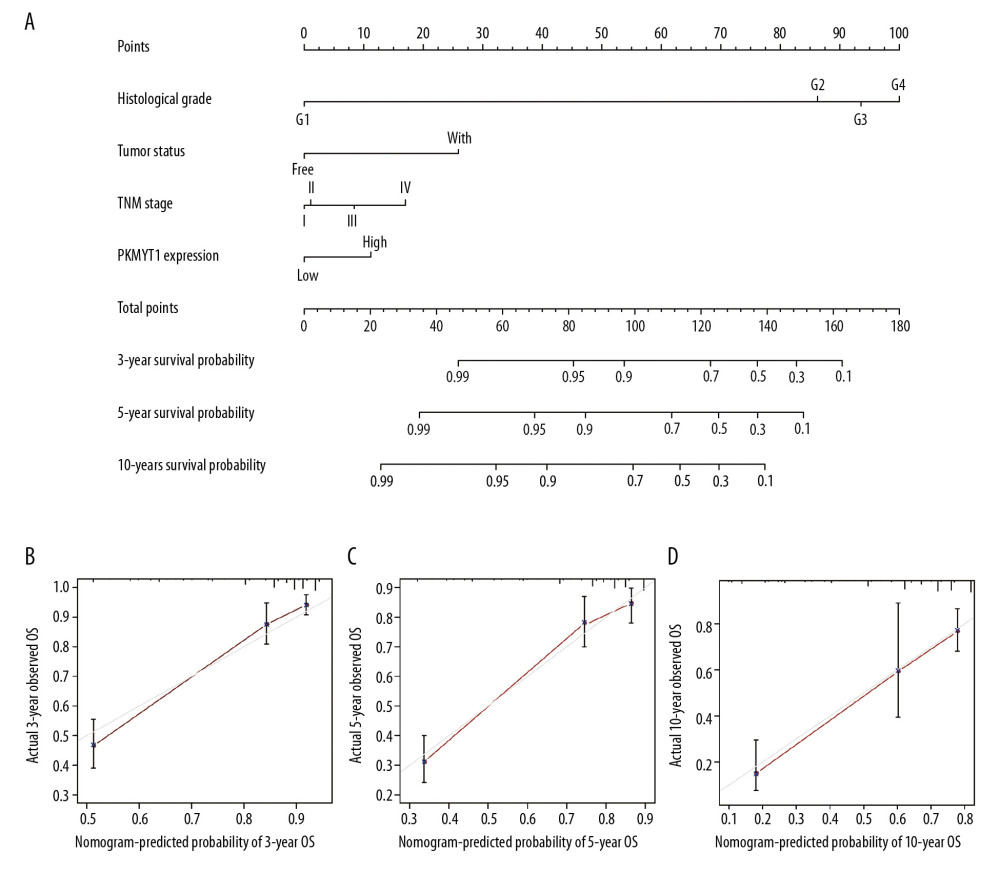 Figure 7. Nomogram model incorporating PKMYT1 mRNA expression and significant clinical variables to predict OS of ccRCC. (A) Nomogram for predicting the 3-, 5-, and 10-year OS of patients with ccRCC from the TCGA database. The calibration curves of OS at (B) 3, (C) 5, and (D) 10 years for ccRCC. OS – overall survival; ccRCC – clear cell renal cell carcinoma; TCGA – The Cancer Genome Atlas.
 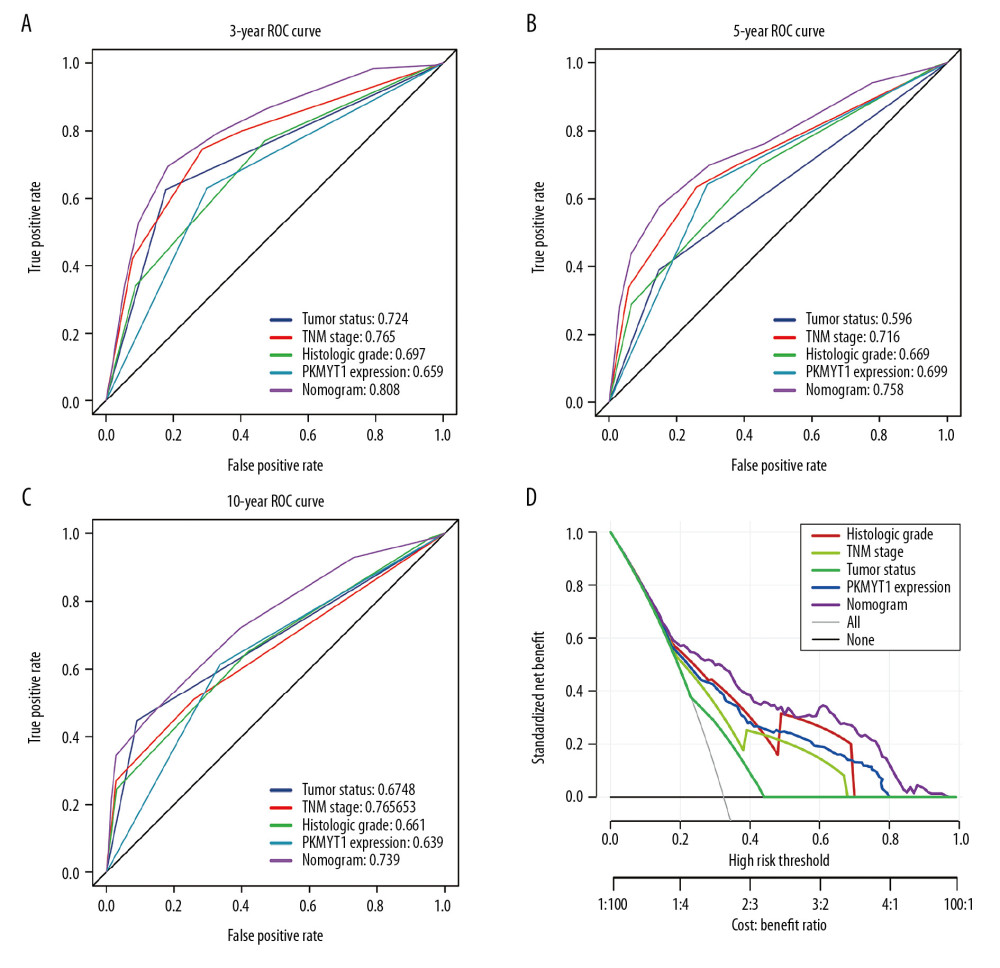 Figure 8. The predictive value and clinical utility of PKMYT1 expression level was assessed through time-dependent ROC and DCA. ROC curves of nomogram, PKMYT1 expression level, and additional clinical variables for (A) 3-, (B) 5- and (C) 10-year OS of ccRCC. (D) DCA curves of above parameters for prediction of OS in ccRCC. ROC – receiver operating characteristic; DCA – decision curve analysis; OS – overall survival; ccRCC – clear cell renal cell carcinoma.
 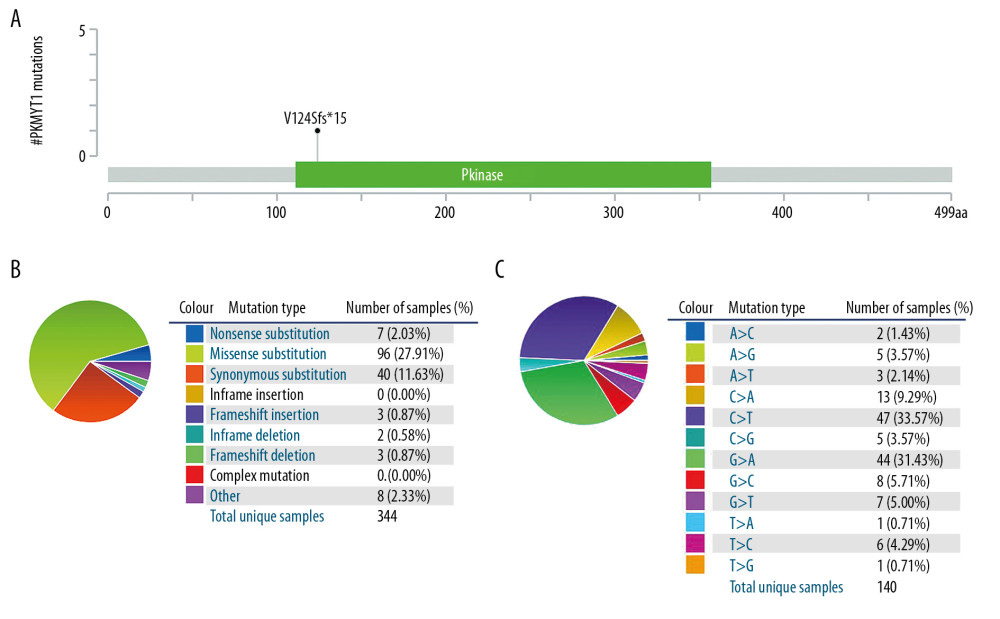 Figure 9. PKMYT1 mutations are infrequent in ccRCC. (A) Schematic diagram describing PKMYT1 mutations in ccRCC based on the cBioportal. (B, C) Different PKMYT1 mutation types and the corresponding mutation proportions in ccRCC. ccRCC – clear cell renal cell carcinoma.
 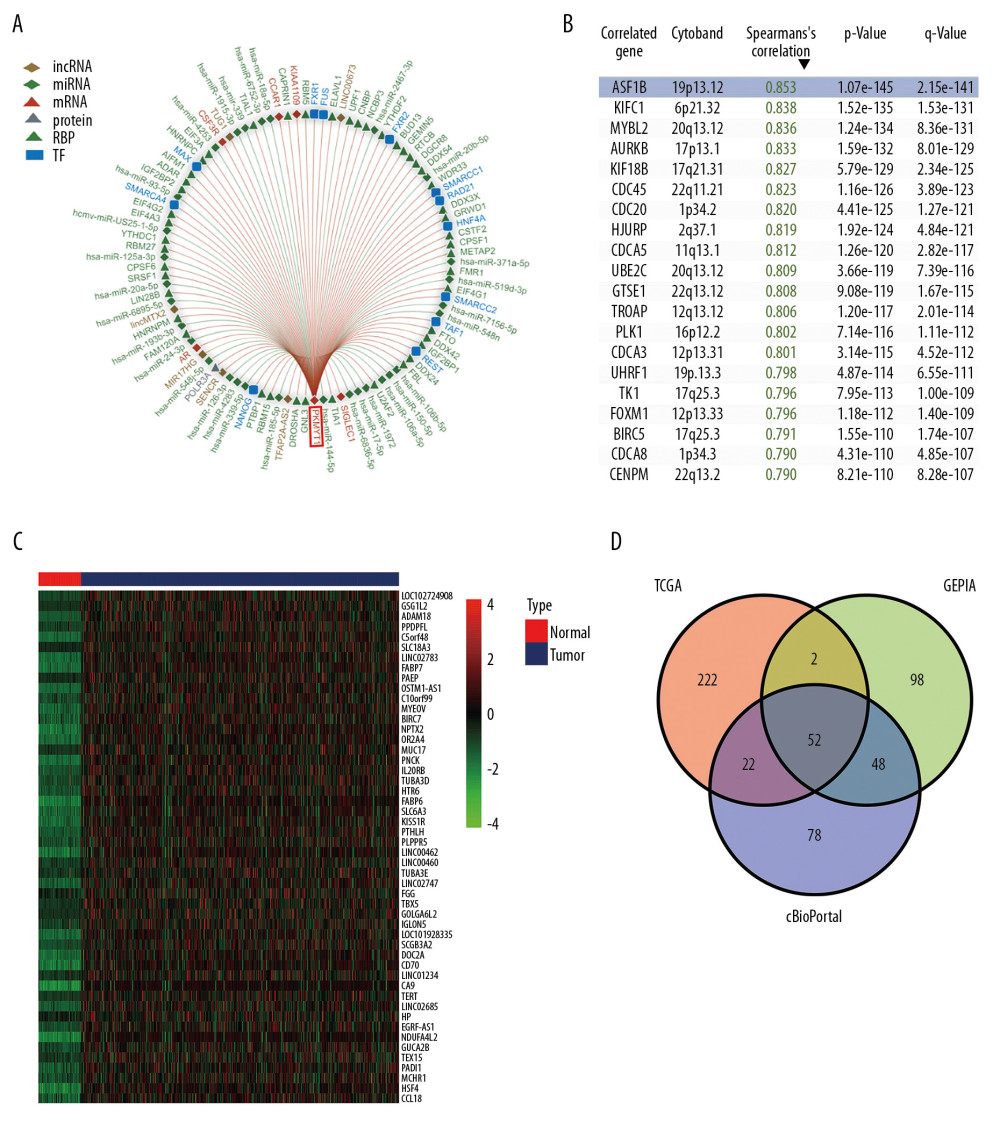 Figure 10. A series of genes coexpressed with PKMYT1 are revealed based on multi-database mining methods. (A) RAID map concerning miRNA, lncRNA, RBP, and TF interacting with PKMYT1. (B) The top 20 genes positively correlated with PKMYT1 expression in ccRCC based on the cBioPortal. (C) Heatmap of the top 50 DEGs that positively are coexpressed with PKMYT1 in ccRCC from the TCGA. (D) Venn diagram of the 52 common genes positively coexpressed with PKMYT1 in ccRCC through overlapping the TCGA, cBioPortal and GEPIA database. Abbreviations: RAID – RNA InterActome Database; miRNA – microRNA; lncRNA – long noncoding RNA; RBP – RNA-binding protein; TF – transcription factor; ccRCC– clear cell renal cell carcinoma; TCGA – The Cancer Genome Atlas; GEPIA – Gene Expression Profiling Interactive Analysis.
 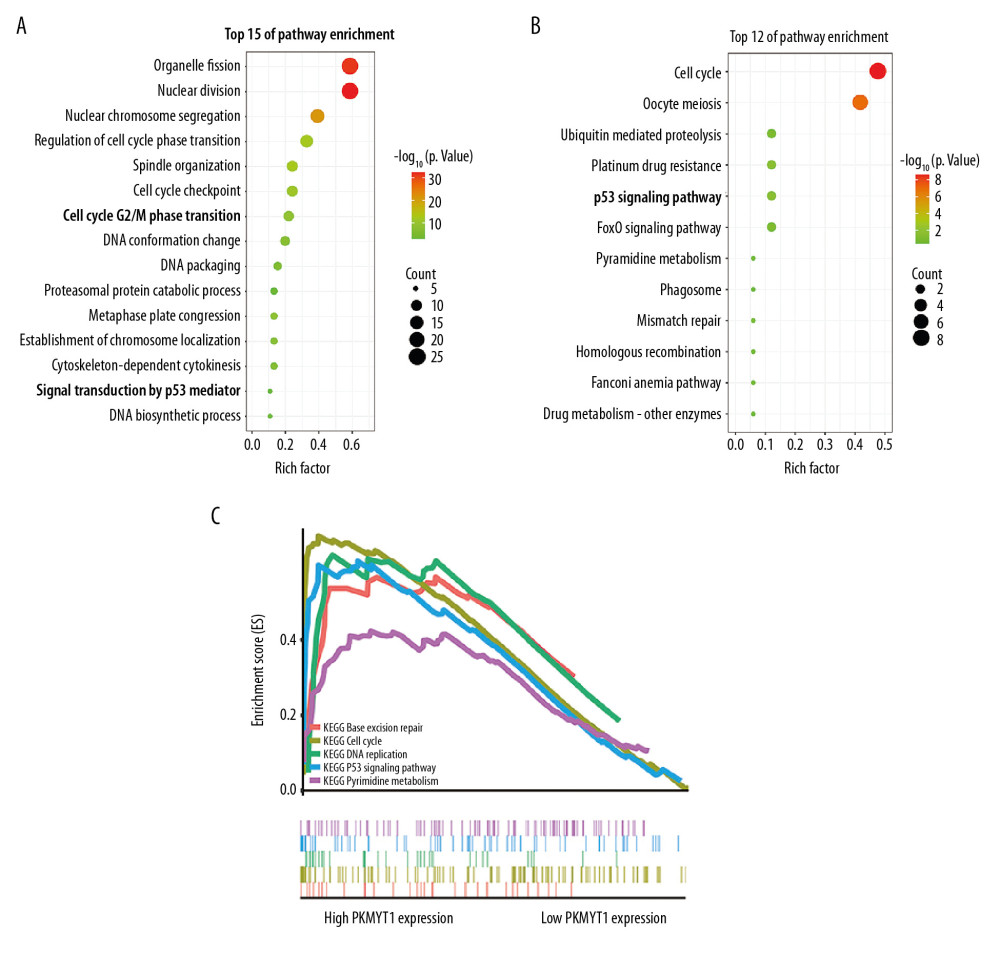 Figure 11. PKMYT1 accelerates ccRCC progression by modulating the tumor cell cycle. The most significant signaling pathways in ccRCC found through (A) GO, (B) KEGG analysis, and (C) GSEA. Abbreviations: ccRCC – clear cell renal cell carcinoma; GO – gene ontology; KEGG – Kyoto Encyclopedia of Genes and Genomes; GSEA – gene set enrichment analysis.
 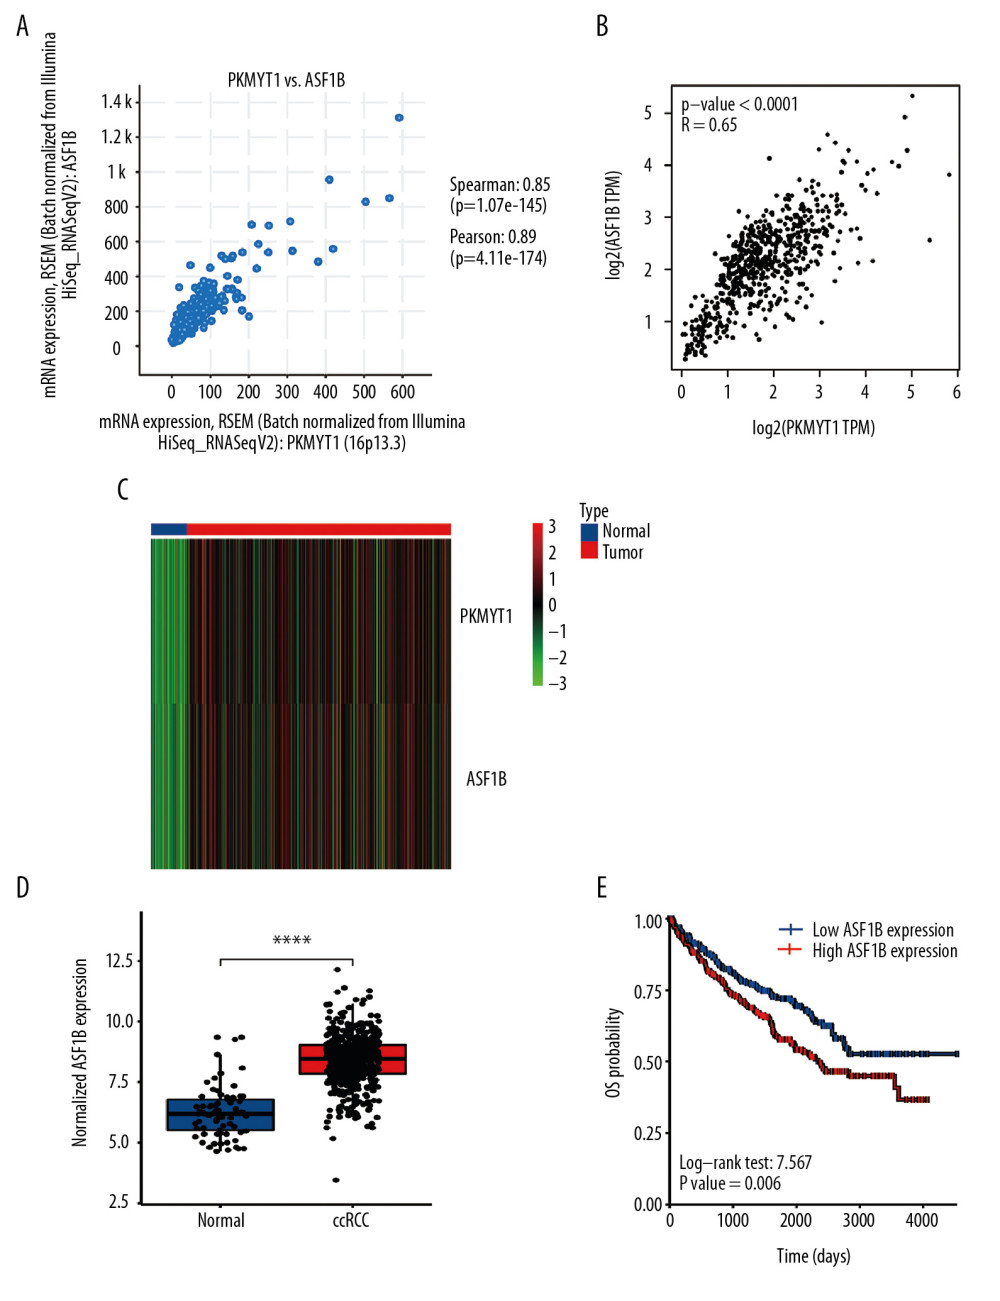 Figure 12. PKMYT1 is significantly correlated with ASF1B gene expression in ccRCC. There was a positive correlation between PKMYT1 and ASF1B based on (A) cBioPortal regression analysis, (B) GEPIA, and (C) TCGA dataset. (D) ASF1B was significantly increased in ccRCC compared with normal tissue. (E) High expression of ASF1B was associated with poor prognosis for ccRCC. ccRCC – clear cell renal cell carcinoma; GEPIA – Gene Expression Profiling Interactive Analysis; TCGA – The Cancer Genome Atlas.
 Tables
Table 1. Correlation between PKMYT1 mRNA levels and clinicopathological parameters in 530 patients with ccRCC from the TCGA database.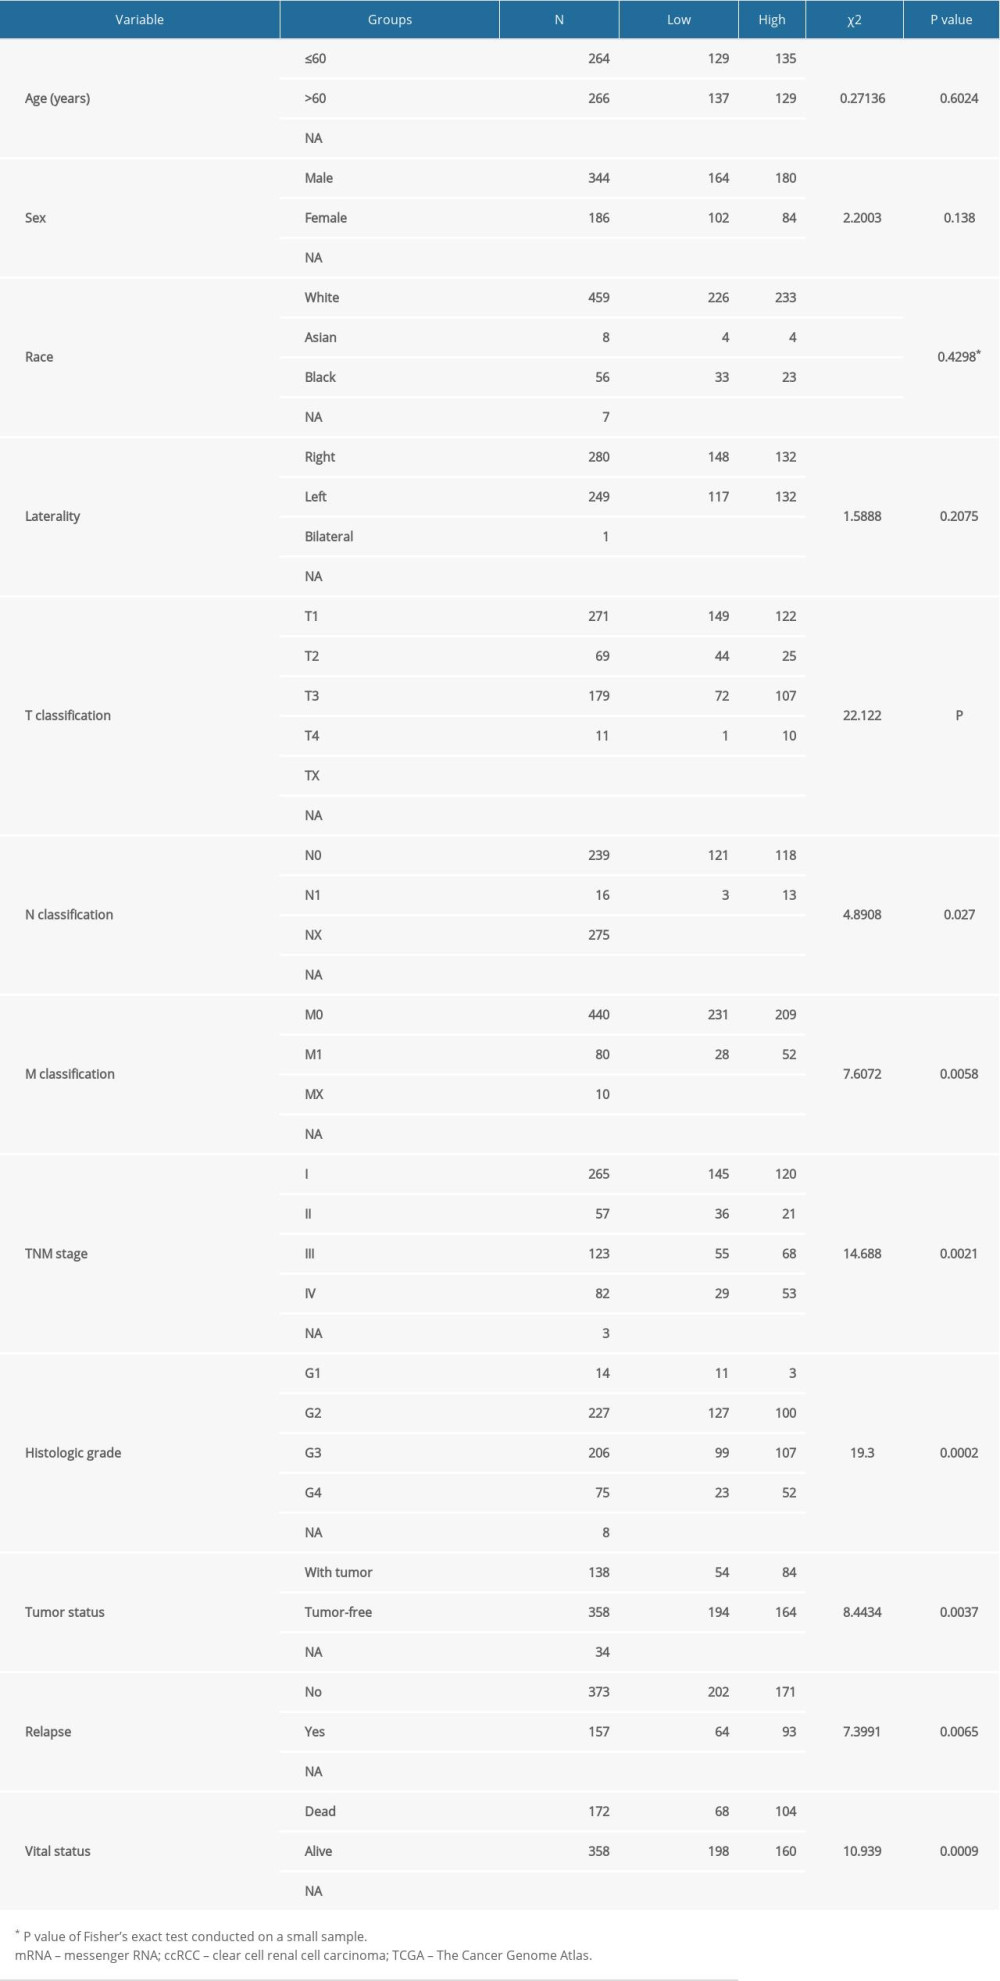 Table 2. Univariate and multivariate analyses of OS in patients with ccRCC in the TCGA database.
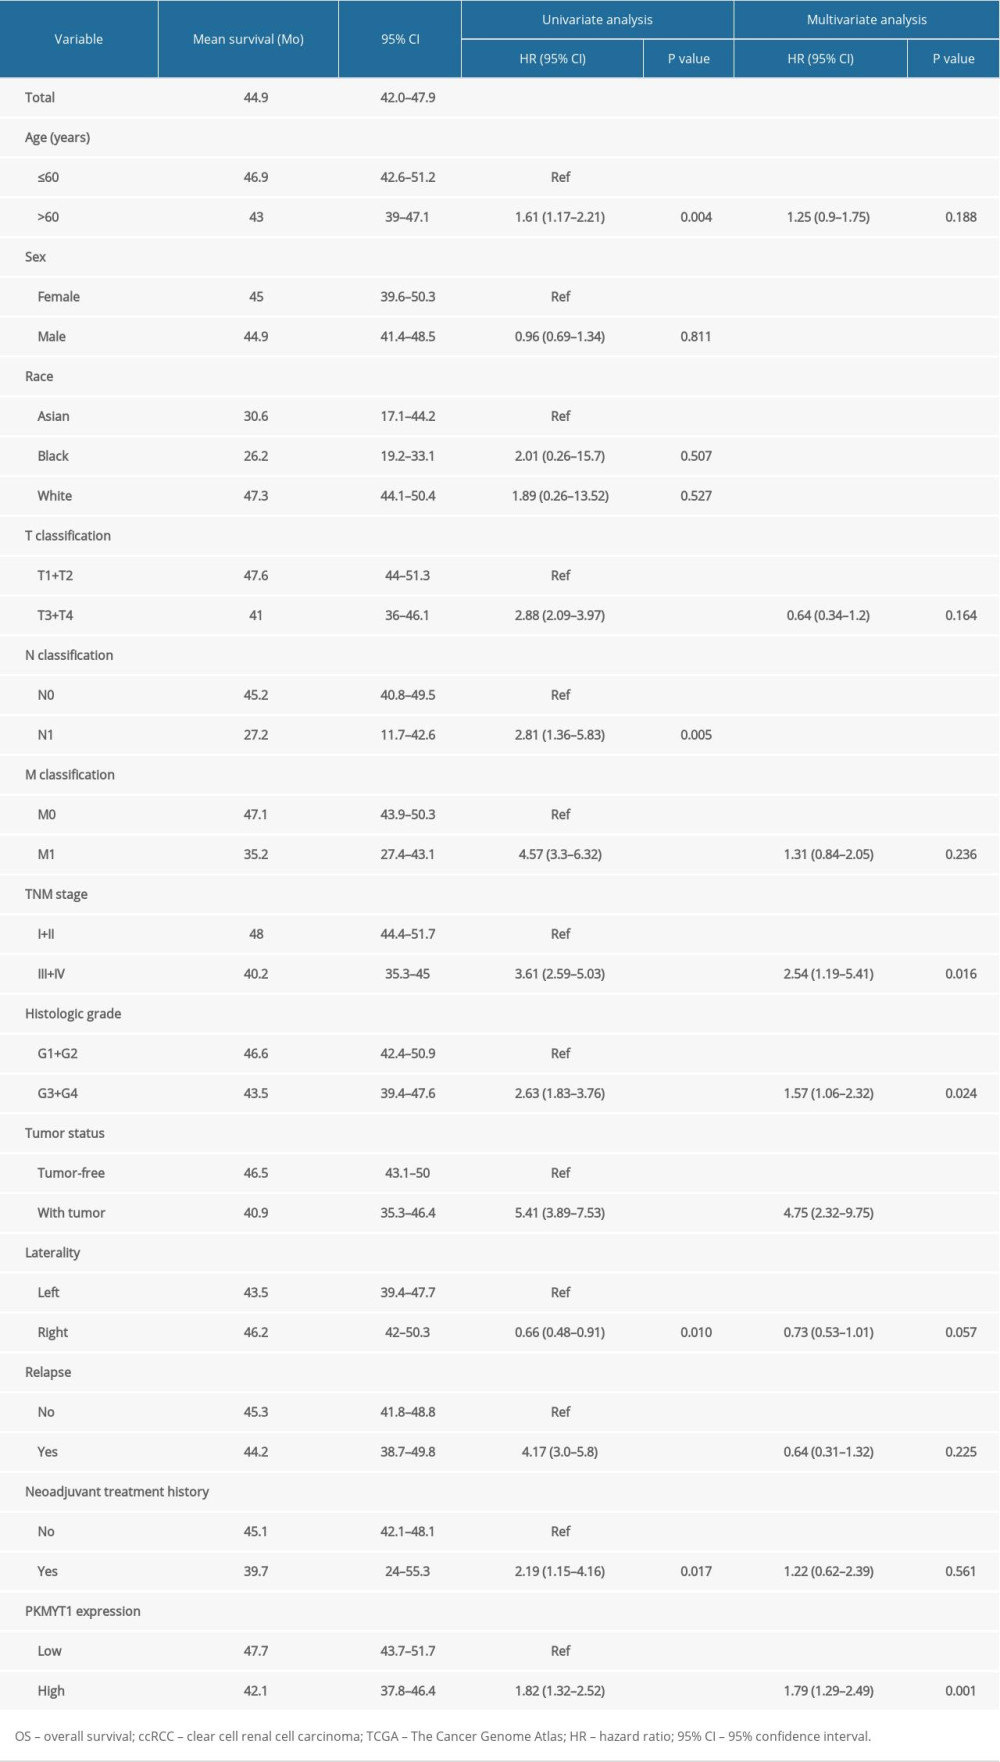 Table 3. The top 20 genes positively correlated with PKMYT1 mRNA expression in ccRCC from the GEPIA database.
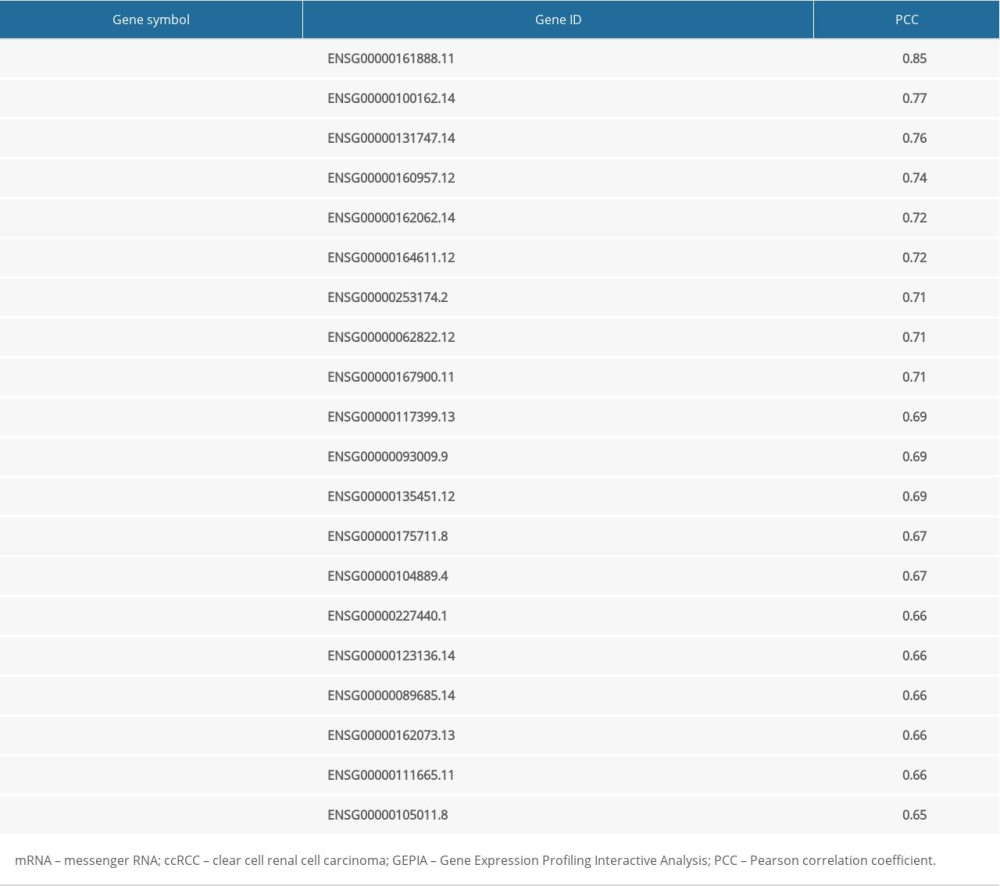
References
1. Ferlay J, Colombet M, Soerjomataram I, Estimating the global cancer incidence and mortality in 2018: GLOBOCAN sources and methods: Int J Cancer, 2019; 144(8); 1941-53
2. Meskawi M, Sun M, Trinh QD, A review of integrated staging systems for renal cell carcinoma: Eur Urology, 2012; 62(2); 303-14
3. Carril-Ajuria L, Santos M, Roldán-Romero JM, Prognostic and predictive value of PBRM1 in clear cell renal cell carcinoma: Cancers, 2019; 12(1); 16
4. Wolf MM, Kimryn Rathmell W, Beckermann KE, Modeling clear cell renal cell carcinoma and therapeutic implications: Oncogene, 2020; 39(17); 3413-26
5. Linehan WM, Ricketts CJ, The Cancer Genome Atlas of renal cell carcinoma: Findings and clinical implications: Nat Rev Urol, 2019; 16(9); 539-52
6. Hsieh JJ, Purdue MP, Signoretti S, Renal cell carcinoma: Nat Rev Dis Primers, 2017; 3; 17009
7. Moch H, Cubilla AL, Humphrey PA, The 2016 WHO Classification of Tumours of the Urinary System and Male Genital Organs – Part A: Renal, penile, and testicular tumours: Eur Urol, 2016; 70(1); 93-105
8. Srigley JR, Delahunt B, Eble JN, The International Society of Urological Pathology (ISUP) Vancouver Classification of renal neoplasia: Am J Surg Pathol, 2013; 37(10); 1469-89
9. López-Fernández E, López JI, The Impact of tumor eco-evolution in renal cell carcinoma sampling: Cancers, 2018; 10(12); 485
10. Wang J, Wang L, Chen S, PKMYT1 is associated with prostate cancer malignancy and may serve as a therapeutic target: Gene, 2020; 744; 144608
11. Zhang Q, Zhao X, Zhang C, Overexpressed PKMYT1 promotes tumor progression and associates with poor survival in esophageal squamous cell carcinoma: Cancer Manage Res, 2019; 11; 7813-24
12. Mueller PR, Coleman TR, Kumagai A, Dunphy WG, Myt1: A membrane-associated inhibitory kinase that phosphorylates Cdc2 on both threonine-14 and tyrosine-15: Science, 1995; 270(5233); 86-90
13. Liu Y, Qi J, Dou Z, Systematic expression analysis of WEE family kinases reveals the importance of PKMYT1 in breast carcinogenesis: Cell Prolif, 2020; 53(2); e12741
14. Schmidt M, Rohe A, Platzer C, Regulation of G2/M transition by inhibition of WEE1 and PKMYT1 kinases: Molecules, 2017; 22(12); 2045
15. Long HP, Liu JQ, Yu YY, PKMYT1 as a potential target to improve the radiosensitivity of lung adenocarcinoma: Front Genet, 2020; 11; 376
16. Lescarbeau RS, Lei L, Bakken KK, Quantitative phosphoproteomics reveals Wee1 kinase as a therapeutic target in a model of proneural glioblastoma: Mol Cancer Ther, 2016; 15(6); 1332-43
17. Hurvitz SA, Martin M, Symmans WF, Neoadjuvant trastuzumab, pertuzumab, and chemotherapy versus trastuzumab emtansine plus pertuzumab in patients with HER2-positive breast cancer (KRISTINE): A randomised, open-label, multicentre, phase 3 trial: Lancet Oncol, 2018; 19(1); 115-26
18. Suganuma M, Kawabe T, Hori H, Sensitization of cancer cells to DNA damage-induced cell death by specific cell cycle G2 checkpoint abrogation: Cancer Res, 1999; 59(23); 5887-91
19. Wells NJ, Watanabe N, Tokusumi T, The C-terminal domain of the Cdc2 inhibitory kinase Myt1 interacts with Cdc2 complexes and is required for inhibition of G(2)/M progression: J Cell Sci, 1999; 112(Pt 19); 3361-71
20. Passer BJ, Nancy-Portebois V, Amzallag N, The p53-inducible TSAP6 gene product regulates apoptosis and the cell cycle and interacts with Nix and the Myt1 kinase: Proc Natl Acad Sci USA, 2003; 100(5); 2284-89
21. Wang XM, Li QY, Ren LL, Effects of MCRS1 on proliferation, migration, invasion, and epithelial mesenchymal transition of gastric cancer cells by interacting with PKMYT1 protein kinase: Cell Signal, 2019; 59; 171-81
22. Liu L, Wu J, Wang S, PKMYT1 promoted the growth and motility of hepatocellular carcinoma cells by activating beta-catenin/TCF signaling: Exp Cell Res, 2017; 358(2); 209-16
23. Xuan ZH, Wang HP, Zhang XN, PKMYT1 aggravates the progression of ovarian cancer by targeting SIRT3: Eur Rev Med Pharmacol Sci, 2020; 24(10); 5259-66
24. Sun QS, Luo M, Zhao HM, Sun H, Overexpression of PKMYT1 indicates the poor prognosis and enhances proliferation and tumorigenesis in non-small cell lung cancer via activation of Notch signal pathway: Euro Rev Med Pharmacol Sci, 2019; 23(10); 4210-19
25. Yang JF, Shi SN, Xu WH, Screening, identification and validation of CCND1 and PECAM1/CD31 for predicting prognosis in renal cell carcinoma patients: Aging, 2019; 11(24); 12057-79
26. Peña-Llopis S, Vega-Rubín-de-Celis S, Liao A, BAP1 loss defines a new class of renal cell carcinoma: Nat Genet, 2012; 44(7); 751-59
27. Wang Y, Wang Y, Liu F, A 44-gene set constructed for predicting the prognosis of clear cell renal cell carcinoma: Int J Mol Med, 2018; 42(6); 3105-14
28. Shi SN, Qin X, Wang S, Identification of potential novel differentially-expressed genes and their role in invasion and migration in renal cell carcinoma: Aging, 2020; 12; 9205-23
29. Yu D, Huber W, Vitek O, Shrinkage estimation of dispersion in Negative Binomial models for RNA-seq experiments with small sample size: Bioinformatics, 2013; 29(10); 1275-82
30. Langfelder P, Horvath S, WGCNA: An R package for weighted correlation network analysis: BMC Bioinformatics, 2008; 9; 559
31. Horvath S, Dong J, Geometric interpretation of gene coexpression network analysis: PLoS Comput Biol, 2008; 4(8); e1000117
32. Yuan L, Qian G, Chen L, Coexpression network analysis of biomarkers for adrenocortical carcinoma: Front Genet, 2018; 9; 328
33. Cui H, Shan H, Miao MZ, Identification of the key genes and pathways involved in the tumorigenesis and prognosis of kidney renal clear cell carcinoma: Sci Rep, 2020; 10(1); 4271
34. Zhang Z, Chen P, Xie H, Cao P, Using circulating tumor DNA as a novel biomarker to screen and diagnose hepatocellular carcinoma: A systematic review and meta-analysis: Cancer Med, 2020; 9(4); 1349-64
35. Zhang Z, Xie H, Chen P, Cao P, Development and identification of a nomogram prognostic model for patients with primary clear cell carcinoma of the liver: Med Sci Monit, 2020; 26; e919789
36. Van Calster B, Wynants L, Verbeek JFM, Reporting and interpreting decision curve analysis: a guide for investigators: Eur Urol, 2018; 74(6); 796-804
37. Liu GM, Zeng HD, Zhang CY, Xu JW, Identification of a six-gene signature predicting overall survival for hepatocellular carcinoma: Cancer Cell Int, 2019; 19; 138
38. Forbes SA, Beare D, Boutselakis H, COSMIC: Somatic cancer genetics at high-resolution: Nucleic Acids Res, 2017; 45(D1); D777-83
39. Forbes SA, Beare D, Bindal N, COSMIC: High-resolution cancer genetics using the catalogue of somatic mutations in cancer: Curr Prot Human Genet, 2016; 91; 10.11-11.37
40. Yi Y, Zhao Y, Li C, RAID v2.0: an updated resource of RNA-associated interactions across organisms: Nucleic Acids Res, 2017; 45(D1); D115-18
41. Tang Z, Li C, Kang B, GEPIA: A web server for cancer and normal gene expression profiling and interactive analyses: Nucleic Acids Res, 2017; 45(W1); W98-102
42. Yu G, Wang LG, Han Y, He QY, clusterProfiler: An R package for comparing biological themes among gene clusters: OMICS, 2012; 16(5); 284-87
43. Liu S, Lai W, Shi Y, Annotation and cluster analysis of long noncoding RNA linked to male sex and estrogen in cancers: NPJ Precis Oncol, 2020; 4; 5
44. Yang F, Yi X, Guo J, Association of plasma and urine metals levels with kidney function: A population-based cross-sectional study in China: Chemosphere, 2019; 226; 321-28
45. Zhang B, Liu P, Zhou Y, Dihydroartemisinin attenuates renal fibrosis through regulation of fibroblast proliferation and differentiation: Life Sci, 2019; 223; 29-37
46. Zhou X, Cui Y, Chen J, UCA1 promotes cell viability, proliferation and migration potential through UCA1/miR-204/CCND2 pathway in primary cystitis glandularis cells: Biomed Pharmacother, 2019; 114; 108872
47. Du Y, Liu P, Chen Z: J Cell Biochem, 2019; 120(10); 17887-97
48. Huang W, Cen S, Kang XL, TGF-β1-induced Fascin1 promotes cell invasion and metastasis of human 786-0 renal carcinoma cells: Acta Histochemica, 2016; 118(2); 144-51
49. Jeong D, Kim H, Kim D, Protein kinase, membrane-associated tyrosine/threonine 1 is associated with the progression of colorectal cancer: Oncol Rep, 2018; 39(6); 2829-36
50. Novak EM, Halley NS, Gimenez TM, BLM germline and somatic PKMYT1 and AHCY mutations: Genetic variations beyond MYCN and prognosis in neuroblastoma: Med Hypotheses, 2016; 97; 22-25
51. Tan X, Zhai Y, Chang W, Global analysis of metastasis-associated gene expression in primary cultures from clinical specimens of clear-cell renal-cell carcinoma: Int J Cancer, 2008; 123(5); 1080-88
52. Mittal V, Epithelial mesenchymal transition in tumor metastasis: Ann Rev Pathol, 2018; 13; 395-412
53. Pastushenko I, Blanpain C, EMT transition states during tumor progression and metastasis: Trends Cell Biol, 2019; 29(3); 212-26
54. Corpet A, De Koning L, Toedling J, ASF1B, the necessary Asf1 isoform for proliferation, is predictive of outcome in breast cancer: EMBO J, 2011; 30(3); 480-93
55. Klimovskaia IM, Young C, Strømme CB, Tousled-like kinases phosphorylate Asf1 to promote histone supply during DNA replication: Nat Commun, 2014; 5; 3394
56. Han G, Zhang X, Liu P, Knockdown of anti-silencing function 1B histone chaperone induces cell apoptosis via repressing PI3K/Akt pathway in prostate cancer: Int J Oncol, 2018; 53(5); 2056-66
57. Jiangqiao Z, Tao Q, Zhongbao C, Anti-silencing function 1B histone chaperone promotes cell proliferation and migration via activation of the AKT pathway in clear cell renal cell carcinoma: Biochem Biophys Res Commun, 2019; 511(1); 165-72
Figures
Figure 1. Flowchart of the study design.Figure 2. Bioinformatic analysis of ccRCC and normal kidney samples in the TCGA database.(A, B) The heatmap and volcano plot of the DEGs between 539 ccRCC cases and 72 normal samples. (C) Cluster dendrogram of DEGs and module screening based on gene expression profiles of 539 ccRCC samples. (D, E) Heatmap of the correlation coefficient expressed between modules. (F) Relationships between consensus module eigengenes and various clinical traits. (G) Analogous scatter plots for the yellow module. ccRCC – clear cell renal cell carcinoma; TCGA – The Cancer Genome Atlas; DEGs – differently expressed genes.Figure 3. PKMYT1 is prominently overexpressed in ccRCC. (A) PKMYT1 mRNA expression in multiple neoplasms and adjacent normal samples from the TIMER database. PKMYT1 mRNA level in ccRCC and normal kidney tissues from (B) the TCGA database, (C) GSE15641, (D) GSE36895, (E) GSE40435, and (F) GSE105261. ccRCC – clear cell renal cell carcinoma; TIMER – Tumor Immune Estimation Resource.Figure 4. PKMYT1 mRNA expression is significantly correlated with diversiform clinical variables in ccRCC cases from the TCGA database. PKMYT1 in individuals with ccRCC stratified by (A) T classification, (B) N classification, (C) M classification, (D) TNM stage, (E) histologic grade, (F) tumor status, and (G) the status of relapse. ccRCC – clear cell renal cell carcinoma; TCGA – The Cancer Genome Atlas; TNM – tumor, node, metastasis.Figure 5. PKMYT1 can effectively diagnose ccRCC. ROC curves reveal that PKMYT1 expression can differentiate adjacent normal tissues from (A) ccRCC and ccRCC at (B) TNM I stage, (C) TNM II stage, (D) TNM III stage, (E) TNM IV stage, (F) histological stage 1, (G) histological stage 2, (H) histological stage 3, and (I) histological stage 4. ccRCC – clear cell renal cell carcinoma; ROC: receiver operating characteristic; TNM – tumor, node, metastasis.Figure 6. Overexpressed PKMYT1 exerts negative effects on ccRCC prognosis. Survival analysis reveals OS between high PKMYT1 and low PKMYT1 mRNA levels in (A) all ccRCC cases from the TCGA database, (B) male patients, (C) cases with age >60 years, (D) TNM stage II, (E) cases at histological grade 4, and (F) ccRCC that has relapsed. ccRCC – clear cell renal cell carcinoma; OS – overall survival; TCGA – The Cancer Genome Atlas; TNM, tumor, node, metastasis.Figure 7. Nomogram model incorporating PKMYT1 mRNA expression and significant clinical variables to predict OS of ccRCC. (A) Nomogram for predicting the 3-, 5-, and 10-year OS of patients with ccRCC from the TCGA database. The calibration curves of OS at (B) 3, (C) 5, and (D) 10 years for ccRCC. OS – overall survival; ccRCC – clear cell renal cell carcinoma; TCGA – The Cancer Genome Atlas.Figure 8. The predictive value and clinical utility of PKMYT1 expression level was assessed through time-dependent ROC and DCA. ROC curves of nomogram, PKMYT1 expression level, and additional clinical variables for (A) 3-, (B) 5- and (C) 10-year OS of ccRCC. (D) DCA curves of above parameters for prediction of OS in ccRCC. ROC – receiver operating characteristic; DCA – decision curve analysis; OS – overall survival; ccRCC – clear cell renal cell carcinoma.Figure 9. PKMYT1 mutations are infrequent in ccRCC. (A) Schematic diagram describing PKMYT1 mutations in ccRCC based on the cBioportal. (B, C) Different PKMYT1 mutation types and the corresponding mutation proportions in ccRCC. ccRCC – clear cell renal cell carcinoma.Figure 10. A series of genes coexpressed with PKMYT1 are revealed based on multi-database mining methods. (A) RAID map concerning miRNA, lncRNA, RBP, and TF interacting with PKMYT1. (B) The top 20 genes positively correlated with PKMYT1 expression in ccRCC based on the cBioPortal. (C) Heatmap of the top 50 DEGs that positively are coexpressed with PKMYT1 in ccRCC from the TCGA. (D) Venn diagram of the 52 common genes positively coexpressed with PKMYT1 in ccRCC through overlapping the TCGA, cBioPortal and GEPIA database. Abbreviations: RAID – RNA InterActome Database; miRNA – microRNA; lncRNA – long noncoding RNA; RBP – RNA-binding protein; TF – transcription factor; ccRCC– clear cell renal cell carcinoma; TCGA – The Cancer Genome Atlas; GEPIA – Gene Expression Profiling Interactive Analysis.Figure 11. PKMYT1 accelerates ccRCC progression by modulating the tumor cell cycle. The most significant signaling pathways in ccRCC found through (A) GO, (B) KEGG analysis, and (C) GSEA. Abbreviations: ccRCC – clear cell renal cell carcinoma; GO – gene ontology; KEGG – Kyoto Encyclopedia of Genes and Genomes; GSEA – gene set enrichment analysis.Figure 12. PKMYT1 is significantly correlated with ASF1B gene expression in ccRCC. There was a positive correlation between PKMYT1 and ASF1B based on (A) cBioPortal regression analysis, (B) GEPIA, and (C) TCGA dataset. (D) ASF1B was significantly increased in ccRCC compared with normal tissue. (E) High expression of ASF1B was associated with poor prognosis for ccRCC. ccRCC – clear cell renal cell carcinoma; GEPIA – Gene Expression Profiling Interactive Analysis; TCGA – The Cancer Genome Atlas. Tables
Table 1. Correlation between PKMYT1 mRNA levels and clinicopathological parameters in 530 patients with ccRCC from the TCGA database.Table 2. Univariate and multivariate analyses of OS in patients with ccRCC in the TCGA database.Table 3. The top 20 genes positively correlated with PKMYT1 mRNA expression in ccRCC from the GEPIA database.Table 1. Correlation between PKMYT1 mRNA levels and clinicopathological parameters in 530 patients with ccRCC from the TCGA database.Table 2. Univariate and multivariate analyses of OS in patients with ccRCC in the TCGA database.Table 3. The top 20 genes positively correlated with PKMYT1 mRNA expression in ccRCC from the GEPIA database. In Press
Clinical Research
Effects of Single-Bout Endurance Exercise Intensity on Peripheral Neurotrophic Factors in Patients With Isc...Med Sci Monit In Press; DOI: 10.12659/MSM.952089
Review article
Anisodus tanguticus in Cancer Research: A Review of Traditional Use, Phytochemistry, Extraction Methods, an...Med Sci Monit In Press; DOI: 10.12659/MSM.952999
Clinical Research
Nasal Mucociliary Clearance and Its Relationship With Disease Severity in Patients With Multiple SclerosisMed Sci Monit In Press; DOI: 10.12659/MSM.952850
Clinical Research
Modified Thoracoabdominal Nerves Block Through the Perichondrial Approach vs Subcostal Transversus Abdomini...Med Sci Monit In Press; DOI: 10.12659/MSM.953976
Most Viewed Current Articles
17 Jan 2024 : Review article 14,176,570
Vaccination Guidelines for Pregnant Women: Addressing COVID-19 and the Omicron VariantDOI :10.12659/MSM.942799
Med Sci Monit 2024; 30:e942799
13 Nov 2021 : Clinical Research 3,762,188
Acceptance of COVID-19 Vaccination and Its Associated Factors Among Cancer Patients Attending the Oncology ...DOI :10.12659/MSM.932788
Med Sci Monit 2021; 27:e932788
14 Dec 2022 : Clinical Research 2,466,310
Prevalence and Variability of Allergen-Specific Immunoglobulin E in Patients with Elevated Tryptase LevelsDOI :10.12659/MSM.937990
Med Sci Monit 2022; 28:e937990
16 May 2023 : Clinical Research 708,927
Electrophysiological Testing for an Auditory Processing Disorder and Reading Performance in 54 School Stude...DOI :10.12659/MSM.940387
Med Sci Monit 2023; 29:e940387