08 November 2020: Database Analysis
Identification of the Prognostic Value and Clinical Significance of Interferon Regulatory Factors (IRFs) in Colon Adenocarcinoma
Munire Yuemaier1ABCDEF, Zhiqiang Zhou1AEFG*, Youxu Zhou2ABCDE, Chengwen Wu1CDE, Fei Li1CDEF, Xiaodan Liang1BCEF, Haihan Kang1BCDEF, Dongfang Shen1FG, Fei Gao1EFG, Jinxi Lin2EDOI: 10.12659/MSM.927073
Med Sci Monit 2020; 26:e927073


Abstract
BACKGROUND: Colon adenocarcinoma (COAD) is one of the most common malignant tumors and has high incidence and mortality rates. The interferon regulatory factor (IRF) family is known as a key transcription factor in the IFN signaling pathway and cellular immunity. This research explored the relationship between the IRF family and COAD through use of bioinformatics technology.
MATERIAL AND METHODS: Using the UALCAN and GEPIA databases, we analyzed the transcription and prognostic value of IRFs in COAD, and GSCALite was used in cancer genomics analysis. TIMER, LinkedOmics, and Metascape were used to assess the potential function of IRFs in COAD.
RESULTS: The transcription levels of IRF3 were elevated in COAD tissues, while IRF2/4/6 were downregulated compared with normal patients in subgroup analyses of race, age, weight, sex, nodal metastasis, individual cancer stages, TP53 mutation status, and histological subtypes. IRF3 and IRF7 in COAD were significantly associated with a poor prognosis. Drug sensitivity analysis revealed that the expression level of IRF2/4/8 was negatively associated with drug resistance. A significant correlation was found between the IRF family and immune cell infiltration. Moreover, enrichment analysis revealed that the IRFs were associated with response to tumor necrosis factor, transcription misregulation in cancer, and JAK-STAT signaling pathway. We also identified several kinase and miRNA targets of the IRF family in COAD.
CONCLUSIONS: We identified IRF3 and IRF7 as prognostic biomarkers in COAD, and the IRF family was associated with immune cell infiltration and gene regulation networks, providing additional evidence showing the significant role of the IRF family in COAD.
Keywords: Biological Markers, Colorectal Neoplasms, Interferon Regulatory Factors, Colonic Neoplasms, DNA Methylation, Gene Dosage, gene ontology, genetic variation, Transcription, Genetic
Background
Colon adenocarcinoma (COAD) has a high incidence rate and is the third most common adenocarcinoma worldwide. High-risk groups include people older than 50 years, with a family history, and with hereditary familial polyposis, as well as younger patients, who, unfortunately, tend to be diagnosed at a more advanced stage of COAD. To identify these patients more quickly and easily, reliable biomarkers are needed to predict disease status and prognosis. In 2018 alone, there were over 1.8 million new colon cancer cases and 880 000 COAD-related deaths. Notably, the disease is beginning to develop at a younger age [1,2]. Despite the decreased incidence of COAD-related deaths because of improvements in early detection through screening programs, including endoscopy and fecal occult blood testing, patients continue to present with advanced disease [3]. Molecular markers, such as carcinoembryonic antigen (CEA) and carbohydrate antigen 19-9(CA19-9), have been used in COAD diagnosis. However, patients at all COAD stages continue to die of the disease [4,5]. Therefore, exploring reliable biomarkers of the early pathological changes from the molecular mechanism could be crucial for early diagnosis, overall survival prediction, treatment effect, and targeted therapy development.
Interferon regulatory factors (IRFs) belong to the family of transcription factors and include IRF1-IRF9 members in both humans and mice. They are known for their critical roles in adaptive immunity [6]. Nonetheless, they are expressed in all tissue cells except for immune cells. Accumulating evidence indicates that IRFs crucially function in cell differentiation and apoptosis, cell cycle, and immunological regulation, which are associated with tumor progression [7,8]. Studies have shown that IRFs are involved in tumorigenesis by activating tumor-related gene transcription [9]. For instance, the elevated expression level of IRF2 in cancer cells promotes the activity of NF-κB during delivery of the activators (such as TNF-α). By enhancing the activity of NF-κB, the carcinogenic potential of IRF2 is increased [10]. However, the differences in the expression levels, molecular mechanisms, genetic variations, and prognostic significance of most IRFs in COAD have not been thoroughly studied. In the present study, we performed bioinformatics analysis in public databases, including ULACAN, GEPIA, TCGA, and TIMER, to explore the correlation between IRF family members and COAD.
Material and Methods
DATASETS:
A total of 286 COAD patients were enrolled from The Cancer Genome Atlas (TCGA) dataset. None of them had received any form of chemoradiotherapy. We assessed the IRFs at the mRNA level using the following bioinformatics portals.
UALCAN:
UALCAN (http://ualcan.path.uab.edu) was used for evaluation of differences in IRF expression profiles between COAD and healthy tissues in the TCGA COAD dataset (n= 286). This site analyzes the relative expression of a target gene(s) of the tumor and normal samples, including the analysis of tumor subgroups based on individual cancer stage, tumor grade, or other clinicopathologic features [11]. Using these functions, we assessed the relationship between IRFs expression level and patient survival using the t test. P<0.05 was considered statistically significant.
GEPIA:
We used the online database Gene Expression Profiling Interactive Analysis (GEPIA) (http://gepia.cancer-pku.cn/index.html), a web-based tool to deliver gene expression correlation analysis with data based on TCGA. The functions that GEPIA provides include correlation analysis, patient survival analysis, and profiling plotting [12]. Through use of this database, we assessed correlations between the expression level of IRFs and disease-free survival (DFS)/overall survival (OS) in COAD. The top 10 genes correlated with each IRFs member in COAD were analyzed using the Spearman correlation test. P<0.05 was considered statistically significant.
GSCALITE:
GSCALite (http://bioinfo.life.hust.edu.cn/web/GSCALite/) provides a methylation module to establish the IRFs methylation level in COAD [13]. The t test was used to define differences in methylation between tumor and normal samples. We tested the association between paired mRNA expression and methylation based on Pearson’s product-moment correlation coefficient, and it follows a t distribution. P values were adjusted by FDR, with FDR ≤0.05 considered as significant. Moreover, the single-nucleotide variation (SNV) frequency and variant types of IRFs in COAD, as well as the association between the IRF family and drug sensitivity, were explored. The SNV summary and oncoplot waterfall plot were generated using maftools [14].
TIMER:
The Tumor Immune Estimation Resource (TIMER) (cistrome.shinyapps.io/timer) is a public web resource that can infer the abundance of tumor-infiltrating immune cells (TIICs) from the gene expression profiles. The 6 major analytic modules, including gene expression, clinical outcomes, and somatic mutations. They enable users to analyze the correlation between immune infiltrations and various factors [15]. In the present study, the IRFs expression was correlated with the abundance of immune cell infiltrates in COAD as assessed with the gene module, and the results are displayed by scatter plots. Furthermore, to compare TIICs abundance in COAD with different copy number distortions of the IRF family, we used SCNA modules, and for each TIIC subset, a box plot was generated to compare the distribution of the abundance of TIICs with different gene mutation status, with the statistical significance estimated using the two-sided Wilcoxon rank-sum test. This analysis was performed based on the TCGA COAD dataset (n=286). P<0.05 was considered statistically significant.
LINKEDOMICS:
LinkedOmics (http://www.linkedomics.org/) includes multi-omics data and clinical data for 32 cancer types from the TCGA dataset [16]. We performed kinase target enrichment and miRNA target enrichment of the IRF family in COAD. The results are graphically presented in volcano plots, heat maps, or scatter plots. The rank criterion was the minimum number of genes (size) of 9 and the simulation of 500, and P<0.05 was considered statistically significant.
METASCAPE:
Metascape (http://metascape.org) is a productive gene function annotation analysis tool to annotate a large number of genes and to identify enriched pathways [17]. The top 10 genes correlated with each IRFs member in COAD were extracted from the GEPIA dataset, and these genes were analyzed through Metascape. With GO and KEGG methods, we are able to analyze a gene list related to IRFs to identify the most frequently altered linked genes and constructed protein-protein interaction networks from lists of genes and proteins.
Results
EXPRESSION LEVEL OF IRFS IN COAD:
The differences in transcription levels of IRFs between COAD and normal tissues were evaluated using the UALCAN databases to study the expression profiles of IRFs in COAD patients. Compared with normal tissues, IRF3 (Figure 1C, P=1.62E-12) was upregulated in COAD tissues (Figure 1). However, IRF2 (Figure 1B, P=4.39E-12), IRF4 (Figure 1D, P=1.55E-08), IRF6 (Figure 1F, P=8.56E-04), and IRF7 (Figure 1G, P=5.01E-03) were downregulated in COAD tissues relative to the healthy tissues, and there were no significant differences in the transcription levels of IRF1/5/8/9 between COAD and healthy tissues. Additionally, UALCAN allowed us to discover the relationship between the expression levels of IRFs in COAD and pathological clinical features. The boxplots indicate that transcription levels of IRF2 (Figure 2A), IRF4 (Figure 3A), and IRF6 (Figure 3B) in COAD patients were downregulated compared with normal patients in subgroup analyses regarding race, age, weight, sex, nodal metastasis, individual cancer stages, TP53 mutation status, and histological subtypes. In contrast, the IRF3 mRNA levels (Figure 2B) were higher in COAD patients than in healthy persons in the subgroup analyses in all pathological clinical features. There was no significant change in IRF7 (Figure 3C). Interestingly, the expression levels of IRF3 were significantly different, and overweight and male patients had much higher IRF3 mRNA levels. Moreover, regarding nodal metastasis, the IRF3 levels in the N2 stage were noticeably higher than in the other stages. In the TP53-nonmutant type and mucinous adenocarcinoma, IRF3 mRNA levels were distinctly upregulated. In the methylation analysis, the methylation levels of most IRFs in COAD tissues were elevated, whereas IRF1 was downregulated (Figure 4A). In addition, methylation was negatively correlated with the expression of IRFs in COAD (Figure 4B).
PROGNOSTIC VALUE OF IRF FAMILY IN COAD:
GEPIA established the prognostic value of IRFs expression levels in COAD patients. In COAD patients, high expression levels of IRF3/7 were significantly associated with poor OS (Figure 5A). However, the expression level of IRFs in COAD patients was independent of DFS (Figure 5B). Overall, elevated mRNA levels of IRF3/7 were significantly associated with poor prognosis; therefore, IRF3/7 are potential biomarkers for predicting the survival of COAD patients.
GENETIC VARIATION:
The genetic variation in the IRF family in COAD is shown in Figure 6. These variations include missense mutation, splice site, frameshift insertion, frameshift deletion, multi-hit, nonsense mutation, and in-frame deletion (Figure 6). Next, the role of the IRF family in crucial cancer-related pathways was evaluated. We established that the IRF family is involved in activation of tumor cell apoptosis pathways and the hormone ER pathway. We also found that IRFs inhibit the cell cycle and DNA damage pathways (Figure 7). Therefore, genomic aberrations could serve as potential biomarkers for drug screening and affect clinical responses to treatment. Drug sensitivity analysis showed the expression levels of IRF2/4/8 were negatively associated with drug resistance (Figure 8).
IMMUNE INFILTRATION OF IRF FAMILY IN COAD PATIENTS:
We next used the TIMER web resource to investigated whether IRFs expression is related to immune infiltration levels in COAD. Tumor purity is an important factor in using genomic approaches because it influences the analysis of immune infiltration in clinical tumor samples [18]. The expression levels of IRF family members in COAD was associated with infiltrating immune cells, including neutrophils, CD8+ T cells, dendritic cells, macrophage B cells, and CD4+ T cells (Figure 9, Table 1). In general, our results reveal the relationship between IRFs expression levels and immune infiltration levels in COAD. Additionally, the copy number variations in the IRF family suppressed the levels of infiltrating immune cells (Figure 10).
ENRICHMENT ANALYSIS OF IRF FAMILY IN COAD:
We further investigated the potential role of IRFs in COAD pathogenesis and development via gene enrichment analysis of the pathways and processes in 90 neighboring genes (Figure 11, Table 2). IRFs and the vicinal genes were significantly enriched in molecular functions (MF), biological processes (BP), cellular component (CC), and pathways involved in interactions. GO enrichment analysis showed highly enriched signal regulation pathways, including type I interferon signaling cascade, response to interferon-gamma, regulation of cytokine production, response to tumor necrosis factor, and interleukin-27-mediated signaling axis (Figure 11A, 11B, Table 3). The top 7 KEGG pathways of the IRF family members and adjacent genes are shown in Figure 11C, 11D and Table 4. Among these pathways, RIG-I-like receptor-signaling cascade, viral carcinogenesis, HTLV-1 infection, and transcription misregulation in cancer were associated with the development and pathogenesis of COAD. Moreover, the mCODE was retrieved and revealed that the IRF family and adjacent genes participate in the JAK-STAT signaling pathway and tuberculosis (Figure 11E, 11F).
KINASE AND MIRNA TARGETS OF IRF FAMILY IN COAD:
To determine the role of IRFs in COAD, we then explored the kinase target and miRNA target of the IRF family in COAD (Table 5). The results suggested that kinase LCK and LYN are common targets of IRF1/4/7/8/9. The kinase target of IRF5 is SYK and FYN. Kinase ATR as well as STK are kinase targets for IRF6. The kinase targets of IRF3 are IKBKB and PLK3. The miRNA targets of IRFs are shown in Table 6. The (TGTATGA) MIR-17-5P, MIR-20A, MIR-106A, MIR-106B, MIR-20B, MIR519D, and (TGTATGA) MIR-485-3P were suggested to be the miRNA targets of IRF3. (CCAGGGG) MIR-331 and (CAGTCAC) MIR-134 were suggested to be the miRNA targets of IRF7.
Discussion
The prognosis of COAD mainly depends on the extent of disease, and lack of reliable biomarkers results in late diagnosis and high mortality in COAD [19]. If a genetic diagnosis can be used to detect COAD at an early stage for effective intervention, the prognosis of patients will be greatly improved. The IRF family plays an important function in cancer immunobiology. During tumorigenesis, each member strictly controls the production and function of cells involved in the antitumor immune response [20]. The diverse role of IRFs in cancers has been reported, suggesting that IRFs modulate tumor progression and could be used as biomarkers. However, for COAD, there is no such specific description of the correlation between IRFs and COAD.
Firstly, we explored the transcription level of IRFs in COAD. IRF2/4/6 was downregulated in COAD patients regarding all kind of clinic pathologic features, while only IRF3 was highly expressed in COAD tissues. IRF1/5/8/9 showed the result was not statistically significant; however, a few studies showed that increased IRF1 and IRF2 levels were found in CRC tissues, and the high expression level of IRF2 was related to a more than 2-fold increase in the risk of all-cause mortality in CRC patients [21,22]. Although IRF7 was downregulated in COAD tissues, IRF3 and IRF7 were significantly associated with poorer overall survival. These data indicate that differentially expressed IRFs may play a significant role in COAD. As a recent study suggests, β-catenin is overexpressed in colorectal cancer and its expression level is positively associated with the level of IRF3 in CRC cells [23].
The present study demonstrates the molecular characteristics of IRFs in COAD. In COAD, the frequent genetic alterations in IRFs were differentially expressed. Genomic aberrations could serve as potential biomarkers for drug screening and affect clinical responses to treatment. Drug sensitivity analysis shows the expression levels of IRF2/4/8 were negatively associated with drug resistance, indicating that they are potential novel markers for drug screening.
Next, we focused on immune cell infiltration. Interestingly, in COAD patients, IRF3/5/7 had a weak correlation with B cells and CD8+ T cells infiltration level, while IRF1/2/4/6/8/9 showed a strong correlation with infiltration levels of all 6 types of immune cells (neutrophils, CD8+ T cells, dendritic cells, macrophage, B cells, and CD4+ T cells), and the change of copy number in the IRF family inhibits the level of infiltrating immune cells. Unlike the other IRF members, IRF3 expression had a very weak correlation with infiltration levels of B cells, CD8+ T cells, neutrophils, macrophages, and dendritic cells, but had a significant correlation with the CD4+T cells infiltration level in COAD patients. Studies revealed that, compared with normal colon tissues, there were more CD4+T cells in colorectal cancer tissues [24], and the correlation between IRF3 and CD+4 T cells suggested its role as a biomarker of IRF3 in COAD.
With GO enrichment analysis and KEGG pathway enrichment analysis, we found a potential role of IRFs in COAD development. The IRF family was mostly enriched in the type I interferon signaling cascade, which was expected because, expect for IRF6, the other members are all the primary regulator of type I IFN activation. The type I IFN signaling pathway is important for innate antiviral immunity, and pathway damage is related to increased risk of tumorigenesis. IRF9 can enhance the p53 pathway when cells are exposed to endogenous induced or exogenous type I interferon, suggesting that IRF9 has an anti-proliferation effect [7,20]. Results also showed that the IRFs were mainly associated with response to tumor necrosis factor, transcription misregulation in cancer, and the JAK-STAT signaling pathway. The JAK-STAT pathway is a common signal transduction pathway, but under pathological conditions, the activation of this pathway is associated with the proliferation of many malignant tumors [25]. An immunohistochemical experiment showed that the expression levels of JAK-1 and STAT-3 proteins were upregulated in colon cancer tissues, and the levels were an independent risk factor for the prognosis of colon cancer [26]. As our study showed, IRFs are closely related to the JAK-STAT pathway, which suggests that the high expression level of IRF3/7 in COAD patients may have a deeper relationship with the JAK-STAT signaling pathway in tumor development.
Finally, due to the different interactions of IRFs and the SRC family tyrosine kinases (LCK, LYN, and FYN), they play different roles in oncogenesis. The common kinase targets of IRF1/4/7/8/9 are LCK and LYN. LCK is important in tumorigenesis because the expression level of LCK is elevated in colorectal cancer cells, suggesting that LCK has a cancer-promoting role in CRC [27,28]. As the common kinase target of IRF5/6, SYK has been found to be a cancer suppressor in colorectal cancer [29]. PLK3, which is the kinase target of IRF3, contributes to regulation of cell proliferation and apoptosis, and studies showed that PLK3 was overexpressed in breast and ovarian cancer, but there is little evidence of the role of PLK3 in COAD [30]. The miRNA targets of IRF3 are upregulated in human colon cancer. For example, MIR-17-5p and MIR-20a are both highly expressed in colon cancer tissues, and the MIR-106 family was also found to be closely involved in the initiation and development of colorectal cancer [31,32]. On the contrary, the miRNA target of IRF7, MIR-331, was reported to be a tumor suppressor in colorectal carcinoma [33].
This study is the first to systematically demonstrate the association between the IRF family and COAD; however, it has some limitations. Because all the information was obtained from public databases, there are many influencing factors, such as the size and location of the tumor, and the medical parameters are incomplete, which could influence the results. Since the IRFs are correlated with cell cycle control and apoptosis, carcinogenesis, and immune responses, further studies are needed to elucidate the molecular mechanism involved.
Conclusions
Overall, these results indicate that IRF3 and IRF7 are prognostic biomarkers in COAD, and IRF family members are associated with immune cell infiltration and gene regulation networks. These results add to the growing evidence of the significant role of IRFs in COAD, and contribute to developing the prognostic value of IRFs in COAD.
Figures
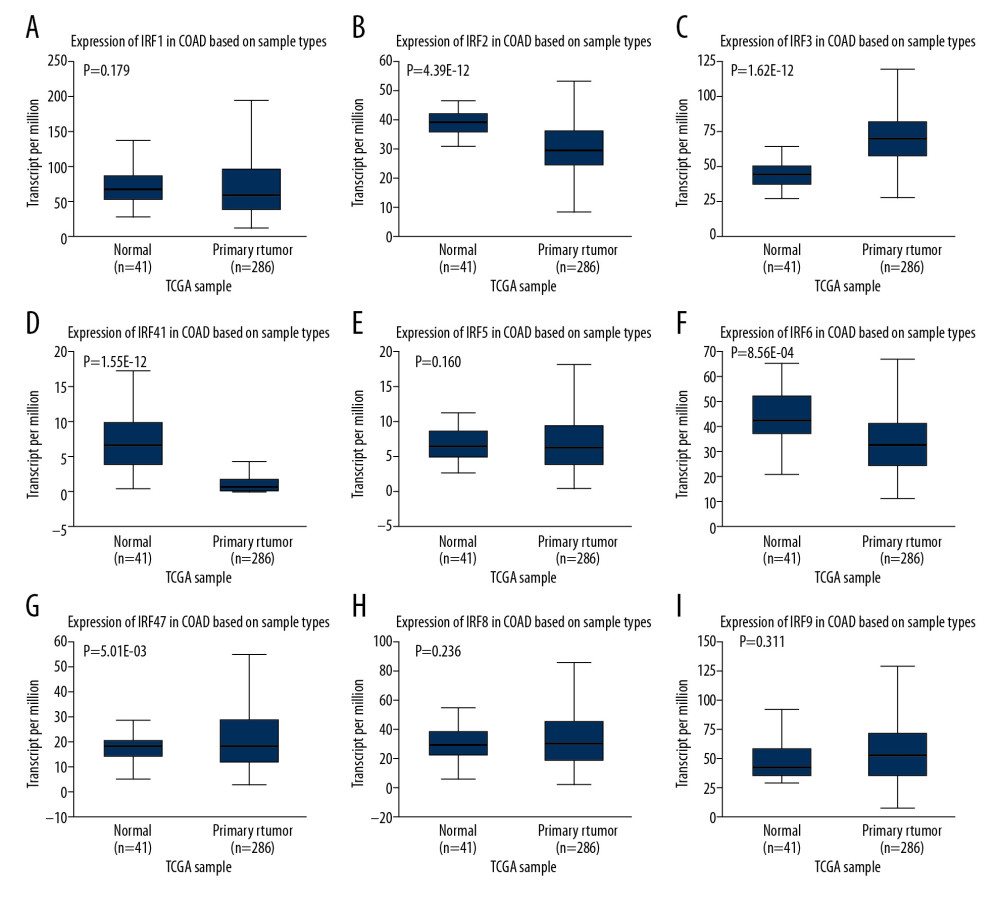 Figure 1. (A–I) The expression level of IRFs in COAD and normal tissues (ULCAN). The transcriptional level of IRF3 was substantially upregulated in COAD tissues relative to normal tissues. P<0.05 was considered statistically significant.
 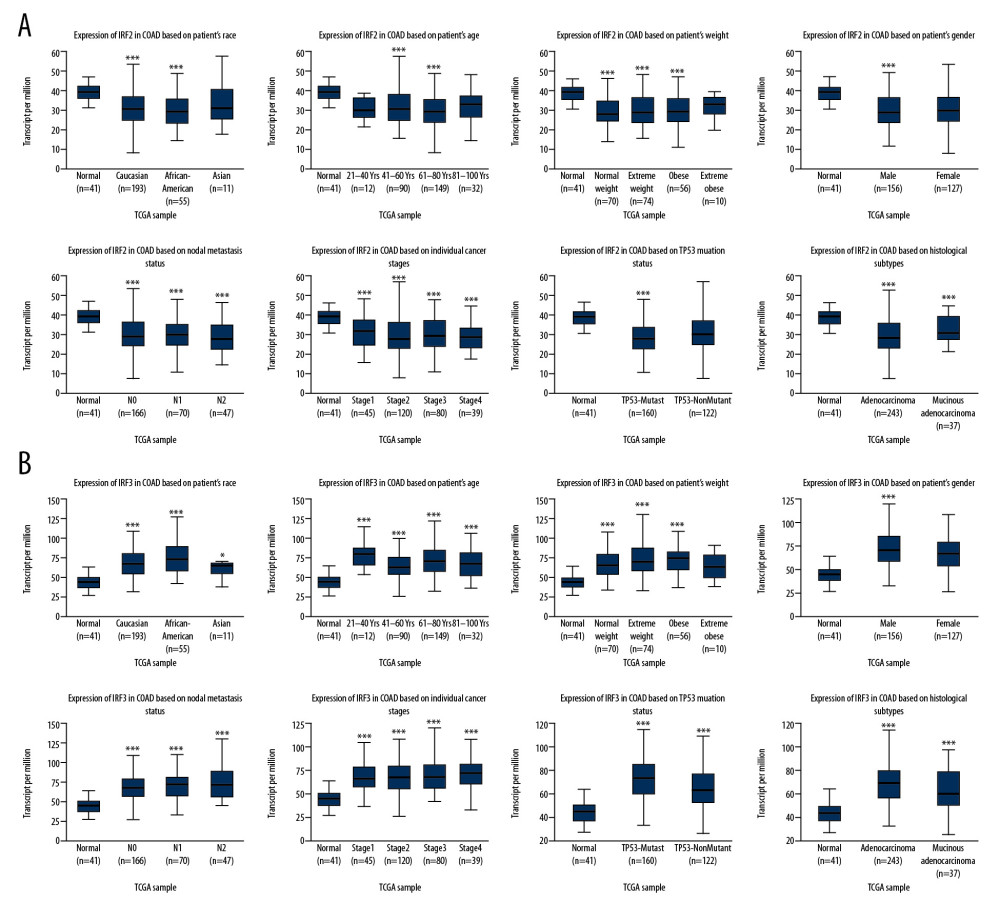 Figure 2. The transcription level of IRF2 (A) and IRF3 (B) in subgroups of COAD patients, stratified according to the following criteria: race, age, weight, sex, nodal metastasis, individual cancer stages, TP53 mutation status, and histological subtypes (UALCAN). Data are mean±SE. * P<0.05; ** P<0.01; *** P<0.001.
 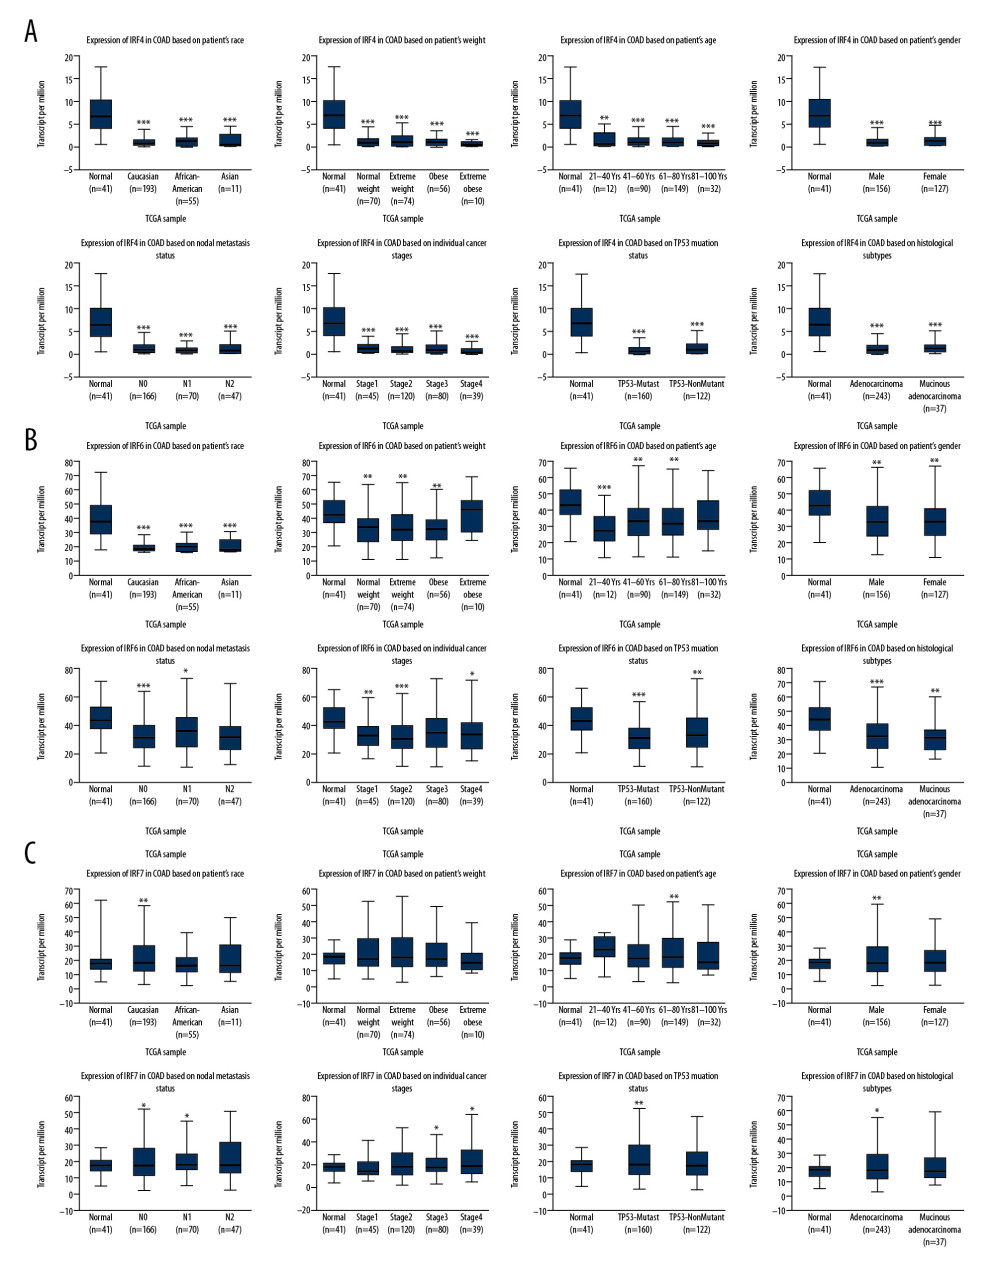 Figure 3. The transcription level of IRF4 (A), IRF6 (B), and IRF7 (C) in subgroups of COAD patients, stratified according to different criteria (UALCAN). Data are mean±SE. * P<0.05; ** P<0.01; *** P<0.001.
 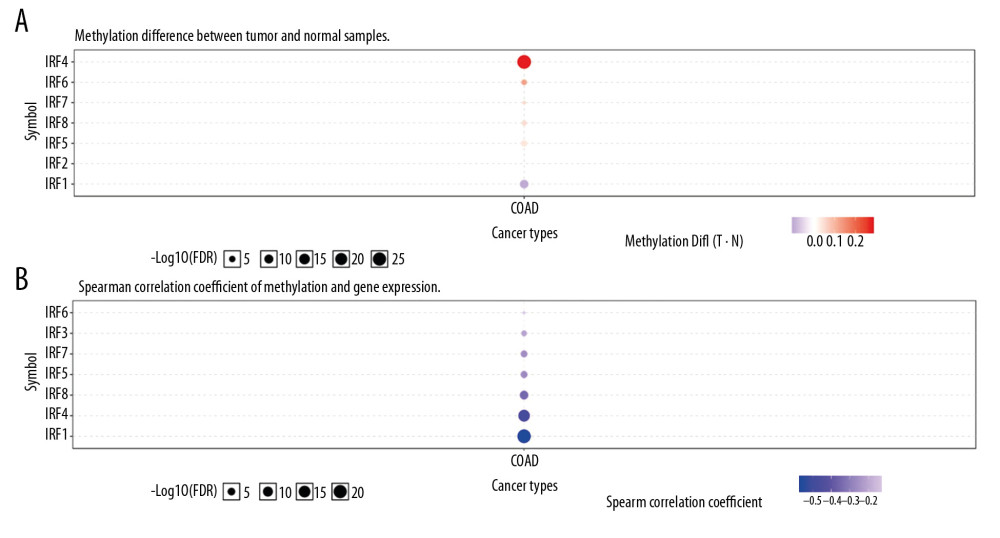 Figure 4. Methylation level of the IRFs in COAD tissues. The difference in IRF family methylation in COAD and normal specimens (A). Correlation between IRF family methylation and IRF family expression in COAD (B).
 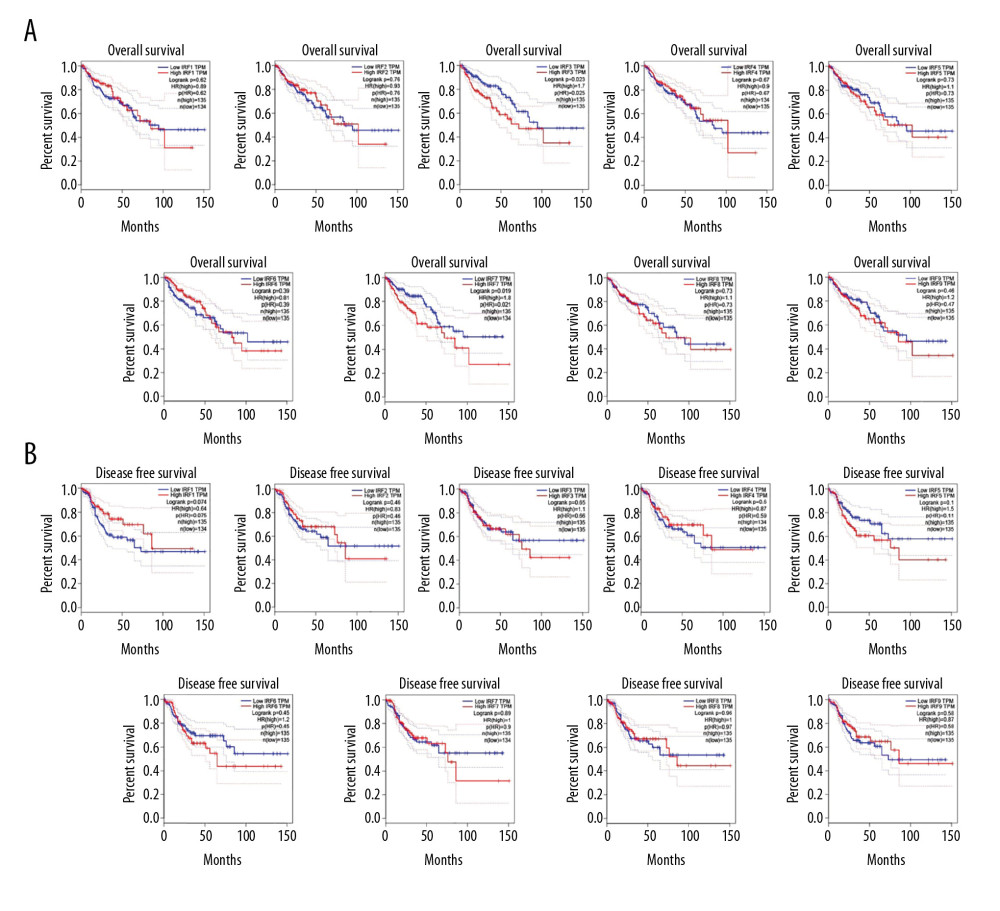 Figure 5. The prognostic value of mRNA level of IRFs in COAD. In COAD patients, the upregulated IRF3/7 was significantly related to the poor OS (A), while all members of the IRF family showed no prognostic value in DFS (B). The expression of other IRFs had no association with OS in COAD patients.
 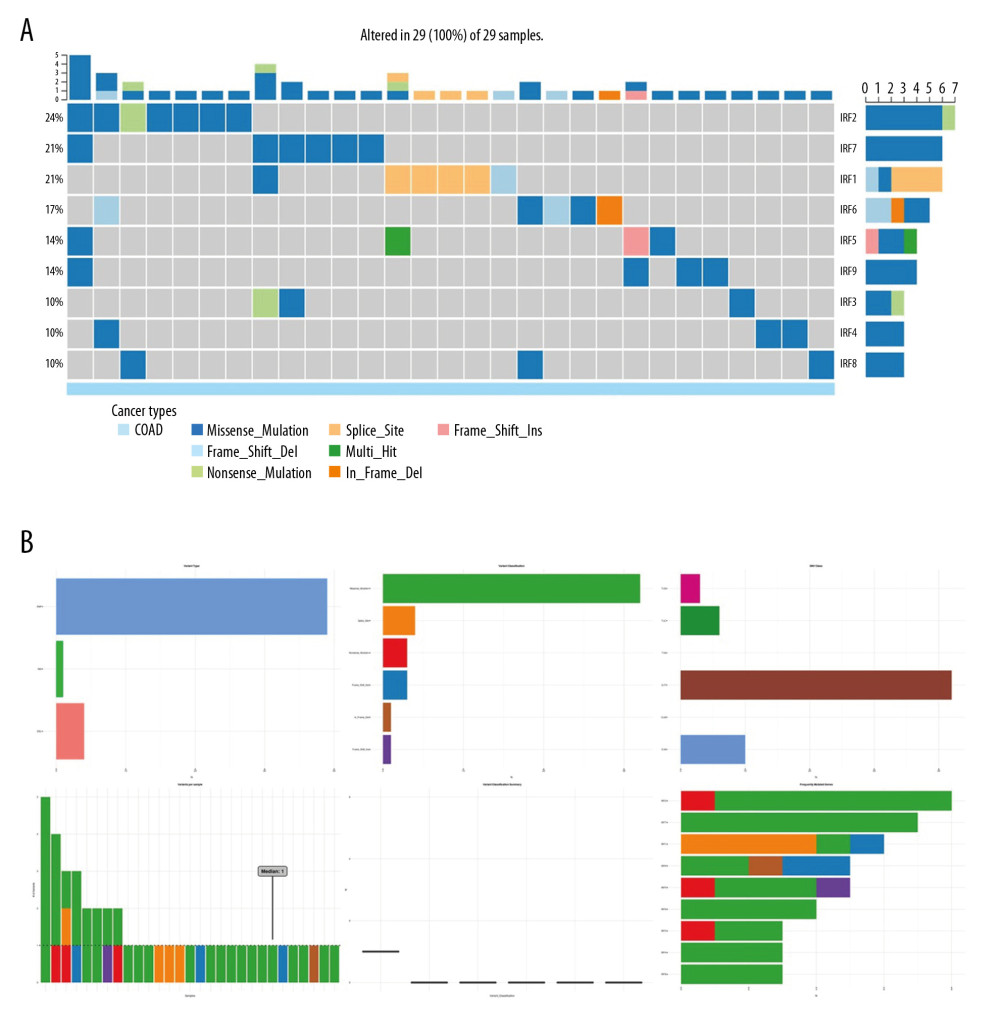 Figure 6. The genetic variation analysis of the IRF family in COAD. (A) Summary plot displays genetic variation frequency and variant types of IRF family in COAD. (B) Waterfall plot shows the genetic variation distribution of IRF family in COAD and a genetic variation classification.
 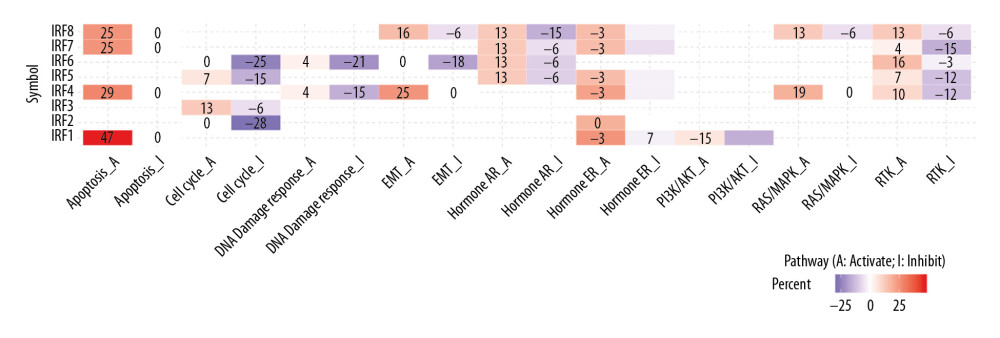 Figure 7. Cancer-related pathways analysis of the IRF family in COAD.
 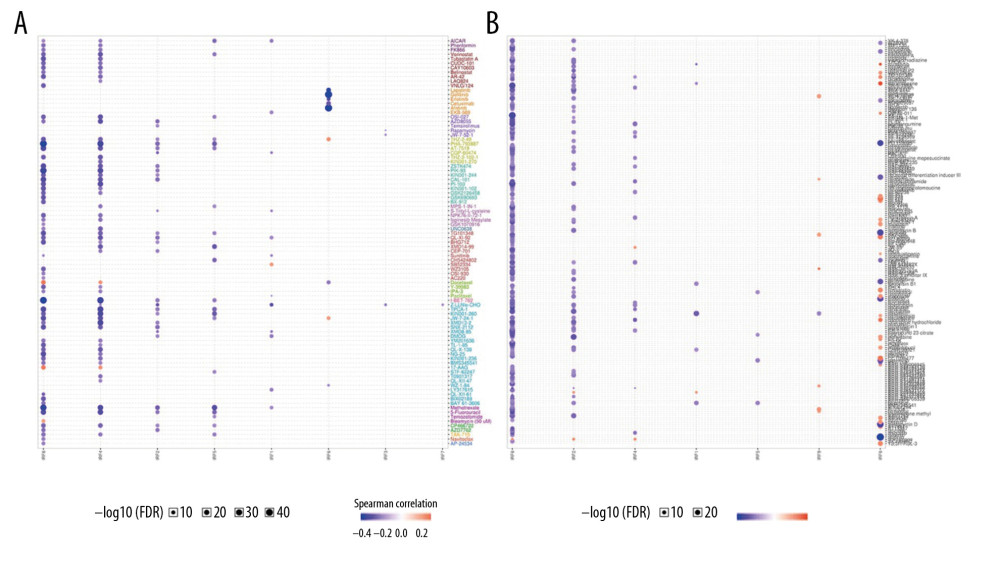 Figure 8. (A, B) Role of IRF family members in drug sensitivity. A positive correlation indicates that high gene expression is resistant to drugs and vice versa.
 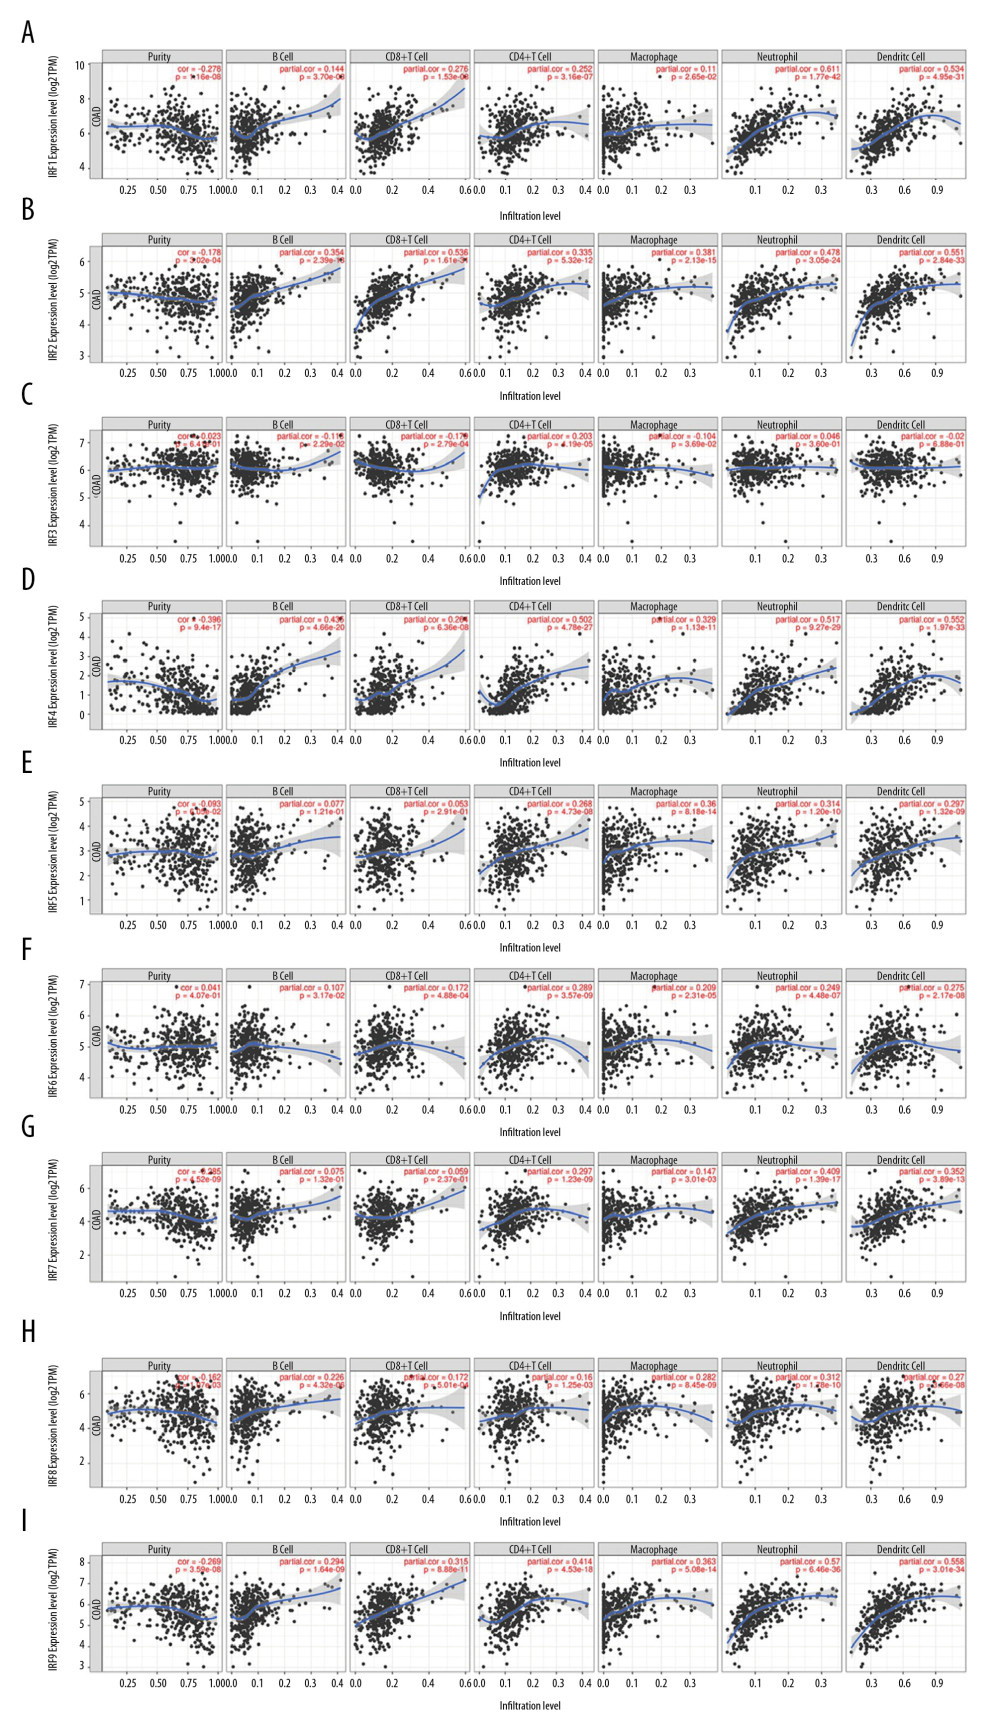 Figure 9. Correlation of IRFs expression with immune infiltration level in COAD tissues (TIMER). The scatter plots (A–I) identify the different profiles of immune cells associated with IRFs.
 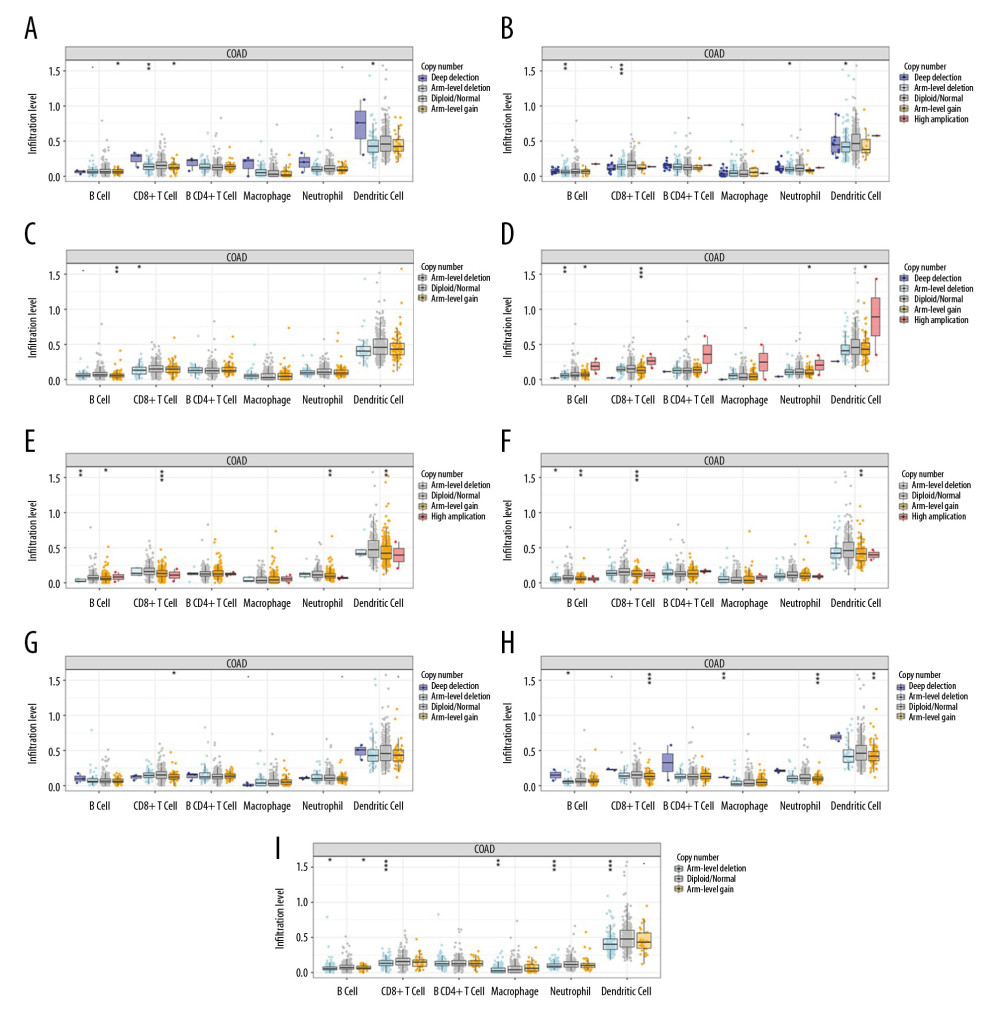 Figure 10. (A–I) Effect of copy number variation of the IRF gene family on the level of immune cell infiltration.
 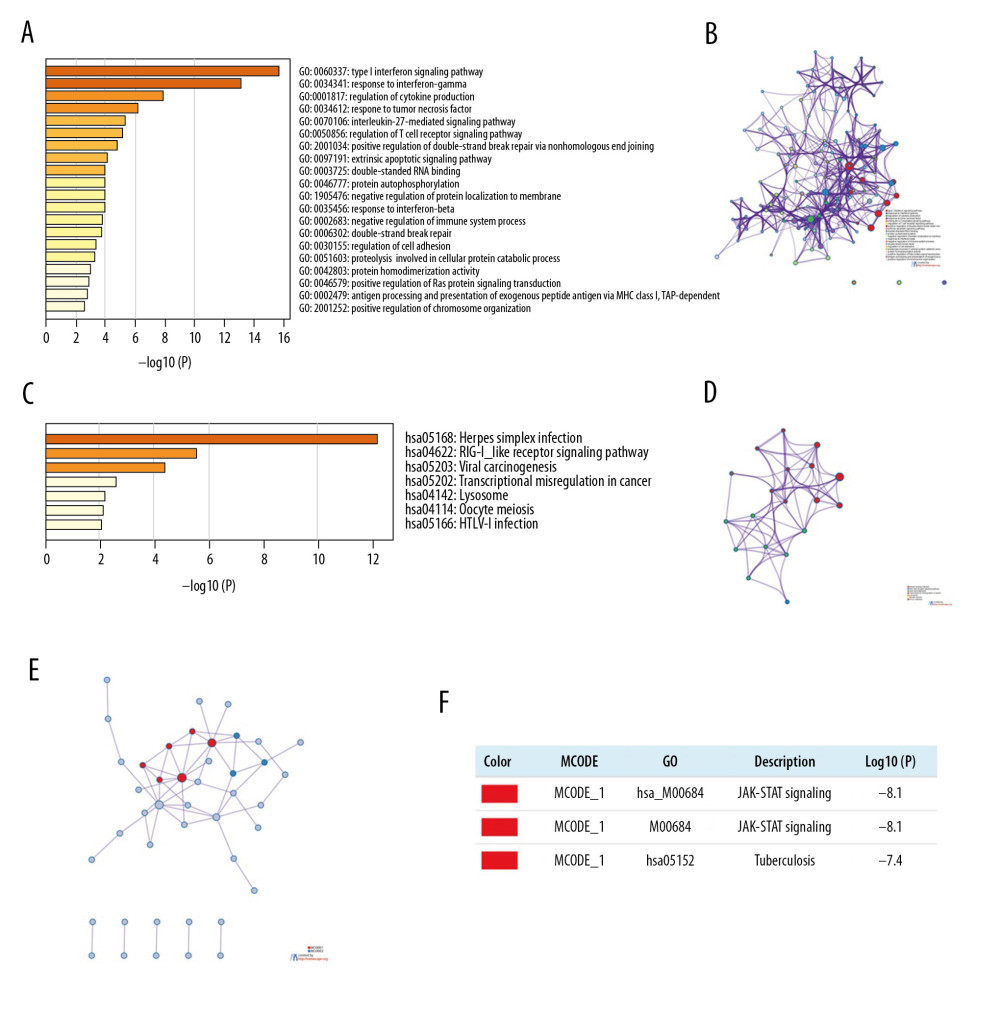 Figure 11. Functional enrichment analysis of IRFs in COAD (Metascape). (A, B) The enriched terms in GO analysis, colored by P value; (C, D) The enriched terms in KEGG pathways analysis, colored by P values. (E) PPI network and 3 most significant MCODE components. (F) Independent functional enrichment analysis of 3 MCODE components.
 Tables
Table 1. Comparison of gene expression and immune cell landscape.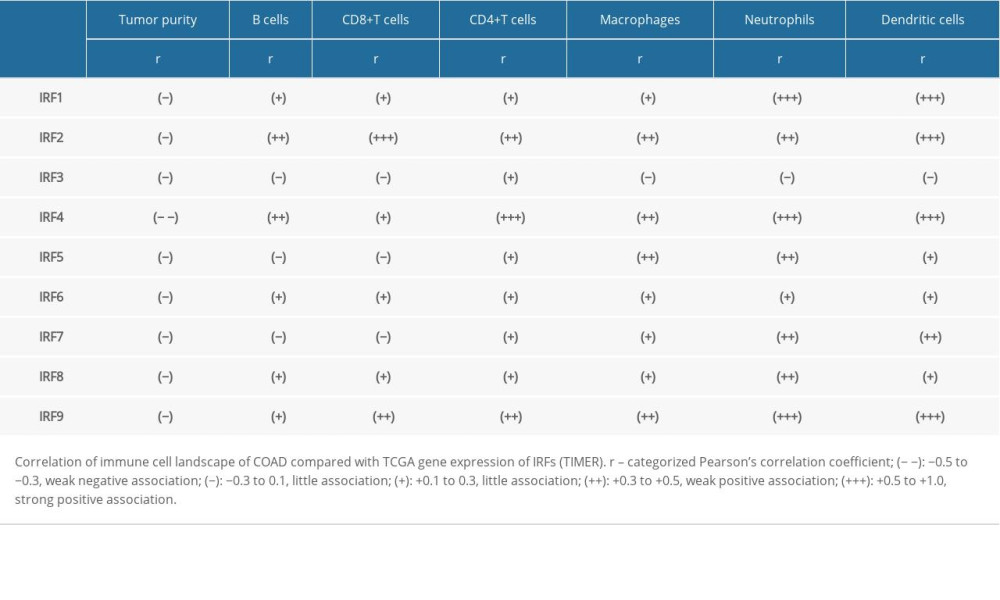 Table 2. Top 10 correlated genes of each member of IRF family in COAD (GEPIA).
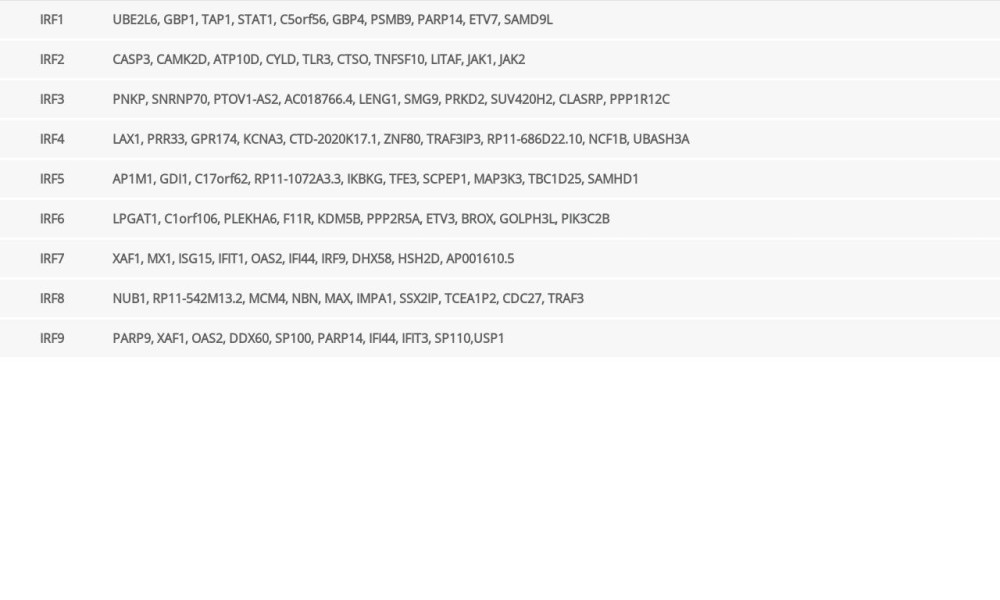 Table 3. GO function enrichment analysis of IRF family members and neighbor genes in COAD (Metascape).
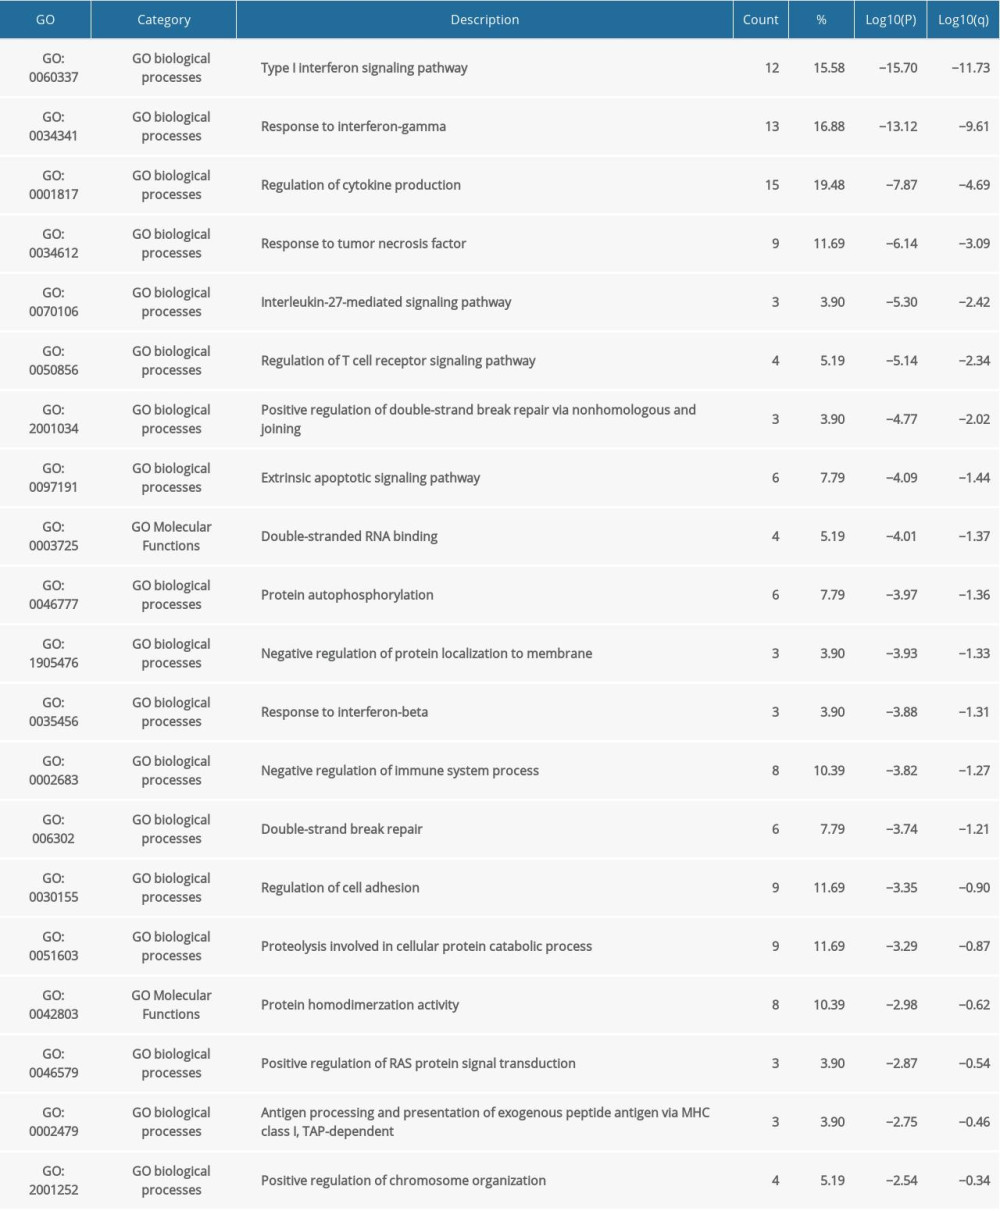 Table 4. KEGG function enrichment analysis of IRF family members and neighbor genes in COAD (Metascape).
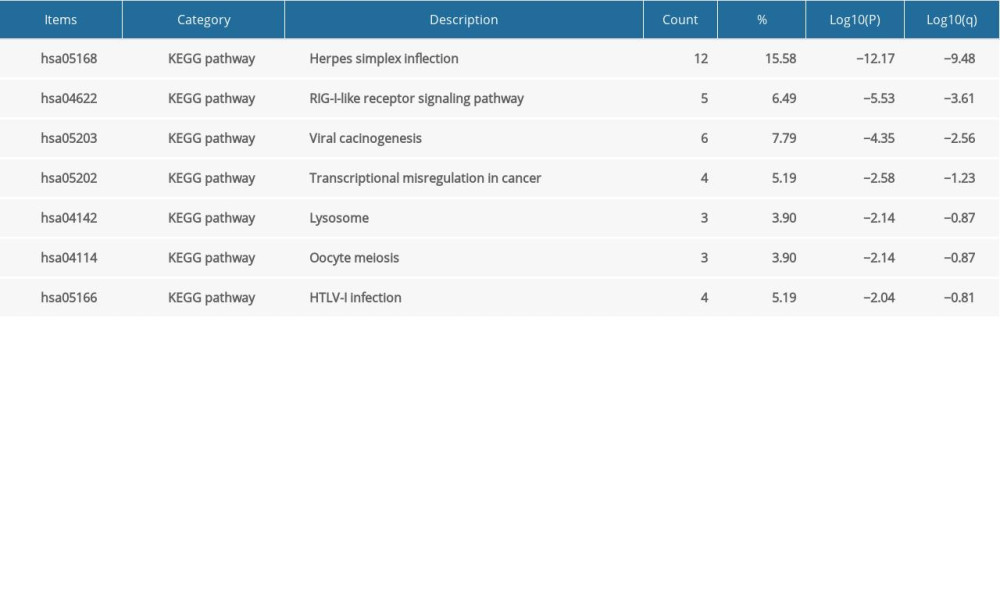 Table 5. Kinase target networks of the IRF family in COAD.
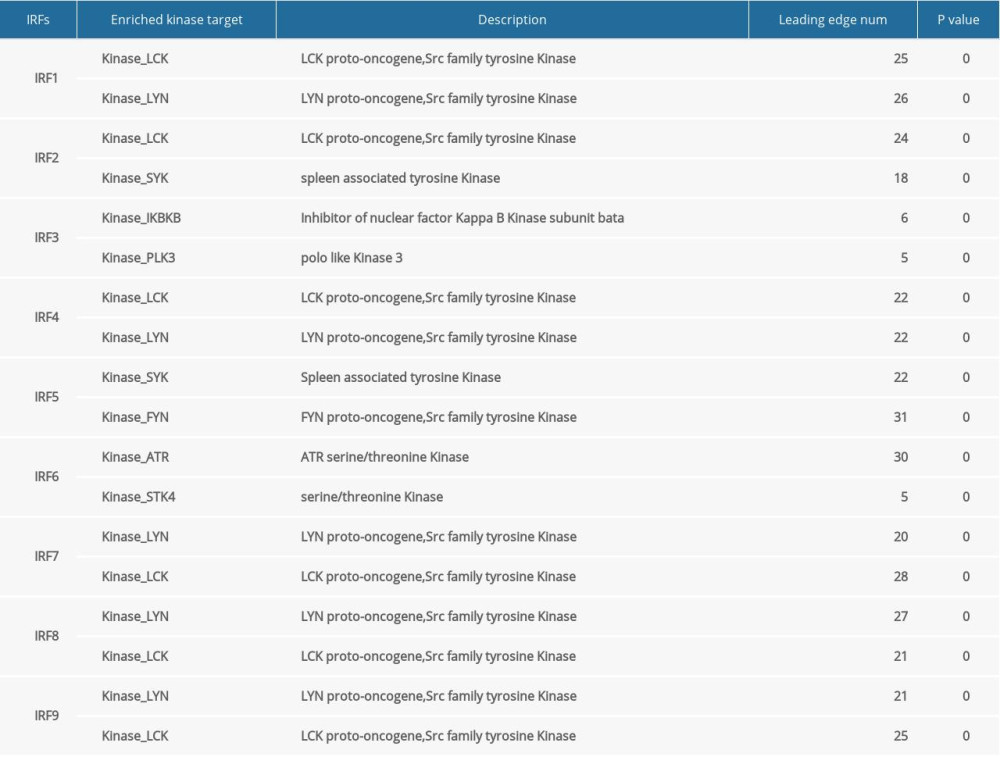 Table 6. miRNA target networks of the IRF family in COAD.
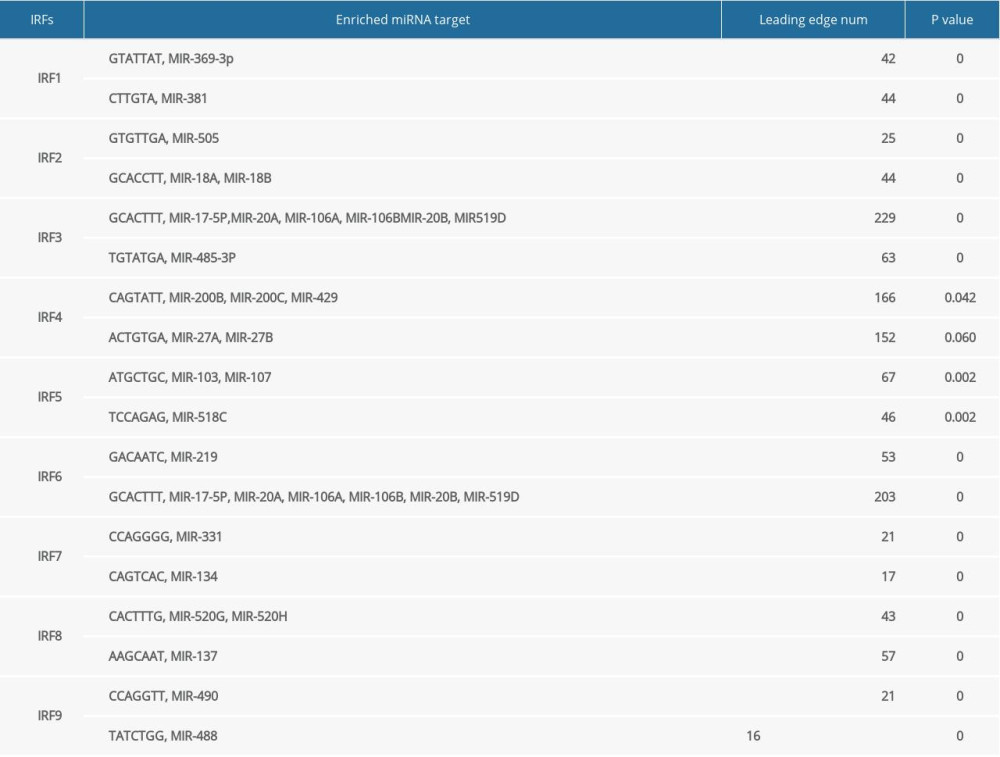
References
1. Bray F, Ferlay J, Soerjomataram I, Global cancer statistics 2018: GLOBOCAN estimates of incidence and mortality worldwide for 36 cancers in 185 countries [published correction appears in Cancer J Clin, 2020; 70(4): 313]: Cancer J Clin, 2018; 68(6); 394-424
2. Reddy BS, Diet and colon cancer: Evidence from human and animal model studies. In diet, nutrition, and cancer: A critical evaluation: Macronutrients and Cancer, 1986; 1; 47-65
3. Edwards BK, Ward E, Kohler BA, Annual report to the nation on the status of cancer, 1975–2006, featuring colorectal cancer trends and impact of interventions (risk factors, screening, and treatment) to reduce future rates: Cancer, 2010; 116(3); 544-73
4. Zhong W, Yu Z, Zhan J, Association of serum levels of CEA, CA199, CA125, CYFRA21-1 and CA72-4 and disease characteristics in colorectal cancer: Pathol Oncol Res, 2015; 21(1); 83, doi: 10.1007/s12253-014-9791-9
5. Shibutani M, Maeda K, Nagahara H, Significance of CEA and CA19-9 combination as a prognostic indicator and for recurrence monitoring in patients with stage II colorectal cancer: Anticancer Res, 2014; 34(7); 3753-58
6. Mancino A, Natoli G, Specificity and function of IRF family transcription factors: Insights from genomics: J Interferon Cytokine Res, 2016; 36(7); 462-69
7. Chen YJ, Li J, Lu N, Shen XZ, Interferon regulatory factors: A key to tumour immunity: Int Immunopharmacol, 2017; 49; 1-5
8. Yanai H, Negish H, Taniguchi T, The IRF family of transcription factors. Inception, impact and implications in oncogenesis: Oncoimmunology, 2012; 1(8); 1376-86
9. Vaughan PS, van der Meijden CM, Aziz F, Cell cycle regulation of histone H4 gene transcription requires the oncogenic factor IRF-2: J Biol Chem, 1998; 273(1); 194-99
10. Chae M, Kim K, Park SM, IRF-2 regulates NF-kappaB activity by modulating the subcellular localization of NF-kappaB: Biochem Biophys Res Commun, 2008; 370(3); 519-24
11. Chandrashekar DS, Bashel B, Balasubramanya SAH, UALCAN: A portal for facilitating tumor subgroup gene expression and survival analyses: Neoplasia, 2017; 19(8); 649-58
12. Tang Z, Li C, Kang B, GEPIA: A web server for cancer and normal gene expression profiling and interactive analyses: Nucleic Acids Res, 2017; 45(W1); W98-102
13. Zeng Q, Sun S, Li Y, Identification of therapeutic targets and prognostic biomarkers among CXC chemokines in the renal cell carcinoma microenvironment: Front Oncol, 2020; 9; 1555
14. Mayakonda A, Koeffler HP, Maftools: Efficient analysis, visualization and summarization of MAF files from large-scale cohort-based cancer studies: BioRxiv, 2016; 5; 052662
15. Li T, Fan J, Wang B, TIMER: A web server for comprehensive analysis of tumor-infiltrating immune cells: Cancer Res, 2017; 77(21); e108-10
16. Vasaikar SV, Straub P, Wang J, Zhang B, LinkedOmics: Analyzing multi-omics data within and across 32 cancer types: Nucleic Acids Res, 2018; 46(D1); D956-63
17. Zhou Y, Zhou B, Pache L, Metascape provides a biologist-oriented resource for the analysis of systems-level datasets: Nat Commun, 2019; 10(1); 1523
18. Yoshihara K, Shahmoradgoli M, Martínez E, Inferring tumour purity and stromal and immune cell admixture from expression data: Nat Commun, 2013; 4; 2612
19. Yang Y, Li XJ, Li P, Guo XT, MicroRNA-145 regulates the proliferation, migration and invasion of human primary colon adenocarcinoma cells by targeting MAPK1: Int J Mol Med, 2018; 42(6); 3171-80
20. Savitsky D, Tamura T, Yanai H, Taniguchi T, Regulation of immunity and oncogenesis by the IRF transcription factor family: Cancer Immunol Immunother, 2010; 59(4); 489-510
21. Hong M, Zhang Z, Chen Q, IRF1 inhibits the proliferation and metastasis of colorectal cancer by suppressing the RAS-RAC1 pathway: Cancer Manag Res, 2018; 11; 369-78
22. Mei Z, Wang G, Liang Z, Prognostic value of IRF-2 expression in colorectal cancer: Oncotarget, 2017; 8(24); 38969-77
23. Ding C, He J, Zhao J, β-catenin regulates IRF3-mediated innate immune signalling in colorectal cancer: Cell Prolif, 2018; 51(5); e12464
24. Toor SM, Murshed K, Al-Dhaheri M, Immune checkpoints in circulating and tumor-infiltrating CD4+ T cell subsets in colorectal cancer patients: Front Immunol, 2019; 10; 2936
25. Cui C, Cheng X, Yan L, Downregulation of TfR1 promotes progression of colorectal cancer via the JAK/STAT pathway: Cancer Manag Res, 2019; 11; 6323-41
26. Tang S, Yuan X, Song J, Association analyses of the JAK/STAT signaling pathway with the progression and prognosis of colon cancer: Oncol Lett, 2019; 17(1); 159-64
27. Nakamura K, Chijiiwa Y, Nawata H, Augmented expression of LCK message directed from the downstream promoter in human colorectal cancer specimens: Eur J Cancer, 1996; 32A(8); 1401-7
28. Janikowska G, Janikowski T, Pyka-Pająk A, Potential biomarkers for the early diagnosis of colorectal adenocarcinoma – transcriptomic analysis of four clinical stages: Cancer Biomark, 2018; 22(1); 89-99
29. Yang Z, Huo L, Chen H, Hypermethylation and prognostic implication of Syk gene in human colorectal cancer: Med Oncol, 2013; 30(2); 586
30. Helmke C, Becker S, Strebhardt K, The role of Plk3 in oncogenesis: Oncogene, 2016; 35(2); 135-47
31. Motoyama K, Inoue H, Takatsuno Y, Over- and under-expressed microRNAs in human colorectal cancer: Int J Oncol, 2009; 34(4); 1069-75
32. Peng Q, Shen Y, Zhao P, Biomarker roles identification of miR-106 family for predicting the risk and poor survival of colorectal cancer: BMC Cancer, 2020; 20(1); 506
33. Zhang H, Wang R, Wang M, miR-331-3p suppresses cell invasion and migration in colorectal carcinoma by directly targeting NRP2: Oncol Lett, 2019; 18(6); 6501-8
Figures
Figure 1. (A–I) The expression level of IRFs in COAD and normal tissues (ULCAN). The transcriptional level of IRF3 was substantially upregulated in COAD tissues relative to normal tissues. P<0.05 was considered statistically significant.Figure 2. The transcription level of IRF2 (A) and IRF3 (B) in subgroups of COAD patients, stratified according to the following criteria: race, age, weight, sex, nodal metastasis, individual cancer stages, TP53 mutation status, and histological subtypes (UALCAN). Data are mean±SE. * P<0.05; ** P<0.01; *** P<0.001.Figure 3. The transcription level of IRF4 (A), IRF6 (B), and IRF7 (C) in subgroups of COAD patients, stratified according to different criteria (UALCAN). Data are mean±SE. * P<0.05; ** P<0.01; *** P<0.001.Figure 4. Methylation level of the IRFs in COAD tissues. The difference in IRF family methylation in COAD and normal specimens (A). Correlation between IRF family methylation and IRF family expression in COAD (B).Figure 5. The prognostic value of mRNA level of IRFs in COAD. In COAD patients, the upregulated IRF3/7 was significantly related to the poor OS (A), while all members of the IRF family showed no prognostic value in DFS (B). The expression of other IRFs had no association with OS in COAD patients.Figure 6. The genetic variation analysis of the IRF family in COAD. (A) Summary plot displays genetic variation frequency and variant types of IRF family in COAD. (B) Waterfall plot shows the genetic variation distribution of IRF family in COAD and a genetic variation classification.Figure 7. Cancer-related pathways analysis of the IRF family in COAD.Figure 8. (A, B) Role of IRF family members in drug sensitivity. A positive correlation indicates that high gene expression is resistant to drugs and vice versa.Figure 9. Correlation of IRFs expression with immune infiltration level in COAD tissues (TIMER). The scatter plots (A–I) identify the different profiles of immune cells associated with IRFs.Figure 10. (A–I) Effect of copy number variation of the IRF gene family on the level of immune cell infiltration.Figure 11. Functional enrichment analysis of IRFs in COAD (Metascape). (A, B) The enriched terms in GO analysis, colored by P value; (C, D) The enriched terms in KEGG pathways analysis, colored by P values. (E) PPI network and 3 most significant MCODE components. (F) Independent functional enrichment analysis of 3 MCODE components. Tables
Table 1. Comparison of gene expression and immune cell landscape.Table 2. Top 10 correlated genes of each member of IRF family in COAD (GEPIA).Table 3. GO function enrichment analysis of IRF family members and neighbor genes in COAD (Metascape).Table 4. KEGG function enrichment analysis of IRF family members and neighbor genes in COAD (Metascape).Table 5. Kinase target networks of the IRF family in COAD.Table 6. miRNA target networks of the IRF family in COAD.Table 1. Comparison of gene expression and immune cell landscape.Table 2. Top 10 correlated genes of each member of IRF family in COAD (GEPIA).Table 3. GO function enrichment analysis of IRF family members and neighbor genes in COAD (Metascape).Table 4. KEGG function enrichment analysis of IRF family members and neighbor genes in COAD (Metascape).Table 5. Kinase target networks of the IRF family in COAD.Table 6. miRNA target networks of the IRF family in COAD. In Press
Clinical Research
Effects of Single-Bout Endurance Exercise Intensity on Peripheral Neurotrophic Factors in Patients With Isc...Med Sci Monit In Press; DOI: 10.12659/MSM.952089
Review article
Anisodus tanguticus in Cancer Research: A Review of Traditional Use, Phytochemistry, Extraction Methods, an...Med Sci Monit In Press; DOI: 10.12659/MSM.952999
Clinical Research
Nasal Mucociliary Clearance and Its Relationship With Disease Severity in Patients With Multiple SclerosisMed Sci Monit In Press; DOI: 10.12659/MSM.952850
Clinical Research
Modified Thoracoabdominal Nerves Block Through the Perichondrial Approach vs Subcostal Transversus Abdomini...Med Sci Monit In Press; DOI: 10.12659/MSM.953976
Most Viewed Current Articles
17 Jan 2024 : Review article 14,176,570
Vaccination Guidelines for Pregnant Women: Addressing COVID-19 and the Omicron VariantDOI :10.12659/MSM.942799
Med Sci Monit 2024; 30:e942799
13 Nov 2021 : Clinical Research 3,762,188
Acceptance of COVID-19 Vaccination and Its Associated Factors Among Cancer Patients Attending the Oncology ...DOI :10.12659/MSM.932788
Med Sci Monit 2021; 27:e932788
14 Dec 2022 : Clinical Research 2,466,310
Prevalence and Variability of Allergen-Specific Immunoglobulin E in Patients with Elevated Tryptase LevelsDOI :10.12659/MSM.937990
Med Sci Monit 2022; 28:e937990
16 May 2023 : Clinical Research 708,927
Electrophysiological Testing for an Auditory Processing Disorder and Reading Performance in 54 School Stude...DOI :10.12659/MSM.940387
Med Sci Monit 2023; 29:e940387