09 December 2020: Database Analysis
Identification of a 6-Gene Signature Associated with Resistance to Tyrosine Kinase Inhibitors: Prognosis for Clear Cell Renal Cell Carcinoma
Qinke Li1ABCE, Wenbo Yang1CD, Maoqing Lu1DF, Ronggui Zhang1AG*DOI: 10.12659/MSM.927078
Med Sci Monit 2020; 26:e927078
Abstract
BACKGROUND: Tyrosine kinase inhibitors (TKIs) are used to treat metastatic disease associated with clear cell renal cell carcinoma (ccRCC); however, most patients develop resistance after 6 to 15 months. As such, identifying biomarkers of TKI resistance may be useful for prognosis.
MATERIAL AND METHODS: We analyzed ChIP-seq data related to TKI resistance from the Gene Expression Omnibus and RNA-Seq and clinical data from The Cancer Genome Atlas database. We used univariate Cox analysis and Cox regression/Lasso analysis to determine a risk score. The Kaplan-Meier estimate and receiver operating characteristic curve verified the risk score’s sensitivity and specificity. The stratified analysis and the univariate and multivariate analyses revealed its predictive power. We predicted survival time by constructing a nomogram.
RESULTS: Of the 32 differentially expressed genes (DEGs) related to TKI resistance, 6 (ACE2, MMP24, SLC44A4, C1R, C1ORF194, ADAMTS15) were used to establish a risk score. Kaplan-Meier analysis showed that high-risk patients had shorter median survival times than low-risk patients, notably among those with metastatic disease (1.51 vs. 4.55 years). The stratified analysis revealed that patients with advanced disease had relatively higher risk scores than patients at early stages (P<0.001). Univariate analysis independently associated the 6-DEGs signature with the prognosis of metastatic ccRCC (hazard ratio, 1.217; 95% confidence interval, 1.090–1.358). The nomogram we constructed based on 6-DEGs signature and clinical parameters predicted survival time accurately.
CONCLUSIONS: We identified a 6-DEGs signature that permitted us to establish a risk score related to TKI resistance that can serve as a reliable biomarker for predicting the survival of patients with ccRCC.
Keywords: Biological Markers, Carcinoma, Renal Cell, Drug Resistance, Calibration, Cohort Studies, Gene Expression Profiling, Kidney Neoplasms, Multivariate Analysis, nomograms, Proportional Hazards Models, Protein Kinase Inhibitors, Reproducibility of Results, Risk Factors, Survival Rate
Background
Renal cell carcinoma (RCC) is the most common urinary system tumor, accounting for 3.7% of all new malignant tumors [1]. In the past few decades, the development of imaging technology has facilitated diagnosis at earlier stages of the disease, thus resulting in significantly prolonged survival times [2,3]. Unfortunately, approximately one-third of patients diagnosed with clear cell RCC (ccRCC) have local or distant metastases at the time of diagnosis [2,4]; 30% to 40% of patients with early local metastases experience relapse or further metastatic disease, even after radical nephrectomy [5,6]. As such, the prognoses of patients with ccRCC associated with metastatic disease remains poor, with a 5-year survival rate of only 12% [2].
Clear cell is the most common subtype of RCC and accounts for approximately three-quarters of all cases [7]. These tumors are highly angiogenic and are frequently associated with von Hippel-Lindau (VHL) gene mutations. Inactivation of the VHL gene increases hypoxia-inducible factor activity, eventually leading to overexpression of vascular endothelial growth factor (VEGF) and platelet-derived growth factor [8,9]. Given the VHL protein’s role in the pathogenesis of tumor cells, metastatic disease treatment now focuses on targeted therapy based on the VEGF-tyrosine kinase inhibitor (TKI); the receptor TKIs sunitinib and sorafenib are currently first-line treatments for this condition [10–12].
While the administration of TKIs has prolonged the median survival time for patients with advanced ccRCC [13–15], almost all patients develop drug resistance after 6 to 15 months of treatment [16]. The molecular mechanisms underlying drug resistance observed in patients with advanced ccRCC remains unclear, and no reliable biomarkers of this condition have been developed [17]. Therefore, there is an urgent need to explore new prognostic models that might predict survival in patients with advanced ccRCC.
Our study identified several differentially expressed genes (DEGs) associated with sunitinib/sorafenib resistance from published datasets that were identified in the Gene Expression Omnibus (GEO) database. We then evaluated the prognosis with regard to each of the DEGs, using findings maintained in The Cancer Genome Atlas (TCGA) database, and constructed a 6-DEGs risk signature. This risk signature can effectively assess the prognoses of patients diagnosed with ccRCC and is particularly accurate for those with metastatic disease.
Material and Methods
IDENTIFICATION OF DEGS ASSOCIATED WITH DRUG RESISTANCE:
mRNA expression profiles in the GSE64052 file were downloaded from the GEO data repository (https://www.ncbi.nlm.nih.gov/geo/). The data file included 14 transplanted tumor samples that were resistant to TKIs (sunitinib or sorafenib) and 14 untreated control samples. The probe of the raw data file (Series Matrix.txt) was annotated with official gene symbols by the GPL570 platform file. The R package “limma” [18] was used for background correction and difference analysis (the cutoff criterion at a false discovery rate [FDR] <0.05 and the absolute value of the log of the fold change [|logFC|] >1). We identified 91 DEGs related to TKI resistance. Metascape was used for further functional enrichment analysis of DEGs [19].
PREPROCESSING OF THE TCGA DATA:
RNA-Seq data (HT-Seq-Count) and associated clinical data were downloaded from the TCGA database (https://portal.gdc.cancer.gov/). Official gene symbols were processed by the annotation file (Homo_sapiens.GRCh38.99.chr.gtf) within the Genecode database (https://www.gencodegenes.org/) [20]. The R package “edge R” algorithm [21] was used to perform background correction and normalization, and the R package “sva” was used to eliminate batch effects and other off-target variations associated with TCGA and GSE64052 data. The final analysis included 79 DEGs, identified in both TCGA and GEO expression matrices, and 463 patients with complete clinical follow-up information (≥90 days), along with complete clinicopathological information.
ESTABLISHMENT OF A PROGNOSTIC MODEL ASSOCIATED WITH TKI RESISTANCE:
The ccRCC patients were randomly divided into a training cohort (n=232) and a validation cohort (n=231) using the R package “caret”. Table 1 shows the clinical information associated with the training cohort, the validation cohort, and the entire cohort. Univariate Cox proportional hazards regression was analyzed with the R package “survival” to identify relationships between the TKI-resistance-associated DEGs with overall survival (OS); those with P<0.05 were selected as candidate variables. Subsequently, the least absolute shrinkage and selection operator (Lasso) Cox regression method analysis, which is an algorithm based on L1-penalized linear regression to prevent over-fitting of the model, was used to screen candidate variables; the coefficients of each DEG were calculated using the R package “glmnet” [22]. The best prognostic markers among the DEGs were established using these methods. The findings were confirmed in the validation cohort and the entire cohort. The risk score formula, based on 6 DEGs, was constructed as follows:
In this formula,
EVALUATION OF THE 6-DEGS PROGNOSIS MODEL:
For survival analysis, a Kaplan-Meier survival curve was plotted, and a Wilcoxon test was adopted to assess significant differences between high-risk and low-risk patient groups. Furthermore, the receiver operating characteristic (ROC) curve, the area under ROC (AUC), and survival-status scatter plot were drawn to evaluate the prognosis model’s accuracy in the training cohort, the validation cohort, and the entire cohort.
IDENTIFICATION OF INDEPENDENT PROGNOSTIC FACTORS ASSOCIATED WITH SURVIVAL:
Stratified analysis and Mann-Whitney tests were conducted to identify the discriminatory ability of risk scores concerning various clinical characteristics (i.e., age, living status, sex, grade, clinical stage, and TNM stage). Additionally, univariate and multivariate Cox regression analyses were performed using R package “survival” to assess the risk scores’ prognostic value and associated clinicopathological parameters. Multifactor ROC curves verified the parameters’ accuracy and specificity.
EVALUATION AND VERIFICATION OF NOMOGRAM:
The R package “rms” was used to construct a nomogram that included risk scores and clinicopathological features to predict the progress and prognosis of ccRCC patients at 1, 3, and 5 years. The Harrell consistency index (C-index) was used to test the accuracy of the nomogram; a calibration curve was constructed to test the consistency based on 1-, 3-, and 5-year survival predictions.
STATISTICS AND PLOTTING:
Statistics and plotting were performed using GraphPad Prism 8.2.1 (GraphPad Software Inc., San Diego, CA) and R environment (version 3.6.2,
Results
CONSTRUCTING A 6-DEGS RISK SCORE ASSOCIATED WITH TKI RESISTANCE:
To identify key genes related to TKI resistance, we downloaded raw data associated with 28 transplanted tumor samples from the GEO database and annotated 21 655 genes using the GPL570 platform document. We identified 91 DEGs in a comparison between gene expression levels in 14 transplanted tumor samples, reported as resistant to sorafenib/sunitinib, and those in 14 untreated samples; 29 DEGs were upregulated, and 62 DEGs were downregulated in the TKI-resistant samples. We identified these genes as associated with drug resistance (Supplementary Table 1). Figure 1A shows a volcano plot of these DEGs.
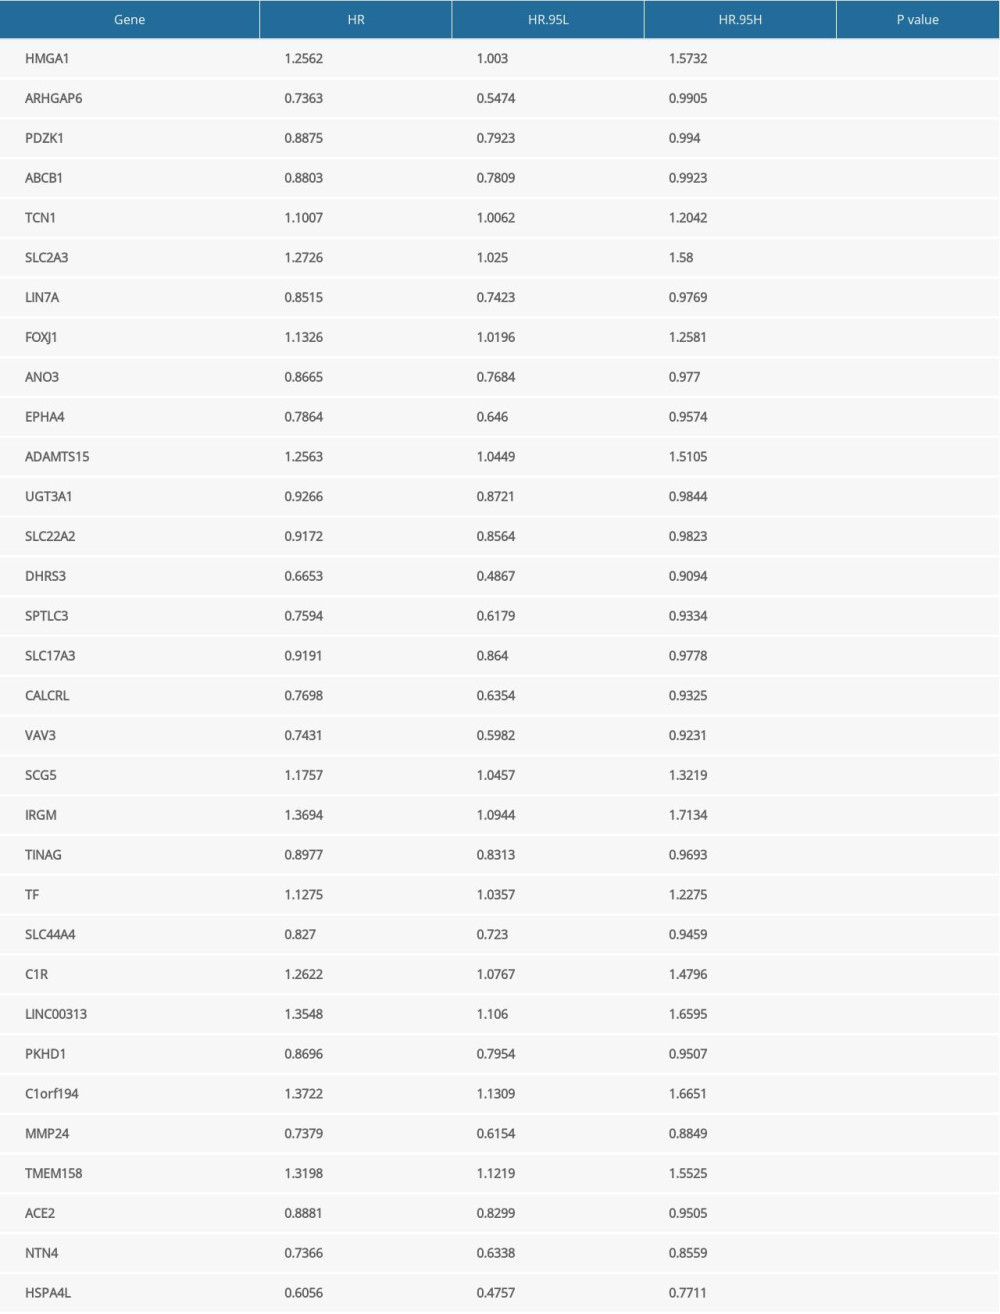
We next used Metascape to perform GO enrichment analysis on these DEGs. For molecular function, these genes mainly enriched in sodium-phosphate symporter activity, extracellular matrix binding, calcium ion binding, and virus receptor activity. Meanwhile, for biological processes, the DEGs were mainly enriched in drug transport, blood vessel development, hormone metabolic process, regulation of anion transport, and other biological processes (Supplementary Figure 1, Supplementary Table 2). To assess the DEGs’ prognostic value in the cases included in the TCGA database, ccRCC patients identified in this cohort were randomly and evenly divided into a training cohort (n=232) and a validation cohort (n=231). For the training cohort, we used Cox proportional hazards regression model to identify 32 genes that were significantly associated with OS (Supplementary Table 3, P<0.05). Furthermore, to establish a general indicator for patient prognosis, we performed Lasso regression analysis on these 32 genes, determined the best penalty parameters through 10 rounds of cross-validation, and finally obtained 6 DEGs significantly correlated with ccRCC (Figure 1B, 1C). Remarkably, the Spearman correlation analysis confirmed the low correlation among the 6 DEGs (Figure 1D), which underscored the effectiveness of this model.
Among these 6 genes, matrix metalloproteinase (MMP)24, angiotensin-converting enzyme (ACE)2, and solute carrier family 44 member 4 (SLC44A4) were associated with a positive prognosis (hazard ratio [HR] <1), while complement component C1R, chromosome 1 open reading frame (C1ORF)-194, and a disintegrin and metalloproteinase with thrombospondin motifs (ADAMTS)-15 were associated with a negative prognosis (HR >1) (Figure 1E). A weighted prognostic risk score formula was established, based on the regression coefficient and expression levels of each of the 6 genes; risk score= (−0.1841×MMP24) +(−0.1096×ACE2) +(−0.1030×SLC44A4) +(0.1490×C1R) +(0.2328×C1ORF194) +(0.2841×ADAMTS15). The ccRCC patients were then divided into a high-risk group (n=131) and a low-risk group (n=130) based on the median risk score of 0.945.
EVALUATION AND VERIFICATION OF PROGNOSTIC MODELS:
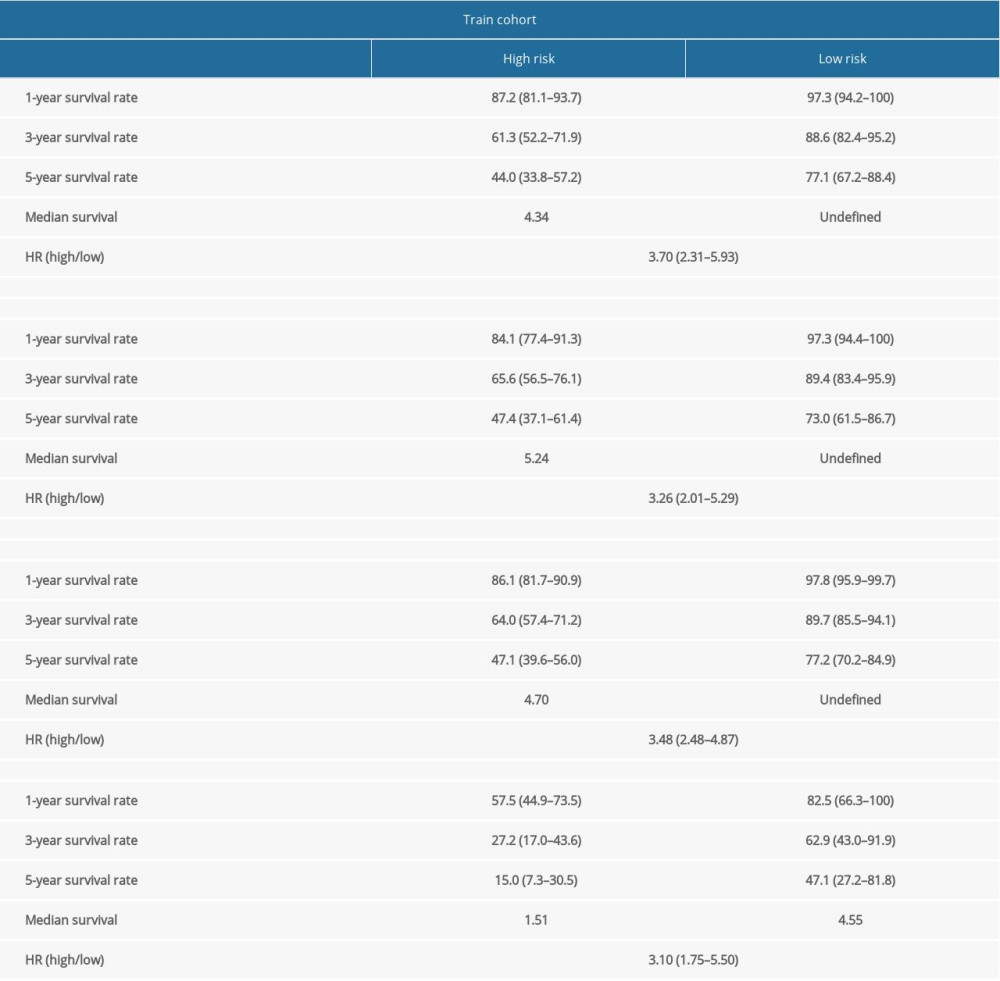
The Kaplan-Meier log-rank test was used to evaluate the risk score’s accuracy for predicting survival. The results revealed that patients identified as high-risk via this scoring system had lower OS than patients identified as low-risk (Figure 2A). Additionally, the time-dependent ROC curve showed that the AUCs associated with the 6-DEGs signatures at 1, 3, and 5 years were 0.785, 0.756, and 0.748, respectively (Figure 2B). We also constructed a survival-status scatter plot to assess the distribution of risk scores among patients who were alive and those who had died at the time of the study. The results demonstrated that, compared with patients who remained alive, the distribution of scores among those patients who were deceased was substantially more concentrated; these latter patients were mainly associated with high-risk scores (Figure 2C). Similar results were obtained when this analysis was applied to the validation cohort and the overall cohort (Figure 2D–2I). Table 2 shows the specific results from the survival analysis. In summary, the 6-DEGs-based risk score accurately predicted survival outcomes in patients diagnosed with ccRCC.
Since TKI resistance mainly occurs in patients with advanced metastatic disease, we analyzed the outcomes associated with the 6-DEGs risk score in patients with metastatic disease (M1) identified in the entire cohort (n=67). The results revealed that high-risk M1 patients had significantly lower OS and shorter median survival times than low-risk patients (Figure 2J). The 1-, 3-, and 5-year AUCs of M1 patients were 0.705, 0.749, and 0.796, respectively (Figure 2K). Notably, the survival-status scatter plots showed that M1 patients who were deceased were more concentrated within the high-risk score group (Figure 2L). Taken together, the risk model has superior sensitivity and specificity for ccRCC patients with metastatic disease.
STRATIFIED ANALYSIS OF RISK SCORES:
As a further confirmation of the clinical value of the 6-DEGs risk score model, we performed a stratified analysis with patients divided into different subgroups based on demographics and clinical characteristics, including age (<60 or ≥60), sex (female vs. male), survival (living vs. deceased), pathological grade (I+II vs. III+IV), clinical stage (I+II vs. III+IV), T stage (T1+T2 vs. T3+T4), N stage (N0 vs. N1), and M stage (M0 vs. M1). A Mann-Whitney test revealed that deceased patients, those with high pathological grades (III, IV), high clinical stages (III, IV), and high TNM diagnoses (T3, T4, M1, N1) were assigned higher risk scores. Interestingly, there were no significant differences concerning age or sex (Figure 3).
THE 6-DEGS RISK SCORE AS AN INDEPENDENT PROGNOSTIC FACTOR:
We performed univariate Cox regression and multivariate Cox analysis to evaluate the relationships between the 6-DEGs risk score and each demographic and clinicopathological parameter with OS. The results revealed that age, grade, clinical stage, and risk scores were associated with the prognoses of ccRCC patients (P<0.001; Figure 4A). Therefore, we included these 4 factors for further multivariate analysis and found that the covariates age, stage, and risk score were still significant in the multivariate Cox analysis (P<0.001; Figure 4B). Also, using a multifactor ROC curve for comparisons with age, grade, and stage, we found that the accuracy of the 6-DEGs risk for predicting OS was stable throughout the 1-, 3-, and 5-year periods (Figure 4C–4E).
Moreover, we used univariate Cox analysis to compare various factors (age, grade, T stage, and risk score) that can assess the prognosis of metastatic patients (M1). We found that only risk score was significant in a univariate analysis (P<0.001; Figure 5A). The 1-, 3-, and 5-year ROC curves also showed that the risk score had better accuracy than other variables (Figure 5B–5D). Hence, we conclude that the 6-DEGs signature can function as an independent predictor of prognosis in patients diagnosed with ccRCC, especially with metastatic ccRCC.
NOMOGRAM BASED ON 6-DEGS SIGNATURE FOR PREDICTING THE SURVIVAL TIME OF CCRCC PATIENTS:
Given the significance of the risk score and clinical-pathological parameters for predicting survival, we constructed a nomogram that combined the risk score and specific clinical parameters (age, grade, clinical stage) to predict the survival of patients with maximum efficacy (Figure 6A). The results revealed that the prognostic nomogram could accurately estimate the OS at 1, 3, and 5 years in patients diagnosed with ccRCC (Figure 6B–6D). The C-index of the nomogram was 0.784 (95% confidence interval, 0.745–0.823), a result that indicates that the nomogram can distinguish between patients with good versus poor prognoses.
Discussion
The mechanisms underlying TKI resistance may be related to the development of proangiogenic pathways, the tumor microenvironment, epithelial-mesenchymal transition (EMT), single-nucleotide polymorphisms, and/or other induced genetic alterations [17]. These extensive genetic changes are an important foundation affecting drug resistance. Hence, the identification of key biomarkers related to TKI resistance may help researchers to further clarify the mechanisms underlying ccRCC. Although widely used, the current TNM system and related clinicopathological features are ineffective for determining the prognoses of patients with advanced ccRCC [23].
In the current study, we first identified 32 genes associated with TKI resistance via analysis of differential expression in association with patient prognosis. We then introduced Lasso Cox regression analysis and selected 6 genes with good prognostic value and low correlation to establish a risk signature. Encouragingly, Kaplan-Meier survival, ROC, and univariate and multivariate Cox regression analyses verified the accuracy and specificity of the 6-DEGs signature and its applicability in the overall ccRCC cohort. In particular, survival analysis and univariate Cox analysis showed that the 6-DEGs risk score had good accuracy in predicting patients with metastatic disease. Finally, we developed a nomogram that integrated clinical prognostic variables and risk score to provide clinicians with a tool that can more effectively predict the survival of patients diagnosed with ccRCC, particularly those with advanced metastatic disease.
Among the 6 genes selected for the risk score,
Despite the excellent performance of the 6-DGEs signature as a prognostic indicator in cases of advanced ccRCC, it has several limitations and disadvantages. First, because we had no access to treatment data related to drug resistance, the genes were identified primarily based on existing experimental animal data. As such, additional clinical trials are needed to confirm the validity of the 6-DEGs signature in patients with clinical TKI resistance. Second, although the patient cohorts were grouped randomly to reduce bias, the data in the TCGA database were obtained primarily from white patients. It is necessary to verify our findings in patient cohorts featuring other races and ethnicities. Third, while 5 of the 6 genes contributed to the process of tumorigenesis in previous reports, the reported functions of MMP24, SLC44A4, and ADAMTS15 are inconsistent with our findings. Heterogeneity among tumors is commonplace, and the genes associated with different tumors can vary substantially [46,47]; as such, these results might be expected. However, we have not yet examined the functional mechanisms underlying the 6-DEGs signature genes, notably concerning their roles in promoting or inhibiting renal cancer. Additional experiments are needed to address questions associated with mechanisms underlying the roles of the 6 DEGs in mediating TKI resistance in association with ccRCC.
Conclusions
In summary, we used information available in the GEO and TCGA databases to establish a 6-DEGs signature associated with TKI resistance as a potential prognostic indicator for patients with ccRCC. Univariate analysis, multivariate analysis, and nomogram calibration curves supported the strong predictive value of the 6-DEGs-based risk score. As such, the mechanisms underlying differential expression of these 6 genes and their relationship to the pathogenesis of ccRCC should be explored in future studies.
Figures
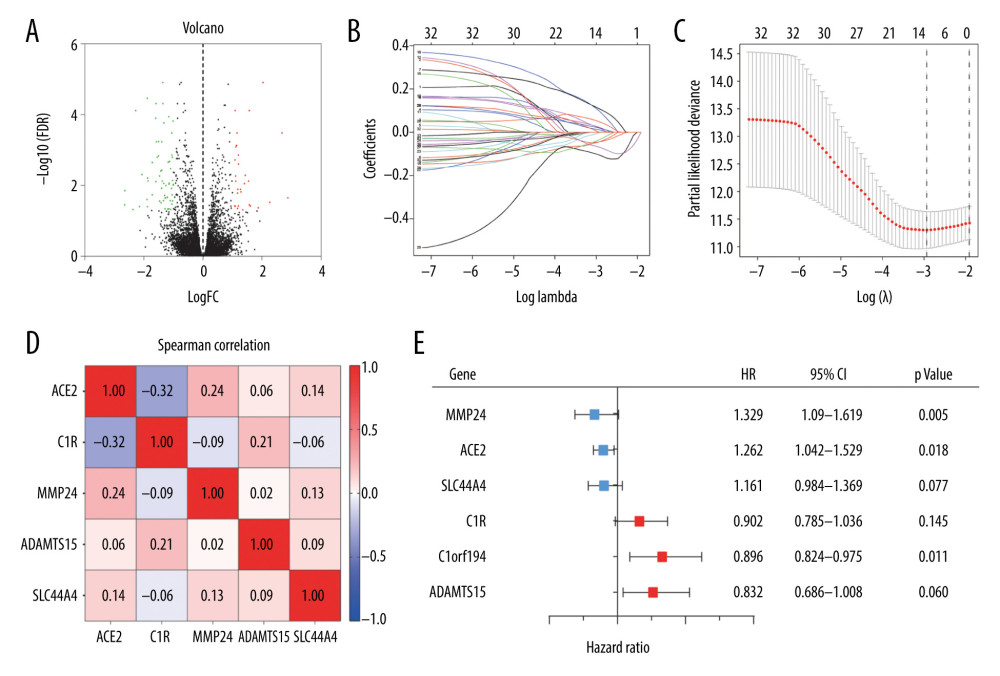 Figure 1. (A) Volcano plot of all differentially expressed genes (DEGs) identified among the 14 tyrosine kinase inhibitor (TKI)-resistant transplanted tumor samples and 14 untreated controls. (B) Lasso coefficient profiles of the fractions of 32 DEGs. (C) Tenfold cross-validation for tuning parameter selection in the Lasso model. (D) Correlations between the expression levels of 6 specific genes associated with clear cell renal cell carcinoma (ccRCC) were determined with the Spearman correlation coefficient. (E) Six DEGs that were highly related to the survival of ccRCC patients were identified by univariate Cox regression analysis.
 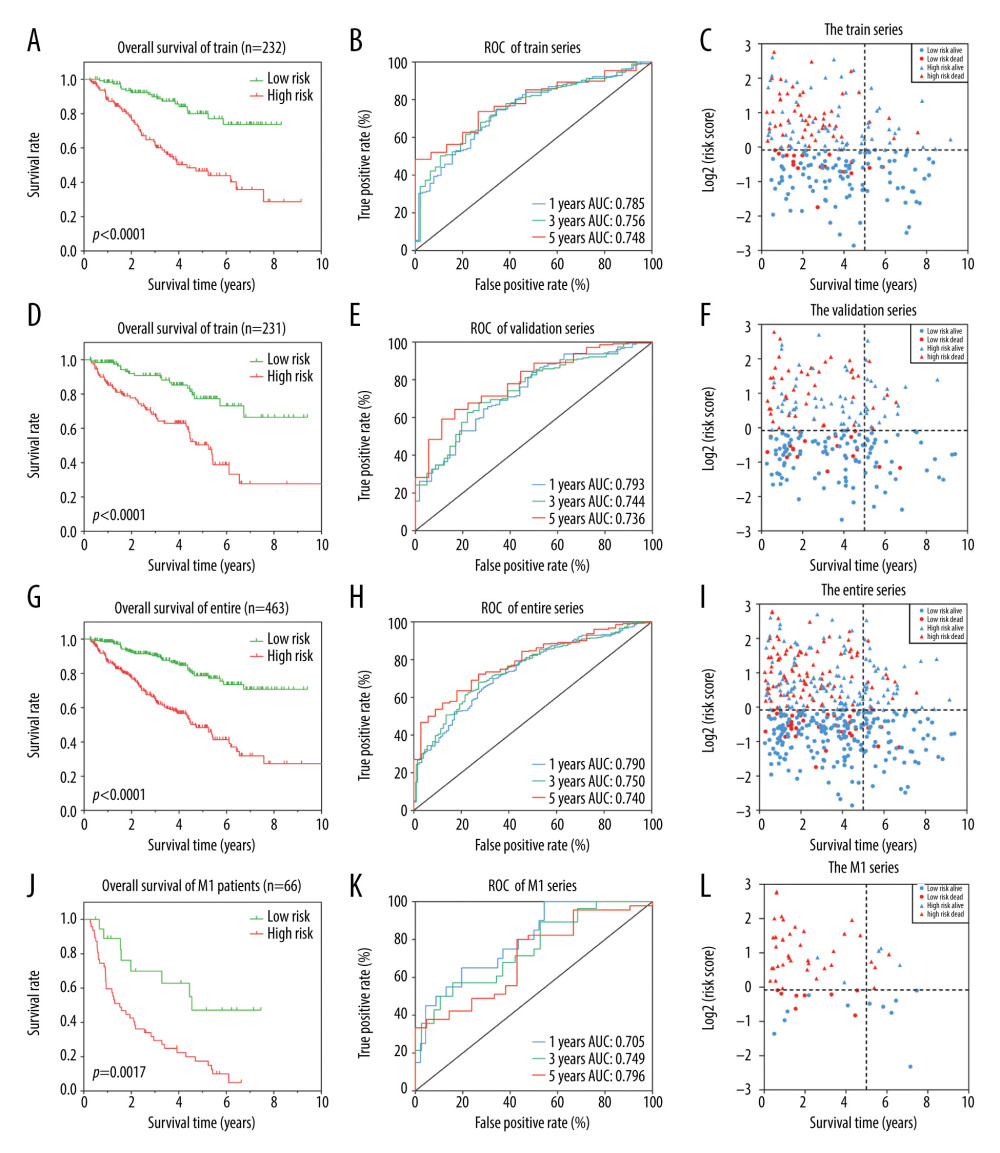 Figure 2. Identification of a 6 differentially expressed genes (6-DEGs) signature for prognoses of patients with clear cell renal cell carcinoma (ccRCC). Kaplan-Meier (KM) survival analysis was performed to evaluate the association between overall survival (OS) and 6-DEGs signature in (A) the training series, (D) the validation series, (G) the entire cohort, and (J) patients with metastatic disease (M1 stage patients). Receiver operating characteristic (ROC) analysis of the sensitivity and specificity of the 6-DEGs signature in (B) the training series, (E) validation series, (H) the full patient cohort, and (K) M1 stage patients. Scatter plots of survival status concerning the 6-DEGs risk score in (C) the training series, (F) validation series, (I) the full patient cohort, and (L) M1 stage patients.
 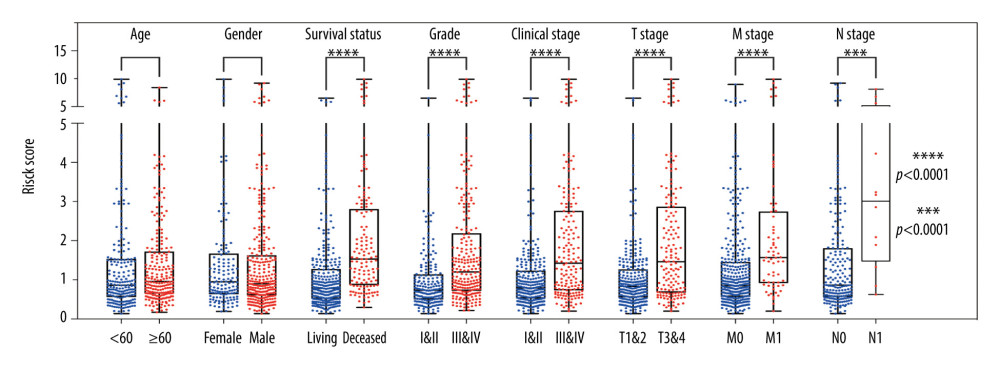 Figure 3. Stratified analysis of 6 differentially expressed genes (6-DEGs) risk scores associated with various clinicopathological parameters in patients with clear cell renal cell carcinoma (ccRCC). Patients were divided into subgroups according to age (<60 vs. ≥60), sex (female vs. male), tumor grade (I+II vs. III+IV), current survival status (alive vs. dead), clinical stage (I+II vs. III+IV), tumor stage (T1+T2 vs. T3+T4), as well as the status of distant metastasis (M0 vs. M1) and lymph node metastasis stage (N0 vs. N1); *** P<0.001; **** P<0.0001.
 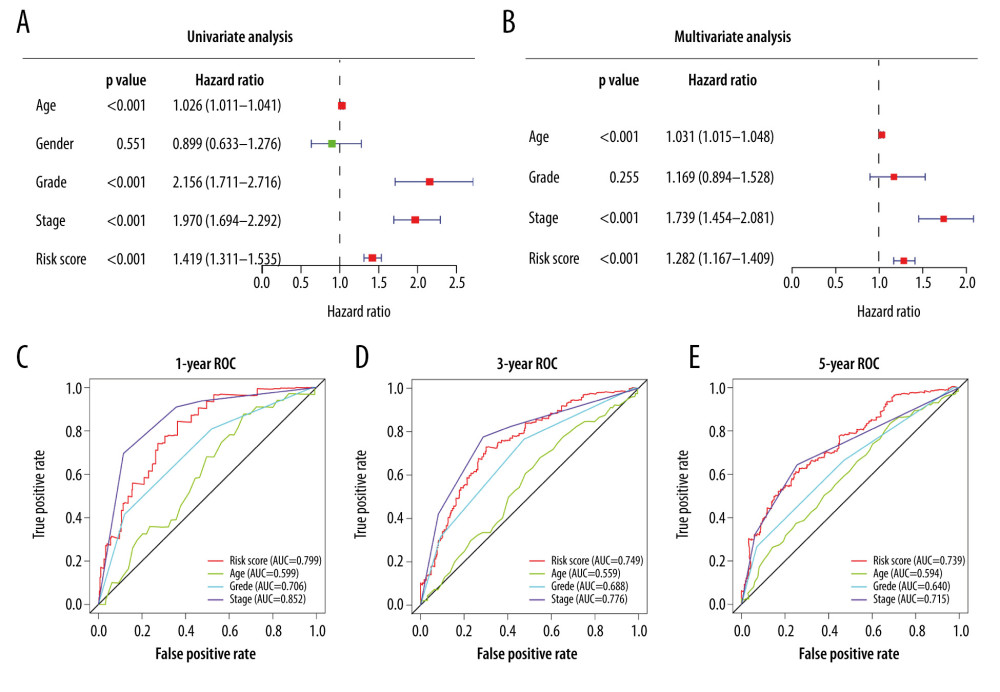 Figure 4. (A) Univariate Cox analysis and (B) multivariate Cox analysis of risk score and clinical characteristics. (C–E) Area under the receiver operating characteristic (ROC) curve of multiple factors for 1-, 3-, and 5-year overall survival (OS) prediction.
 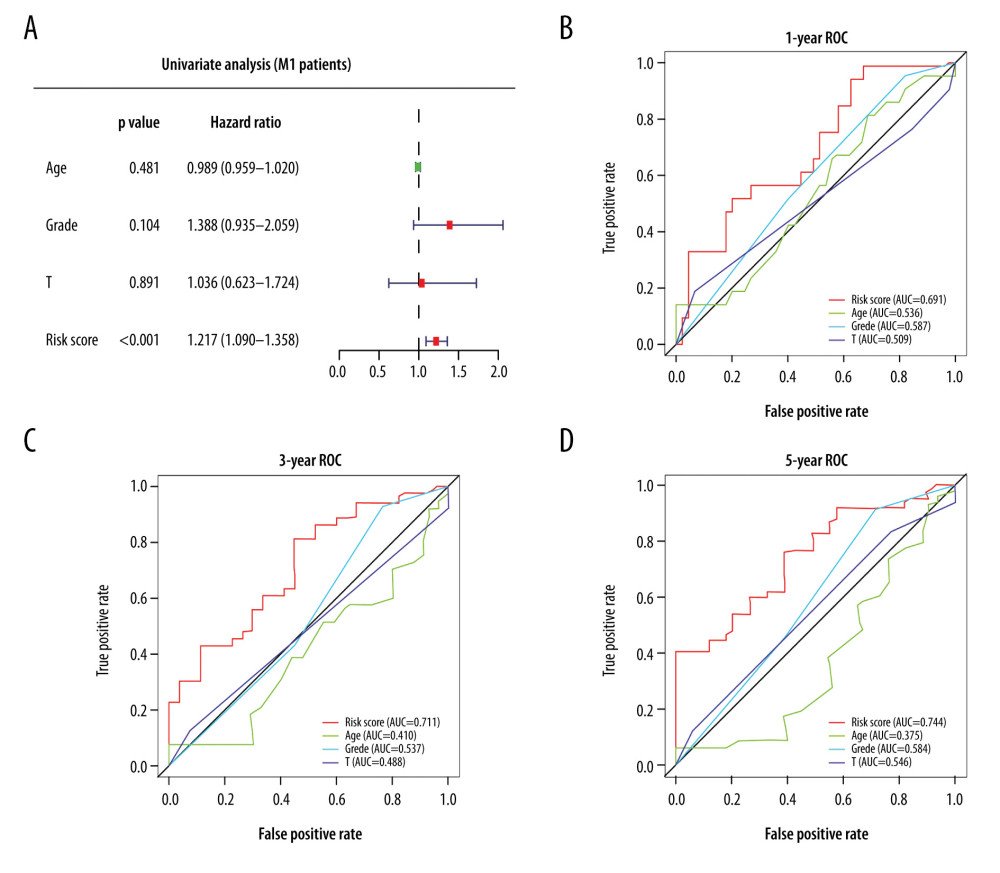 Figure 5. (A) Univariate Cox analysis of risk score for patients with metastatic disease (M1 patients). (B–D) Area under the receiver operating characteristic (ROC) curve of multiple factors at 1-, 3-, and 5-year OS prediction.
 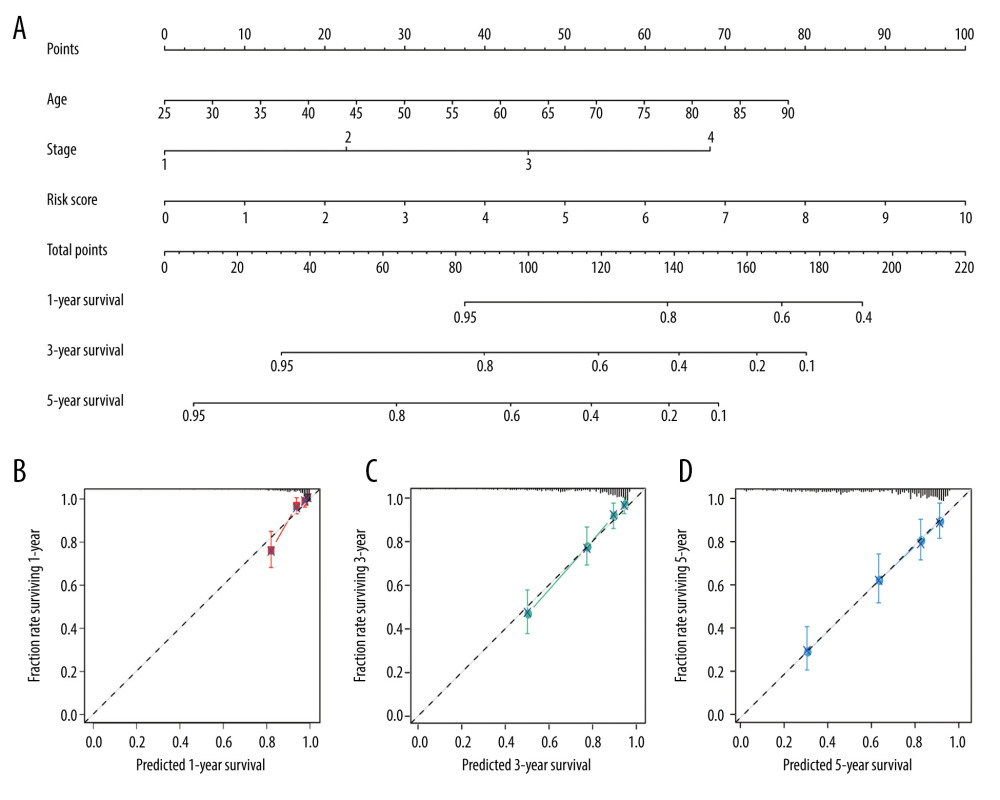 Figure 6. Nomogram plot and associated calibration curve containing risk score, age, and stage developed for patients with clear cell renal cell carcinoma (ccRCC). (A) Nomograms for predicting 1-, 3-, and 5-year survival of patients with ccRCC. (B–D) Calibration curves for the nomograms that document agreement between predicted and observed 1-, 3-, and 5-year outcomes. The dotted line represents 100% accurate prediction; the red, green, and blue lines represent real-life performance.
 Tables
Table 1. Clinical characteristics of patients with clear cell renal cell carcinoma in entire cohort, training cohort, and validation cohort.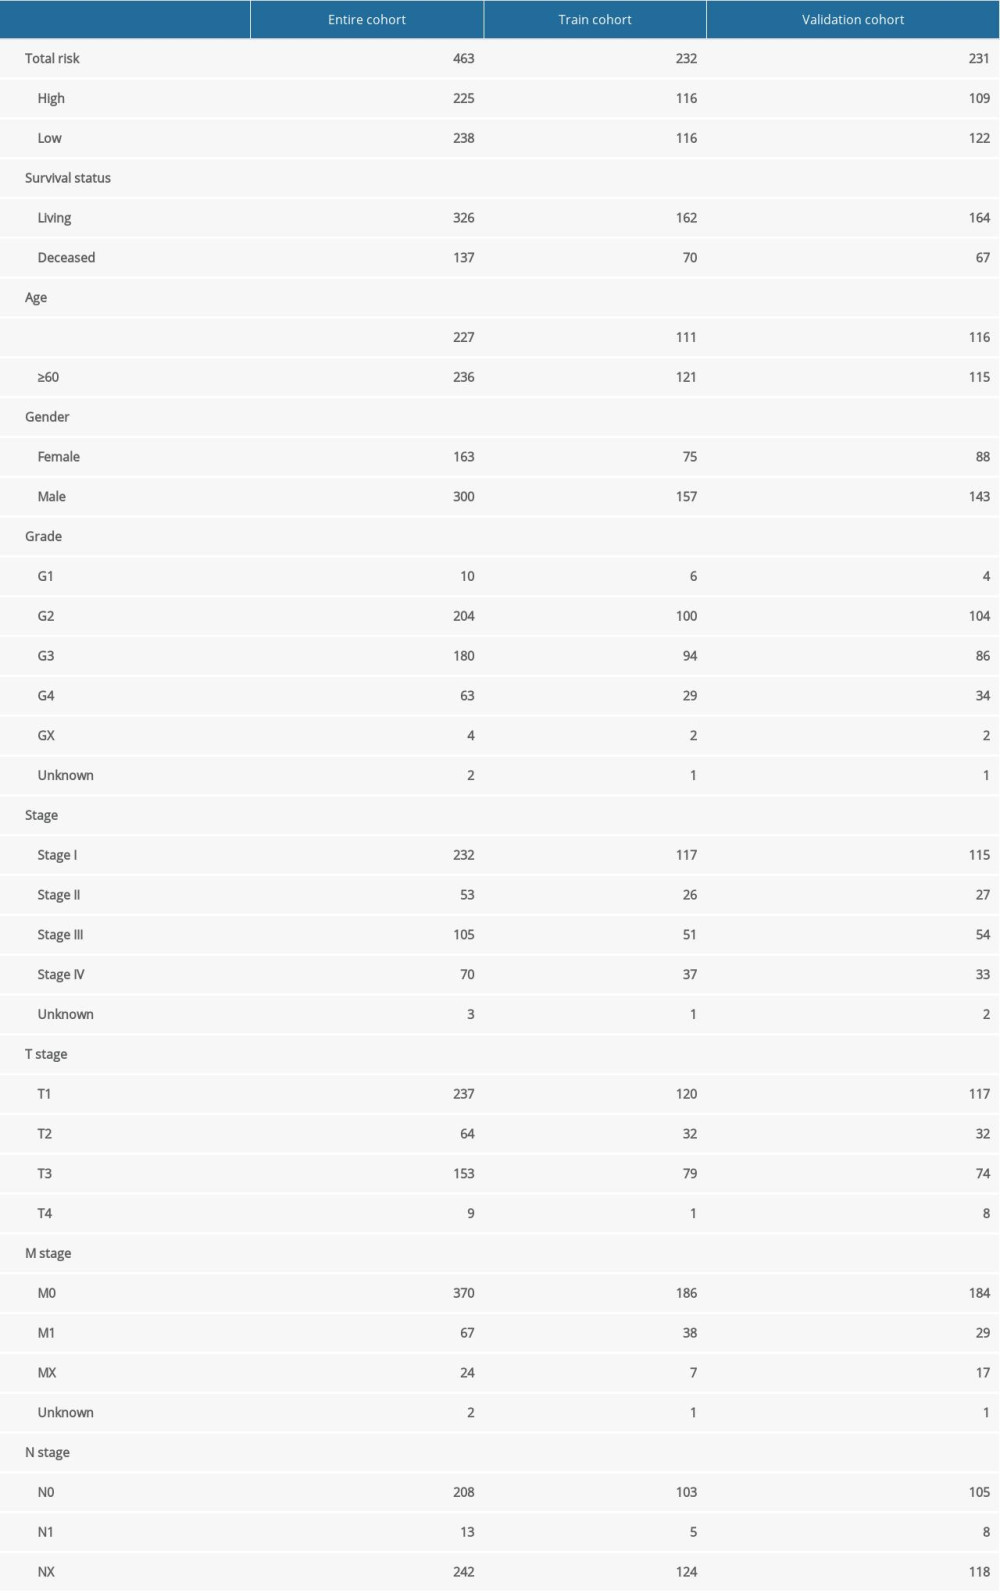 Table 2. Survival rate and median survival time of patients with clear cell renal cell carcinoma in training cohort, validation cohort, entire cohort, and patients with metastatic disease (M1).
 Supplementary Table 1. Differentially expressed genes related to tyrosine kinase inhibitor (TKI) resistance.
 Supplementary Table 3. Differentially expressed genes associated with prognosis of clear cell renal cell carcinoma.
References
1. Siegel RL, Miller KD, Jemal A, Cancer statistics, 2019: Cancer J Clin, 2019; 69(1); 7-34
2. Howlader N, Noone AM, Krapcho M: SEER Cancer Statistics Review. 1975–2016 April, 2019, Bethesda (MD), National Cancer Institute https://seer.cancer.gov/csr/1975_2016/
3. Gill IS, Aron M, Gervais DA, Jewett MAS, Clinical practice. Small renal mass: N Engl J Med, 2010; 362(7); 624-34
4. Motzer RJ, Bander NH, Nanus DM, Renal-cell carcinoma: N Engl J Med, 1996; 335(12); 865-75
5. Dabestani S, Thorstenson A, Lindblad P, Renal cell carcinoma recurrences and metastases in primary non-metastatic patients: A population-based study: World J Urol, 2016; 34(8); 1081-86
6. Sandock DS, Seftel AD, Resnick MI, A new protocol for the followup of renal cell carcinoma based on pathological stage: J Urol, 1995; 154(1); 28-31
7. Shuch B, Amin A, Armstrong AJ, Understanding pathologic variants of renal cell carcinoma: Distilling therapeutic opportunities from biologic complexity: Eur Urol, 2015; 67(1); 85-97
8. Clark PE, The role of VHL in clear-cell renal cell carcinoma and its relation to targeted therapy: Kidney Int, 2009; 76(9); 939-45
9. Maxwell PH, Wiesener MS, Chang GW, The tumour suppressor protein VHL targets hypoxia-inducible factors for oxygen-dependent proteolysis: Nature, 1999; 399(6733); 271-75
10. Choueiri TK, Motzer RJ, Systemic therapy for metastatic renal-cell carcinoma: N Engl J Med, 2017; 376(4); 354-66
11. Garcia JA, Rini BI, Recent progress in the management of advanced renal cell carcinoma: Cancer J Clin, 2007; 57(2); 112-25
12. Pantuck AJ, Zisman A, Belldegrun AS, The changing natural history of renal cell carcinoma: J Urol, 2001; 166(5); 1611-23
13. Bracarda S, Iacovelli R, Boni L, Sunitinib administered on 2/1 schedule in patients with metastatic renal cell carcinoma: The RAINBOW analysis: Ann Oncol, 2016; 27(2); 366
14. Escudier B, Eisen T, Stadler WM, Sorafenib in advanced clear-cell renal-cell carcinoma: N Engl J Med, 2007; 356(2); 125-34
15. Verhagen PCMS, Re: Sunitinib versus interferon alfa in metastatic renal-cell carcinoma: Eur Urol, 2007; 51(5); 1444
16. Rini BI, Atkins MB, Resistance to targeted therapy in renal-cell carcinoma: Lancet Oncol, 2009; 10(10); 992-1000
17. Duran I, Lambea J, Maroto P, Resistance to targeted therapies in renal cancer: The importance of changing the mechanism of action: Target Oncol, 2017; 12(1); 19-35
18. Ritchie ME, Phipson B, Wu D, limma powers differential expression analyses for RNA-sequencing and microarray studies: Nucleic Acids Res, 2015; 43(7); e47
19. Zhou Y, Zhou B, Pache L, Metascape provides a biologist-oriented resource for the analysis of systems-level datasets: Nat Commun, 2019; 10(1); 1523
20. Frankish A, Diekhans M, Ferreira A-M, GENCODE reference annotation for the human and mouse genomes: Nucleic Acids Res, 2019; 47(D1); D766-73
21. Robinson MD, McCarthy DJ, Smyth GK, edgeR: A Bioconductor package for differential expression analysis of digital gene expression data: Bioinformatics, 2010; 26(1); 139-40
22. Friedman J, Hastie T, Tibshirani R, Regularization paths for generalized linear models via coordinate descent: J Stat Softw, 2010; 33(1); 1-22
23. Moch H, Artibani W, Delahunt B, Reassessing the current UICC/AJCC TNM staging for renal cell carcinoma: Eur Urol, 2009; 56(4); 636-43
24. Donoghue M, Hsieh F, Baronas E, A novel angiotensin-converting enzyme-related carboxypeptidase (ACE2) converts angiotensin I to angiotensin 1–9: Circ Res, 2000; 87(5); E1-E9
25. Qian Y-R, Guo Y, Wan H-Y, Angiotensin-converting enzyme 2 attenuates the metastasis of non-small cell lung cancer through inhibition of epithelial-mesenchymal transition: Oncol Rep, 2013; 29(6); 2408-14
26. Zhang Q, Lu S, Li T, ACE2 inhibits breast cancer angiogenesis via suppressing the VEGFa/VEGFR2/ERK pathway: J Exp Clin Cancer Res, 2019; 38(1); 173
27. Vickers C, Hales P, Kaushik V, Hydrolysis of biological peptides by human angiotensin-converting enzyme-related carboxypeptidase: J Biol Chem, 2002; 277(17); 14838-43
28. Soto-Pantoja DR, Menon J, Gallagher PE, Tallant EA, Angiotensin-(1–7) inhibits tumor angiogenesis in human lung cancer xenografts with a reduction in vascular endothelial growth factor: Mol Cancer Ther, 2009; 8(6); 1676-83
29. Krishnan B, Torti FM, Gallagher PE, Tallant EA, Angiotensin-(1–7) reduces proliferation and angiogenesis of human prostate cancer xenografts with a decrease in angiogenic factors and an increase in sFlt-1: Prostate, 2013; 73(1); 60-70
30. Ni L, Feng Y, Wan H, Angiotensin-(1–7) inhibits the migration and invasion of A549 human lung adenocarcinoma cells through inactivation of the PI3K/Akt and MAPK signaling pathways: Oncol Rep, 2012; 27(3); 783-90
31. Menon J, Soto-Pantoja DR, Callahan MF, Angiotensin-(1–7) inhibits growth of human lung adenocarcinoma xenografts in nude mice through a reduction in cyclooxygenase-2: Cancer Res, 2007; 67(6); 2809-15
32. Nagase H, Visse R, Murphy G, Structure and function of matrix metalloproteinases and TIMPs: Cardiovasc Res, 2006; 69(3); 562-73
33. Hua H, Li M, Luo T, Matrix metalloproteinases in tumorigenesis: An evolving paradigm: Cell Mol Life Sci, 2011; 68(23); 3853-68
34. Wang X, Khalil RA, Matrix metalloproteinases, vascular remodeling, and vascular disease: Adv Pharmacol, 2018; 81; 241-330
35. López-Otín C, Palavalli LH, Samuels Y, Protective roles of matrix metalloproteinases: From mouse models to human cancer: Cell Cycle, 2009; 8(22); 3657-62
36. Sugimoto W, Itoh K, Hirata H, MMP24 as a target of YAP is a potential prognostic factor in cancer patients: Bioengineering (Basel), 2020; 7(1); 18
37. Mattie M, Raitano A, Morrison K, The discovery and preclinical development of ASG-5ME, an antibody-drug conjugate targeting SLC44A4-positive epithelial tumors including pancreatic and prostate cancer: Mol Cancer Ther, 2016; 15(11); 2679-87
38. Song P, Rekow SS, Singleton C-A, Choline transporter-like protein 4 (CTL4) links to non-neuronal acetylcholine synthesis: J Neurochem, 2013; 126(4); 451-61
39. Nabokina SM, Inoue K, Subramanian VS, Molecular identification and functional characterization of the human colonic thiamine pyrophosphate transporter: J Biol Chem, 2014; 289(7); 4405-16
40. Inazu M, Choline transporter-like proteins CTLs/SLC44 family as a novel molecular target for cancer therapy: Biopharm Drug Dispos, 2014; 35(8); 431-49
41. Arlaud GJ, Gaboriaud C, Ling WL, Thielens NM, Structure of the C1 complex of complement: Proc Natl Acad Sci USA, 2017; 114(29); E5766-67
42. Afshar-Kharghan V, The role of the complement system in cancer: J Clin Invest, 2017; 127(3); 780-89
43. Riihilä P, Viiklepp K, Nissinen L, Tumour-cell-derived complement components C1r and C1s promote growth of cutaneous squamous cell carcinoma: Br J Dermatol, 2020; 182(3); 658-70
44. Sun S-C, Ma D, Li M-Y, Mutations in C1orf194, encoding a calcium regulator, cause dominant Charcot-Marie-Tooth disease: Brain, 2019; 142(8); 2215-29
45. Kelwick R, Desanlis I, Wheeler GN, Edwards DR, The ADAMTS (A Disintegrin and Metalloproteinase with Thrombospondin motifs) family: Genome Biol, 2015; 16; 113
46. Dagogo-Jack I, Shaw AT, Tumour heterogeneity and resistance to cancer therapies: Nat Rev Clin Oncol, 2018; 15(2); 81-94
47. Burrell RA, McGranahan N, Bartek J, Swanton C, The causes and consequences of genetic heterogeneity in cancer evolution: Nature, 2013; 501(7467); 338-45
Figures
 Figure 1. (A) Volcano plot of all differentially expressed genes (DEGs) identified among the 14 tyrosine kinase inhibitor (TKI)-resistant transplanted tumor samples and 14 untreated controls. (B) Lasso coefficient profiles of the fractions of 32 DEGs. (C) Tenfold cross-validation for tuning parameter selection in the Lasso model. (D) Correlations between the expression levels of 6 specific genes associated with clear cell renal cell carcinoma (ccRCC) were determined with the Spearman correlation coefficient. (E) Six DEGs that were highly related to the survival of ccRCC patients were identified by univariate Cox regression analysis.
 Figure 2. Identification of a 6 differentially expressed genes (6-DEGs) signature for prognoses of patients with clear cell renal cell carcinoma (ccRCC). Kaplan-Meier (KM) survival analysis was performed to evaluate the association between overall survival (OS) and 6-DEGs signature in (A) the training series, (D) the validation series, (G) the entire cohort, and (J) patients with metastatic disease (M1 stage patients). Receiver operating characteristic (ROC) analysis of the sensitivity and specificity of the 6-DEGs signature in (B) the training series, (E) validation series, (H) the full patient cohort, and (K) M1 stage patients. Scatter plots of survival status concerning the 6-DEGs risk score in (C) the training series, (F) validation series, (I) the full patient cohort, and (L) M1 stage patients.
 Figure 3. Stratified analysis of 6 differentially expressed genes (6-DEGs) risk scores associated with various clinicopathological parameters in patients with clear cell renal cell carcinoma (ccRCC). Patients were divided into subgroups according to age (<60 vs. ≥60), sex (female vs. male), tumor grade (I+II vs. III+IV), current survival status (alive vs. dead), clinical stage (I+II vs. III+IV), tumor stage (T1+T2 vs. T3+T4), as well as the status of distant metastasis (M0 vs. M1) and lymph node metastasis stage (N0 vs. N1); *** P<0.001; **** P<0.0001.
 Figure 4. (A) Univariate Cox analysis and (B) multivariate Cox analysis of risk score and clinical characteristics. (C–E) Area under the receiver operating characteristic (ROC) curve of multiple factors for 1-, 3-, and 5-year overall survival (OS) prediction.
 Figure 5. (A) Univariate Cox analysis of risk score for patients with metastatic disease (M1 patients). (B–D) Area under the receiver operating characteristic (ROC) curve of multiple factors at 1-, 3-, and 5-year OS prediction.
 Figure 6. Nomogram plot and associated calibration curve containing risk score, age, and stage developed for patients with clear cell renal cell carcinoma (ccRCC). (A) Nomograms for predicting 1-, 3-, and 5-year survival of patients with ccRCC. (B–D) Calibration curves for the nomograms that document agreement between predicted and observed 1-, 3-, and 5-year outcomes. The dotted line represents 100% accurate prediction; the red, green, and blue lines represent real-life performance.
 Tables
 Table 1. Clinical characteristics of patients with clear cell renal cell carcinoma in entire cohort, training cohort, and validation cohort.
 Table 2. Survival rate and median survival time of patients with clear cell renal cell carcinoma in training cohort, validation cohort, entire cohort, and patients with metastatic disease (M1).
 Table 1. Clinical characteristics of patients with clear cell renal cell carcinoma in entire cohort, training cohort, and validation cohort.
 Table 2. Survival rate and median survival time of patients with clear cell renal cell carcinoma in training cohort, validation cohort, entire cohort, and patients with metastatic disease (M1).
 Supplementary Table 1. Differentially expressed genes related to tyrosine kinase inhibitor (TKI) resistance.
 Supplementary Table 3. Differentially expressed genes associated with prognosis of clear cell renal cell carcinoma.
 In Press
07 Mar 2024 : Clinical Research
Knowledge of and Attitudes Toward Clinical Trials: A Questionnaire-Based Study of 179 Male Third- and Fourt...Med Sci Monit In Press; DOI: 10.12659/MSM.943468
08 Mar 2024 : Animal Research
Modification of Experimental Model of Necrotizing Enterocolitis (NEC) in Rat Pups by Single Exposure to Hyp...Med Sci Monit In Press; DOI: 10.12659/MSM.943443
18 Apr 2024 : Clinical Research
Comparative Analysis of Open and Closed Sphincterotomy for the Treatment of Chronic Anal Fissure: Safety an...Med Sci Monit In Press; DOI: 10.12659/MSM.944127
08 Mar 2024 : Laboratory Research
Evaluation of Retentive Strength of 50 Endodontically-Treated Single-Rooted Mandibular Second Premolars Res...Med Sci Monit In Press; DOI: 10.12659/MSM.944110
Most Viewed Current Articles
17 Jan 2024 : Review article
Vaccination Guidelines for Pregnant Women: Addressing COVID-19 and the Omicron VariantDOI :10.12659/MSM.942799
Med Sci Monit 2024; 30:e942799
14 Dec 2022 : Clinical Research
Prevalence and Variability of Allergen-Specific Immunoglobulin E in Patients with Elevated Tryptase LevelsDOI :10.12659/MSM.937990
Med Sci Monit 2022; 28:e937990
16 May 2023 : Clinical Research
Electrophysiological Testing for an Auditory Processing Disorder and Reading Performance in 54 School Stude...DOI :10.12659/MSM.940387
Med Sci Monit 2023; 29:e940387
01 Jan 2022 : Editorial
Editorial: Current Status of Oral Antiviral Drug Treatments for SARS-CoV-2 Infection in Non-Hospitalized Pa...DOI :10.12659/MSM.935952
Med Sci Monit 2022; 28:e935952


