23 April 2022: Clinical Research
Combining Magnetic Resonance Diffusion-Weighted Imaging with Prostate-Specific Antigen to Differentiate Between Malignant and Benign Prostate Lesions
Liying Han1CEF, Guanyong He1CDE, Yingjie Mei2CD, Qing Yu3BF, Minning Zhao3BF, Fu Luo4B, Guanxun Cheng1AEG*, Wen Liang3AEDOI: 10.12659/MSM.935307
Med Sci Monit 2022; 28:e935307


Abstract
BACKGROUND: We aimed to develop a combined model of quantitative parameters derived from 3 different magnetic resonance imaging (MRI) diffusion models and laboratory data related to prostate-specific antigen (PSA) for differentiating between prostate cancer (PCa) and benign lesions.
MATERIAL AND METHODS: Eighty-four patients pathologically confirmed as having PCa or benign disease were enrolled. All patients underwent multiparametric MRI before biopsy, added intravoxel incoherent motion (IVIM) imaging, and diffusion kurtosis imaging (DKI). The following data were collected: quantitative parameters of diffusion-weighted imaging (DWI), IVIM, and DKI, preoperative total PSA, free/total PSA ratio, and PSA density (PSAD) values. A combined logistic regression model was established by above MRI quantitative parameters and PSA data to diagnose PCa. The Prostate Imaging Reporting and Data System version 2 (PI-RADS v2) was used to assess the lesions for comparison.
RESULTS: Thirty-two patients had PCa and 52 patients had benign lesions. In multivariate logistic regression analysis, only apparent diffusion coefficient (ADC) and PSAD were significant variables (P<0.05) and were thus retained in the model. The area under curve value of the combined model (0.911) was higher than that of ADC, PSAD, and PI-RADS v2 (0.887, 0.861, and 0.859, respectively) in univariate analysis, but without any statistically significant differences. The combined model generated greater clinical benefit than the independent application of ADC, PSAD, and PI-RADS v2.
CONCLUSIONS: ADC and PSAD were the 2 most important metrics for distinguishing PCa from benign lesions. The combined model of ADC and PSAD demonstrated satisfactory discrimination and improved clinical net benefit.
Keywords: Diffusion Magnetic Resonance Imaging, Logistic Models, Prostate Cancer, Familial, Prostate-Specific Antigen, Humans, Magnetic Resonance Imaging, Magnetic Resonance Spectroscopy, Male, Prostate, Prostatic Neoplasms
Background
Prostate cancer (PCa) is the second most common cancer and the fifth cause of cancer-related deaths among men worldwide [1]. In the United States, other than skin cancer, PCa is the most common cancer in men and the second leading cause of cancer death [2]. The incidence of PCa in the United States was 106.4 per 100 000 people on average annually from 2014 to 2018 [3]. To acquire more treatment and survival opportunities, the early detection and diagnosis of PCa are of great importance.
Prostate-specific antigen (PSA) serum testing is the most widespread method for screening PCa. The normal range of total PSA (tPSA) is less than 4 ng/mL. However, only about 25% of men who have a biopsy due to an elevated PSA level truly have cancer [4]. The sensitivity and specificity of the PSA remain to be improved [5]. As PSA derivatives, free/total PSA ratio (f/tPSA) and PSA density (PASD) have been confirmed to aid tPSA to increase the accuracy of PCa recognition and avoid unnecessary biopsies, especially in cases with low tPSA levels [5–7].
Multiparametric magnetic resonance imaging (Mp-MRI) has become an increasingly important prebiopsy examination for PCa detection and assessment. The Prostate Imaging Reporting and Data System version 2 (PI-RADS v2) was published as a guideline to assess prostate lesions visually [8]. Diffusion-weighted imaging (DWI) reflects the Gaussian diffusion motion of water in a living body, which is described with a monoexponential decay model [9]. The quantitative parameter of DWI, namely the apparent diffusion coefficient (ADC) value, can be used to evaluate the nature of a lesion [9]. Intravoxel incoherent motion (IVIM) imaging can distinguish pure extravascular molecular diffusion from the microcirculation perfusion of blood within the capillaries through fitting with a biexponential model [10]. Three parameters are derived from IVIM: pure diffusion coefficient D, pseudo/perfusion-related diffusion coefficient D*, and perfusion fraction f. Diffusion kurtosis imaging (DKI) is a non-Gaussian diffusion model that is used to characterize the complex microcosmic motion of water molecules [11]. Kurtosis denotes the deviation of water movement from normal Gaussian diffusion to non-Gaussian diffusion and is expressed with the parameter Kapp. Dapp is another parameter of DKI, reflecting the corrected diffusion coefficient of non-Gaussian diffusion. Previous studies have shown the above quantitative parameters of IVIM and DKI have the potential capability to detect and differentiate PCa [12,13].
The utility of a single metric for the diagnosis and differentiation of PCa is limited and inadequate. Some studies [14,15] have integrated MRI indexes with clinical data to predict PCa. In this study, we developed a logistic regression (LR) model combining the quantitative parameters of DWI, IVIM, and DKI with the data of tPSA, f/tPSA, and PSAD to discriminate PCa from benign lesions and compared its results with the visual assessment accomplished by PI-RADS v2.
Material and Methods
PATIENTS:
The Scientific Research Ethics Committee of Peking University Shenzhen Hospital approved our study, and informed consent was waived for the retrospective research (ethics approval no: Ethics Review Committee [Scientific Research] of Peking University Shenzhen Hospital [2021] no. [082]).
The MRI imaging and laboratory and pathological data of patients with suspected prostate disease from October 2017 to December 2018 were retrospectively collected in the Zhujiang Hospital of Southern Medical University and the Peking University Shenzhen Hospital. Inclusion criteria were as follows: (1) Serum testing was performed before biopsy and treatment. The PSA level was above 4 ng/mL. Direct serum testing data included tPSA and free PSA. (2) Histopathological results, including PCa diagnosis and benign prostatic hyperplasia (BPH) (accompanied by prostatitis and prostatic intraepithelial neoplasia or not), were obtained through prostate biopsy or surgery within a month after the MRI examination. (3) The MRI scan integrated morphological protocols and dynamic contrast enhancement (DCE), DWI, IVIM, and DKI sequences. The exclusion criteria were as follows: (1) The patient underwent biopsy or enucleation of the prostate within a month before the MRI scan. (2) The patient was confirmed to have PCa and accepted treatment. (3) The MRI image quality was inadequate for demonstrating the lesion and obtaining measurements. Finally, 84 patients were considered eligible.
MRI EXAMINATION:
MRI scans were acquired by utilizing a 3.0T MR system (Ingenia, Philips Medical Systems, Best, the Netherlands) and 32-channel body-phased array coil. Morphological MRI involved T1-weighted sequence and T2-weighted images. DWI scanning was performed with 2 b values (0 and 1500 s/mm2). The IVIM protocol involved 9 b values (0, 30, 70, 120, 200, 400, 600, and 1000 s/mm2). The DKI sequence was conducted with 4 b values (0, 500, 1000, and 1500 s/mm2). Contrast enhancement started with 2 T1 mapping sequences before 90-phase DCE scanning. In the fifth phase, the patients were injected with meglumine gadolinate at a rate of 2.0 mL/s and a dose of 0.2 mmol/kg. The primary MRI protocol parameters applied in this study are listed in Table 1.
PATHOLOGY:
All enrolled patients underwent a transperineal 15-core biopsy under transrectal ultrasound guidance within 2 weeks after Mp-MRI scanning. On the basis of the 12-core systematic biopsy, the 15-core biopsy was supplemented with 3 cores at the base, midgland, and apex along the prostate’s median line by urologist surgeons with 5 to 10 years of experience. A total of 58 (69%) patients were treated with radical prostatectomy or the transurethral resection of the prostate within a month after the MRI examination. Then, all the specimens were sent to pathologists with 10 years of experience for analysis. The pathological grade of PCa was assessed in accordance with the 2005 modified Gleason grading system.
IMAGING PROCESSING AND QUANTITATIVE PARAMETERS:
The ADC map was automatically derived from the DWI protocol. The original IVIM and DKI images were imported into PRIDE DWI Tool 1.5 software (Philips Medical Systems). Then, the biexp-IVIM and kurtosis approach was selected to fit models, and the images of quantitative parameters were obtained. The DWI, IVIM, and DKI models were computed with the following equations:
S(b) represents the signal intensity at a given b value, and S0 indicates the signal intensity when the b value is assigned as 0 s/mm2. Hence, we finally acquired the images of ADC, D*, D, f, Dapp, and Kapp (Figures 1, 2).
In accordance with the pathological results, all patients were divided into the PCa group and the benign group (BPH accompanied by prostatitis and prostatic intraepithelial neoplasia or not). For the PCa group, a radiologist with 15 years of experience carefully confirmed the PCa lesion in reference to the signature of T2WI, DWI, and DCE images and matched the location of the biopsy and pathological reports (Figure 1). For the benign group, the radiologist determined the area with the highest PI-RADS v2 score as the target focus (Figure 2). Then, the radiologist recorded the location of the lesions of the 2 groups. Next, we depicted the region of interest (ROI) at the slice wherein the lesion displayed the maximum diameter within its margin. In the first step, we drew the ROI on the ADC map and measured the corresponding value by using a Philips DICOM Viewer R3.0-SP11 (Philips Medical Systems). Subsequently, we delineated the ROI in exactly the same slice and location of the D map with an identical size as the ROI on the ADC map and covered the ROI in D*, f, Dapp, and Kapp images by using Image J (NIH, Bethesda, MD, USA). If a patient had multiple lesions, only the largest lesion was selected as the objective.
IMAGING ANALYSIS OF PI-RADS V2:
Two radiologists with 5 and 2 years of experience, respectively, who were blinded to pathological reports, laboratory data, and other information, except for location, assigned PI-RADS v2 scores to the above index lesions on the PACS viewer alone. If they interpreted a lesion inconsistently, the final score was decided after their discussion.
The maximum prostate diameters were measured on axial and sagittal T2WI images. Then, the prostate volumes were calculated by using the following formula: prostate volume=(maximum AP diameter)×(maximum transverse diameter)×(maximum longitudinal diameter)×0.52.
STATISTICAL ANALYSIS:
SPSS version 20.0 (IBM, Armonk, NY, USA), MedCalc 15.2.2 (MedCalc Software, Ltd, Acacialaan 22, Ostend, Belgium), and R software version 4.0.3 (The R Foundation for Statistical Computing,
The clinical value of the LR model was demonstrated in decision curve analysis by way of calculating the net benefits at different threshold probabilities.
Results
Among the 84 patients, 32 (38%) were proven by histopathological analysis to have PCa and 52 (62%) had benign lesions. The medians and interquartile ranges of patient age was 70 (65–76) years. The medians and interquartile ranges of tPSA, f/t PSA, and PSAD were 14.30 (7.33–35.11) ng/mL, 0.12 (0.08–0.16), and 0.20 (0.11–0.52) ng/mL/cm3, respectively. Among the 32 patients with PCa, 7 (21.9%) were defined as GS=6; 6 (18.8%) were GS=7; and 19 (59.4%) were GS=8–10. Table 2 presents the characteristics of the patients.
Table 3 shows the test results of the MRI and PSA metrics between the 2 groups. The ADC, D, Dapp, and f/tPSA values of the PCa group were significantly lower than those of the benign lesion group. The D*, Kapp, tPSA, and PSAD values of the PCa group were significantly higher than those of the benign group. No significant difference in f value between the 2 groups was observed. The ROC curve analysis results of the MRI and PSA indexes are listed in Table 4. The AUC values of ADC, D, D*, Dapp, and Kapp were 0.887, 0.848, 0.672, 0.862, and 0.822, respectively, and the values of tPSA, f/tPSA, and PSAD were 0.804, 0.733, and 0.861, respectively. The above corresponding ROC curves are presented in Figure 3.
Among all patients, the number of patients with PI-RADS v2 scores of 2, 3, 4, and 5 were 23 (27.3%), 30 (35.7%), 10 (11.9%), and 21 (25%), respectively. For the recognition of PCa, the AUC value, sensitivity, specificity, PPV, and NPV of PI-RADS v2 were 0.859, 0.781, 0.885, 0.806, and 0.868, respectively, and the cutoff was over 3 points.
In the multivariate LR analysis, ADC and PSAD were the only significant variables (
The prediction probability (
The model obtained an AIC value of 59.865. The calibration curve based on internal validation suggested good agreement between the combined model predicted and actual probabilities of PCa (Figure 4). When applied in the differential diagnosis of PCa, the AUC, sensitivity, specificity, PPV, and NPV of the model were 0.911, 0.875, 0.865, 0.800, and 0.918, respectively (Table 4). The AUC value of the combined model was higher than that of the ADC, PSAD, and PI-RADS v2 in univariate analysis (Figure 3), but the Delong test showed that there was no significant difference between the AUCs of the combined model and univariate analysis. (ADC,
The decision curve analysis indicated that the combined model provided a greater net benefit over the “treat-all” or “treat-none” scheme at a threshold probability of >0.1 (Figure 4). Furthermore, the combined model generated more net benefit than the independently application of ADC, PSAD, and PI-RADS v2 in a wide range of threshold probabilities (Figure 4).
Discussion
In this study, we developed a combined model of quantitative parameters originating from 3 different MRI diffusion models and PSA-related serum marker data. Only ADC and PSAD were retained as the significant predictive factors in the model. The combined model demonstrated satisfactory discrimination and calibration and provided more net benefit when being utilized by doctors in the clinic to recognize PCa from benign disease, compared with univariate analysis and PI-RADS v2 applied alone.
In our research, we adopted 3 different diffusion models, namely DWI, IVIM, and DKI, from which we obtained different microscopic information on micromolecules. These models were related to each other but maintained their own advantages. However, in our study, the f value of IVIM could not distinguish between PCa and benign lesions, and the D* value acquired a relatively low AUC value of 0.672. The image quality of the f and D* map was insufficient (Figures 1, 2). We posited that the inadequate stability of D* and f accounted for the great reliance of IVIM parameters on the selection of b values [16]. Consistent with primary investigations [12,13,17], our study showed that D, Dapp, and Kapp could distinguish PCa from benign tissues and may become important parameters of MRI diffusion imaging.
PSA measurement is often used for the clinical diagnosis and treatment decision-making of PCa. However, PSA screening can lead to unnecessary biopsies, over-detection, over-treatment, and subsequent complications due to its poor specificity and false-positive results [18]. PSAD can distinguish PCa from BPH because it decreases the influence of enlarged prostate volume. The PSAD cutoff of 0.15 ng/mL/cm3 prevents approximately 50% of men from undergoing unnecessary biopsies [18]. In our research, the AUC (0.861), specificity (0.904), and PPV value (0.828) of PSAD were greater than those of tPSA and f/tPSA. As a result, the application of PSAD could enhance the confidence of urologists in early PCa detection programs. In addition, some novel molecular markers were explored to improve the diagnostic value of PCa. Plasma arginine and its downstream molecules were found to predict prostate biopsy outcomes in patients with a PSA of 4 to 10 ng/mL [19]. Similarly, Kazuno et al reported the serum O-glycosylated clusterin level could be a complementary indicator for the malignancy PCa, when PSA values were measured at less than 10 ng/mL [20]. Furthermore, Markin et al discovered plasma sarcosine had “very good” classification performance (AUC, 0.833) for distinguishing PCa from BPH, and the use of PSA and sarcosine together increased the overall diagnostic accuracy [21]. In the future, we may find more effective tumor makers to improve the diagnostic capability for detecting PCa.
Combining Mp-MRI and PSA laboratory indicators is a relevant strategy in the clinical identification of PCa. Constructing a predictive LR model of them is the most popular method. Lu et al established a helpful accumulating model that incorporates PSA and its derivative data into the PI-RADS v2 to diagnose clinically significant PCa [22]. Distler et al integrated PSAD with Mp-MRI to improve the NPV of PI-RADS scoring such that approximately 20% of unnecessary biopsies can be avoided [23]. To the best of our knowledge, our study represents the first instance in which quantitative MRI parameters originating from different types of diffusion models were applied together with PSA-related data. In multivariate logistic analysis, we found that only ADC and PSAD values maintained predictive capability in the combined model. This result was reasonable and predictable given that among MRI and PSA data, ADC and PSAD values demonstrated the best performance in single-variable ROC analysis. In prior studies, the ADC value was often included in the LR model for PCa evaluation [24,25], thus highlighting the function of ADC again. In our study, multivariate LR analysis did not enroll D, D*, Dapp, and Kapp values into the model likely because their predictability was inferior to the predictability of ADC, and the ADC value had an influence on other parameters. Among the PSA-related indicators, only PSAD was devoted to the model, indicating that PSAD had a growing effect in the combined models with MRI metrics. A prior multivariate LR analysis revealed that the PI-RADS v2 score and PSAD act as independent predictors for PCa and clinically significant PCa, and their conjunction is interrelated with the highest clinically significant PCa detection rates (76–97%) [26]. Furthermore, the combination of ADC and PSAD could be used to identify a Gleason score of 7 or greater PCa [27], which confirmed the feasibility of the method and the importance of the 2 metrics once more.
Compared with the application of ADC and PSAD alone, the combined model improved some performance for PCa differentiation in our study. Although there was no significant difference between the AUC values of the combined model and ADC and PSAD, the decision curve analysis showed that the combined model was more beneficial in clinical use than ADC and PSAD in univariate analysis for PCa discrimination. Furthermore, the sensitivity and NPV values (0.875 and 0.918) of our combined model was slightly improved compared with that of ADC and PSAD in independent analysis. This result might imply that the model was conducive to detecting lesions and possessed a preferable negative prediction capability. Similarly, there was no statistically significant difference between the AUC values of the combined model and PI-RADS v2. However, the net benefit generated by the combined model was greater than that of PI-RADS v2. In short, we considered that the model derived from ADC and PSAD had the potential capability to differentiate PCa from benign lesions and had good overall performance and important clinical value.
The combined diagnosis strategy is dedicated to not only identifying lesions precisely but also to reducing the rates of unnecessary biopsies. Felker et al proceeded with the multivariate LR analysis of clinical and imaging data to distinguish lesions in PI-RADS v2 category 3 in reference to MRI/ultrasound fusion biopsy results [14]. Consistent with our result, their results showed that PSAD and ADC are the most important covariates. They discovered that when PSAD was 0.15 ng/mL/cm3 or greater and the ADC value was 1000 mm2/s, the AUC for clinically significant PCa reached 0.91. According to this criterion, only 11% of men with PI-RADS v2 category 3 lesions needed a biopsy. Thus, a detection rate of 60% and a false-negative rate of only 9% were obtained through this strategy.
However, our study had some limitations. First, the sample size was insufficient. Therefore, we did not separate the data into the peripheral zone group and transitional zone group to perform our exploration. Second, DCE and T2 mapping imaging data were not included. Third, our patients did not undergo MRI-TRUS fusion biopsy, which may favor increased accuracy when applied with MRI imaging and pathology. In a future study, we will enlarge the sample size, then add DCE and T2 mapping imaging data to increase the comprehensiveness of the analysis. Utilizing systematic biopsy and MRI-TRUS fusion biopsy together will enhance our confidence.
Conclusions
ADC and PSAD were the 2 most important metrics of PCa identification. They maintained predictive capability in multivariate LR analysis. Their combined model contributed to distinguishing PCa from benign lesions and provided more clinical net benefit over ADC, PSAD, and PI-RADS v2 applied independently. We will proceed with a future study to explore the optimum threshold of the variables retained in the model.
Figures
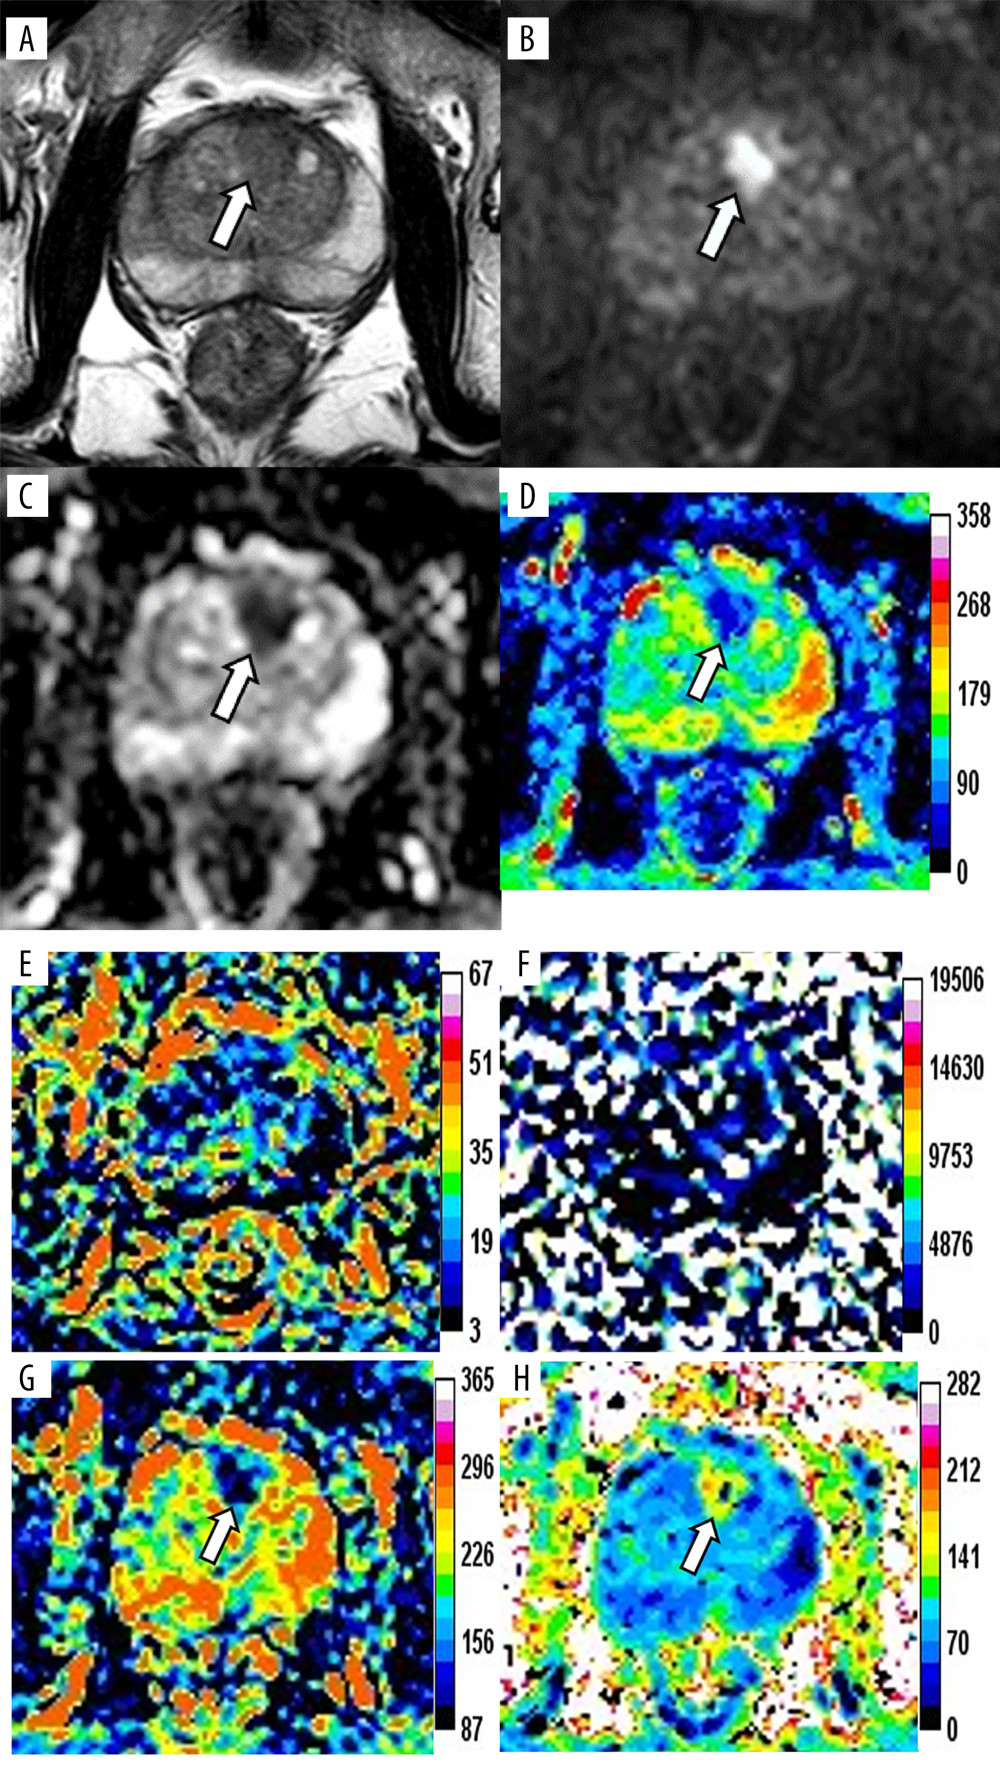 Figure 1. Magnetic resonance images of a 76-year-old patient with prostate cancer (PCa), total prostate-specific antigen (PSA) of 23.48 ng/mL, free/total PSA of 0.145, and PSA density of 0.34 ng/mL/cm3. The axis T2-weighted imaging (A) shows a low-signal area at the anterior of the transitional zone (white arrow). The lesion appears as a significantly high signal change on diffusion-weighted imaging (B, white arrow), whereas it appears as a low signal on apparent diffusion coefficient (ADC) (C, white arrow). The pseudo-color maps of D (D), Dapp (G), and Kapp (H) show the lesion clearly (white arrow). The image quality of f (E) and D* (F) are unsatisfactory. The parameter values of the lesion are 0.66×10⁻³ mm2/s (ADC), 0.64×10⁻³ mm2/s (D), 0.12 (f), 90.59×10⁻³ mm2/s (D*), 0.94×10⁻³ mm2/s (Dapp), and 1.19 (Kapp). The prediction probability (P) of the lesion being cancer can be calculated as follows:P=e(4.339+3.896×0.340-7.130×0.660)1+e(4.339+3.896×0.340-7.130×0.660)=72.2%. (Ingenia 3.0T,PHILIPS;PRIDE DWI Tool 1.5,PHILIPS;Image J 1.52a,NIH).
 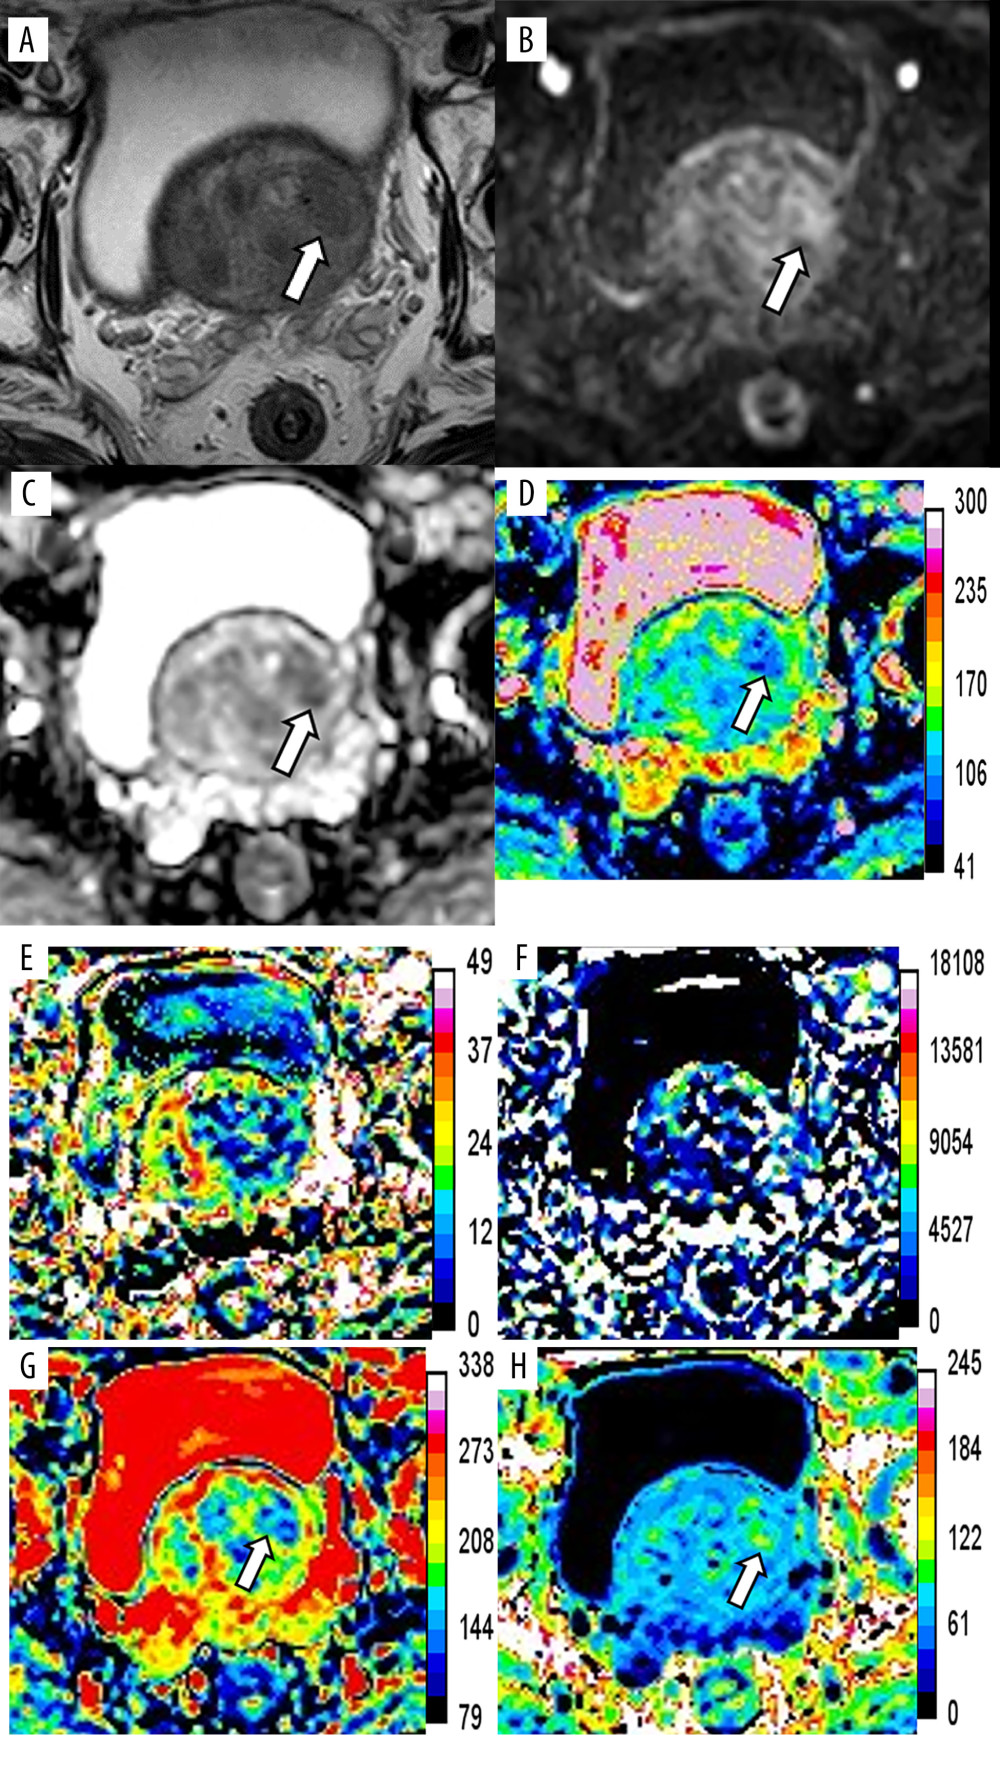 Figure 2. Magnetic resonance images of a 76-year-old patient with benign prostatic hyperplasia and chronic inflammation, total prostate-specific antigen (PSA) of 20.40 ng/mL, free/total PSA of 0.117, and PSA density of 0.19 ng/ml/cm3. The axial T2-weighted imaging (A) exhibits a circular hypointensity nodule with a clear boundary located at the left anterior of the transitional zone (white arrow). The nodule appears as a slightly high signal change (B, white arrow) on diffusion-weighted imaging and a slightly low signal on apparent diffusion coefficient (ADC) (C, white arrow). The pseudo-color maps of D (D), Dapp (G), and Kapp (H) show the lesion clearly (white arrow). The image quality of f (E) and D* (F) are unsatisfactory. The parameter values of the lesion are 0.93×10⁻³ mm2/s (ADC), 1.05×10⁻³ mm2/s (D), 0.12 (f), 101.72×10⁻³ mm2/s (D*), 1.57×10⁻³ mm2/s (Dapp), and 0.88 (Kapp). The prediction probability (P) of the lesion being cancer can be calculated as follows:P=e(4.339+3.896×0.19-7.130×0.93)1+e(4.339+3.896×0.19-7.130×0.93)=17.5%. (Ingenia 3.0T,PHILIPS;PRIDE DWI Tool 1.5,PHILIPS;Image J 1.52a,NIH).
 ![Receiver operating characteristic (ROC) curves of the independent variables and combined model. ROC curves of magnetic resonance imaging parameters (A), prostate-specific antigen (PSA) indexes (B), and comparison of ROC curves between the combined model (PSA density [PSAD]+apparent diffusion coefficient [ADC]) and ADC, PSAD, and PI-RADS v2 (C) for prostate cancer diagnosis. (MedCalc 15.2.2, MedCalc Software Ltd).](https://jours.isi-science.com/imageXml.php?i=medscimonit-28-e935307-g003.jpg&idArt=935307&w=1000) Figure 3. Receiver operating characteristic (ROC) curves of the independent variables and combined model. ROC curves of magnetic resonance imaging parameters (A), prostate-specific antigen (PSA) indexes (B), and comparison of ROC curves between the combined model (PSA density [PSAD]+apparent diffusion coefficient [ADC]) and ADC, PSAD, and PI-RADS v2 (C) for prostate cancer diagnosis. (MedCalc 15.2.2, MedCalc Software Ltd).
Figure 3. Receiver operating characteristic (ROC) curves of the independent variables and combined model. ROC curves of magnetic resonance imaging parameters (A), prostate-specific antigen (PSA) indexes (B), and comparison of ROC curves between the combined model (PSA density [PSAD]+apparent diffusion coefficient [ADC]) and ADC, PSAD, and PI-RADS v2 (C) for prostate cancer diagnosis. (MedCalc 15.2.2, MedCalc Software Ltd). ![(A)The calibration curve based on internal validation. The blue dotted line represents the performance of the ideal model. The red and green solid lines represent the performance of the combined model without and with bias correction. (B) Decision curves show that the combined model (prostate-specific antigen density [PSAD]+apparent diffusion coefficient [ADC]) added more benefit over ADC, PSAD, and PI-RADS v2 in a wide range threshold of probability. (R 4.0.3, The R Foundation for Statistical Computing).](https://jours.isi-science.com/imageXml.php?i=medscimonit-28-e935307-g004.jpg&idArt=935307&w=1000) Figure 4. (A)The calibration curve based on internal validation. The blue dotted line represents the performance of the ideal model. The red and green solid lines represent the performance of the combined model without and with bias correction. (B) Decision curves show that the combined model (prostate-specific antigen density [PSAD]+apparent diffusion coefficient [ADC]) added more benefit over ADC, PSAD, and PI-RADS v2 in a wide range threshold of probability. (R 4.0.3, The R Foundation for Statistical Computing).
Figure 4. (A)The calibration curve based on internal validation. The blue dotted line represents the performance of the ideal model. The red and green solid lines represent the performance of the combined model without and with bias correction. (B) Decision curves show that the combined model (prostate-specific antigen density [PSAD]+apparent diffusion coefficient [ADC]) added more benefit over ADC, PSAD, and PI-RADS v2 in a wide range threshold of probability. (R 4.0.3, The R Foundation for Statistical Computing). References
1. Sung H, Ferlay J, Siegel RL, Global cancer statistics 2020: Globocan estimates of incidence and mortality worldwide for 36 cancers in 185 countries: Cancer J Clin, 2021; 71(3); 209-49
2. American Cancer Society: Key statistics for prostate cancer https://www.cancer.org/cancer/prostate-cancer/about/key-statistics
3. American Cancer Society: Cancer Statistics Center [cited 2022 February 7]. Available from: https://cancerstatisticscenter.cancer.org/module/4nbAXZtX
4. Gentile F, Ferro M, Della Ventura B, Optimized identification of high-grade prostate cancer by combining different PSA molecular forms and PSA density in a deep learning model: Diagnostics (Basel), 2021; 11(2); 335
5. Flores-Fraile MC, Padilla-Fernández BY, Valverde-Martínez S, The association between prostate-specific antigen velocity (PSAV), value and acceleration, and of the free PSA/Total PSA index or ratio, with prostate conditions: J Clin Med, 2020; 9(11); 3400
6. Ankerst DP, Gelfond J, Goros M, Serial percent free prostate specific antigen in combination with prostate specific antigen for population based early detection of prostate cancer: J Urol, 2016; 196(2); 355-60
7. Aminsharifi A, Howard L, Wu Y, Prostate specific antigen density as a predictor of clinically significant prostate cancer when the prostate specific antigen is in the diagnostic gray zone: Defining the optimum cutoff point stratified by race and body mass index: J Urol, 2018; 200(4); 758-66
8. Weinreb JC, Barentsz JO, Choyke PL, PI-RADS prostate imaging – reporting and data system: 2015, version 2: Eur Urol, 2016; 69(1); 16-40
9. Kim CK, Park BK, Kim B, Diffusion-weighted MRI at 3 T for the evaluation of prostate cancer: Am J Roentgenol, 2010; 194(6); 1461-69
10. Le Bihan D, Breton E, Lallemand D, Separation of diffusion and perfusion in intravoxel incoherent motion MR imaging: Radiology, 1988; 168(2); 497-505
11. Quentin M, Pentang G, Schimmöller L, Feasibility of diffusional kurtosis tensor imaging in prostate MRI for the assessment of prostate cancer: Preliminary results: Magn Reson Imaging, 2014; 32(7); 880-85
12. Liu Y, Wang X, Cui Y, Comparative study of monoexponential, intravoxel incoherent motion, Kurtosis, and IVIM-Kurtosis models for the diagnosis and aggressiveness assessment of prostate cancer: Front Oncol 11, 2020; 10; 1763
13. Li C, Chen M, Wan B, A comparative study of Gaussian and non-Gaussian diffusion models for differential diagnosis of prostate cancer with in-bore transrectal MR-guided biopsy as a pathological reference: Acta Radiol, 2018; 59(11); 1395-402
14. Felker ER, Raman SS, Margolis DJ, Risk stratification among men with prostate imaging reporting and data system version 2 category 3 transition zone lesions: Is biopsy always necessary?: Am J Roentgenol, 2017; 209(6); 1272-77
15. Rais-Bahrami S, Siddiqui MM, Vourganti S, Diagnostic value of biparametric magnetic resonance imaging (MRI) as an adjunct to prostate-specific antigen (PSA)-based detection of prostate cancer in men without prior biopsies: BJU Int, 2015; 115(3); 381-88
16. Pang Y, Turkbey B, Bernardo M, Intravoxel incoherent motion MR imaging for prostate cancer: An evaluation of perfusion fraction and diffusion coefficient derived from different b-value combinations: Magn Reson Med, 2013; 69(2); 553-62
17. Yin H, Wang D, Yan R, Comparison of diffusion kurtosis imaging and amide proton transfer imaging in the diagnosis and risk assessment of prostate cancer: Front Oncol, 2021; 11; 640906
18. Carroll PH, Mohler JL, NCCN guidelines updates: Prostate cancer and prostate cancer early detection: J Natl Compr Canc Netw, 2018; 16; 620-23
19. Selvi I, Basar H, Baydilli N, The importance of plasma arginine level and its downstream metabolites in diagnosing prostate cancer: Int Urol Nephrol, 2019; 51(11); 1975-83
20. Kazuno S, Fujimura T, Fujime M, O-glycosylated clusterin as a sensitive marker for diagnosing early stages of prostate cancer: Prostate, 2021; 81(3); 170-81
21. Markin PA, Brito A, Moskaleva N, Plasma sarcosine measured by gas chromatography-mass spectrometry distinguishes prostatic intraepithelial neoplasia and prostate cancer from benign prostate hyperplasia: Lab Med, 2020; 51(6); 566-73
22. Lu YF, Zhang Q, Yao WG, Optimizing prostate cancer accumulating model: Combined PI-RADS v2 with prostate specific antigen and its derivative data: Cancer Imaging, 2019; 19(1); 26
23. Distler FA, Radtke JP, Bonekamp D, The value of PSA density in combination with PI-RADS™ for the accuracy of prostate cancer prediction: J Urol, 2017; 198(3); 575-82
24. Iyama Y, Nakaura T, Katahira K, Development and validation of a logistic regression model to distinguish transition zone cancers from benign prostatic hyperplasia on multi-parametric prostate MRI: Eur Radiol, 2017; 27(9); 3600-8
25. Dikaios N, Alkalbani J, Sidhu HS, Logistic regression model for diagnosis of transition zone prostate cancer on multi-parametric MRI: Eur Radiol, 2015; 25(2); 523-32
26. Washino S, Okochi T, Saito K, Combination of prostate imaging reporting and data system (PI-RADS) score and prostate-specific antigen (PSA) density predicts biopsy outcome in prostate biopsy naïve patients: BJU Int, 2017; 119(2); 225-33
27. Lee SJ, Oh YT, Jung DC, Combined analysis of biparametric mri and prostate-specific antigen density: Role in the prebiopsy diagnosis of gleason score 7 or greater prostate cancer: Am J Roentgenol, 2018; 211(3); W166-72
Figures
Figure 1. Magnetic resonance images of a 76-year-old patient with prostate cancer (PCa), total prostate-specific antigen (PSA) of 23.48 ng/mL, free/total PSA of 0.145, and PSA density of 0.34 ng/mL/cm3. The axis T2-weighted imaging (A) shows a low-signal area at the anterior of the transitional zone (white arrow). The lesion appears as a significantly high signal change on diffusion-weighted imaging (B, white arrow), whereas it appears as a low signal on apparent diffusion coefficient (ADC) (C, white arrow). The pseudo-color maps of D (D), Dapp (G), and Kapp (H) show the lesion clearly (white arrow). The image quality of f (E) and D* (F) are unsatisfactory. The parameter values of the lesion are 0.66×10⁻³ mm2/s (ADC), 0.64×10⁻³ mm2/s (D), 0.12 (f), 90.59×10⁻³ mm2/s (D*), 0.94×10⁻³ mm2/s (Dapp), and 1.19 (Kapp). The prediction probability (P) of the lesion being cancer can be calculated as follows:P=e(4.339+3.896×0.340-7.130×0.660)1+e(4.339+3.896×0.340-7.130×0.660)=72.2%. (Ingenia 3.0T,PHILIPS;PRIDE DWI Tool 1.5,PHILIPS;Image J 1.52a,NIH).Figure 2. Magnetic resonance images of a 76-year-old patient with benign prostatic hyperplasia and chronic inflammation, total prostate-specific antigen (PSA) of 20.40 ng/mL, free/total PSA of 0.117, and PSA density of 0.19 ng/ml/cm3. The axial T2-weighted imaging (A) exhibits a circular hypointensity nodule with a clear boundary located at the left anterior of the transitional zone (white arrow). The nodule appears as a slightly high signal change (B, white arrow) on diffusion-weighted imaging and a slightly low signal on apparent diffusion coefficient (ADC) (C, white arrow). The pseudo-color maps of D (D), Dapp (G), and Kapp (H) show the lesion clearly (white arrow). The image quality of f (E) and D* (F) are unsatisfactory. The parameter values of the lesion are 0.93×10⁻³ mm2/s (ADC), 1.05×10⁻³ mm2/s (D), 0.12 (f), 101.72×10⁻³ mm2/s (D*), 1.57×10⁻³ mm2/s (Dapp), and 0.88 (Kapp). The prediction probability (P) of the lesion being cancer can be calculated as follows:P=e(4.339+3.896×0.19-7.130×0.93)1+e(4.339+3.896×0.19-7.130×0.93)=17.5%. (Ingenia 3.0T,PHILIPS;PRIDE DWI Tool 1.5,PHILIPS;Image J 1.52a,NIH).Figure 3. Receiver operating characteristic (ROC) curves of the independent variables and combined model. ROC curves of magnetic resonance imaging parameters (A), prostate-specific antigen (PSA) indexes (B), and comparison of ROC curves between the combined model (PSA density [PSAD]+apparent diffusion coefficient [ADC]) and ADC, PSAD, and PI-RADS v2 (C) for prostate cancer diagnosis. (MedCalc 15.2.2, MedCalc Software Ltd).Figure 4. (A)The calibration curve based on internal validation. The blue dotted line represents the performance of the ideal model. The red and green solid lines represent the performance of the combined model without and with bias correction. (B) Decision curves show that the combined model (prostate-specific antigen density [PSAD]+apparent diffusion coefficient [ADC]) added more benefit over ADC, PSAD, and PI-RADS v2 in a wide range threshold of probability. (R 4.0.3, The R Foundation for Statistical Computing). Tables
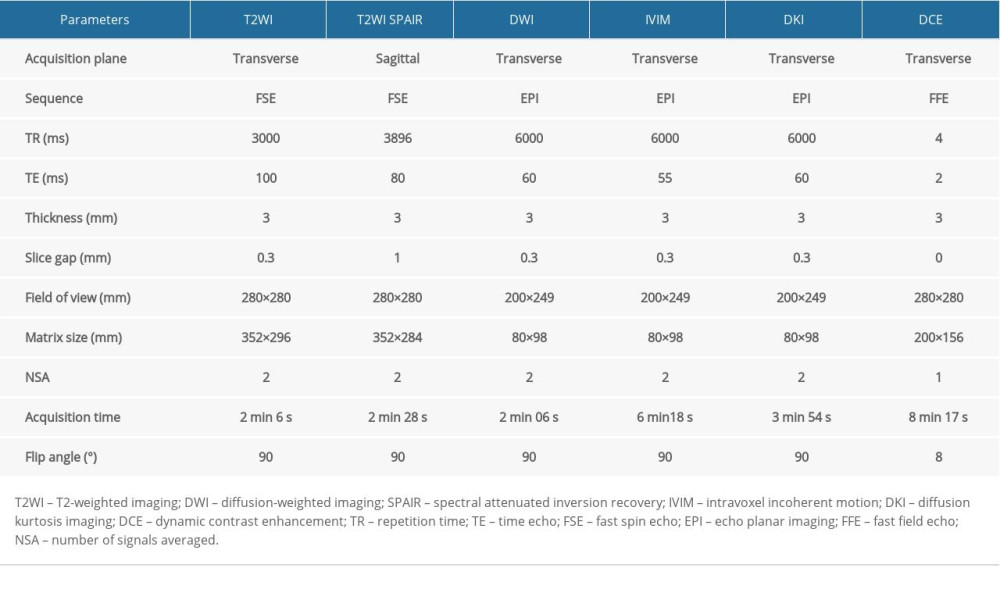 Table 1. Primary MRI protocol parameters.
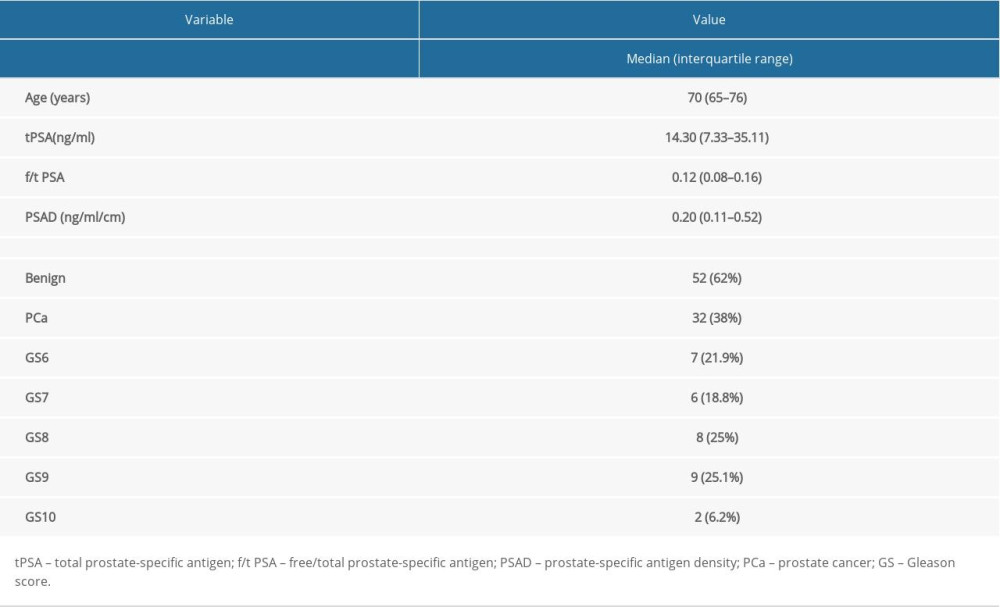 Table 2. Patients’ characteristics.
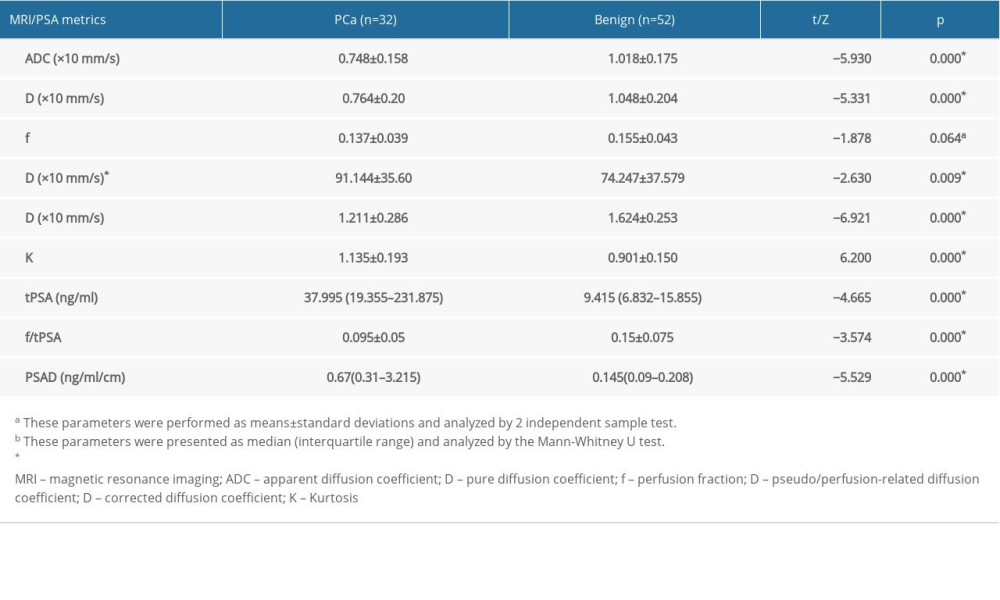 Table 3. MRI results and PSA metrics of the two groups.
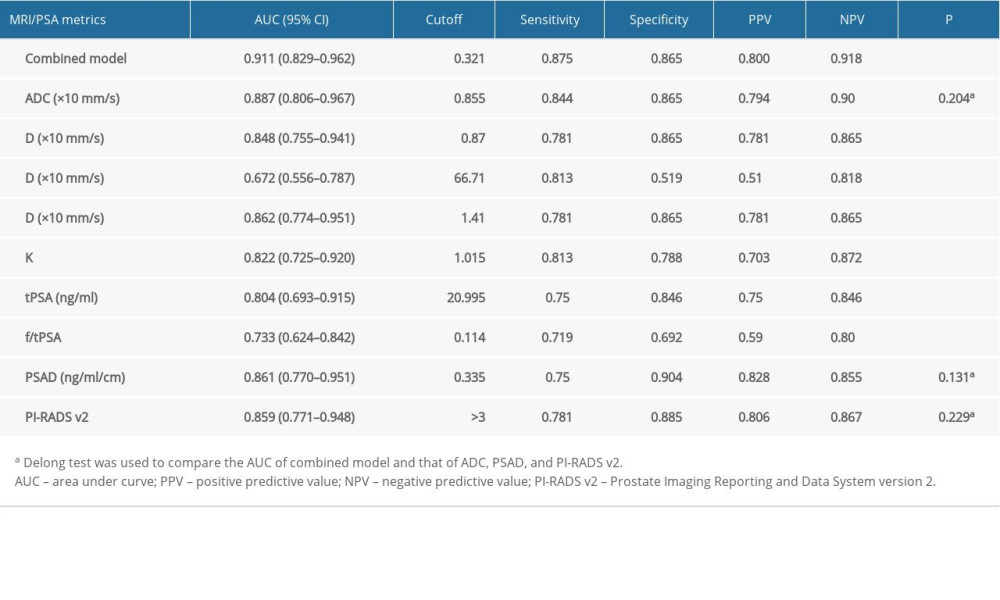 Table 4. Performance of the independent variables and combined model.
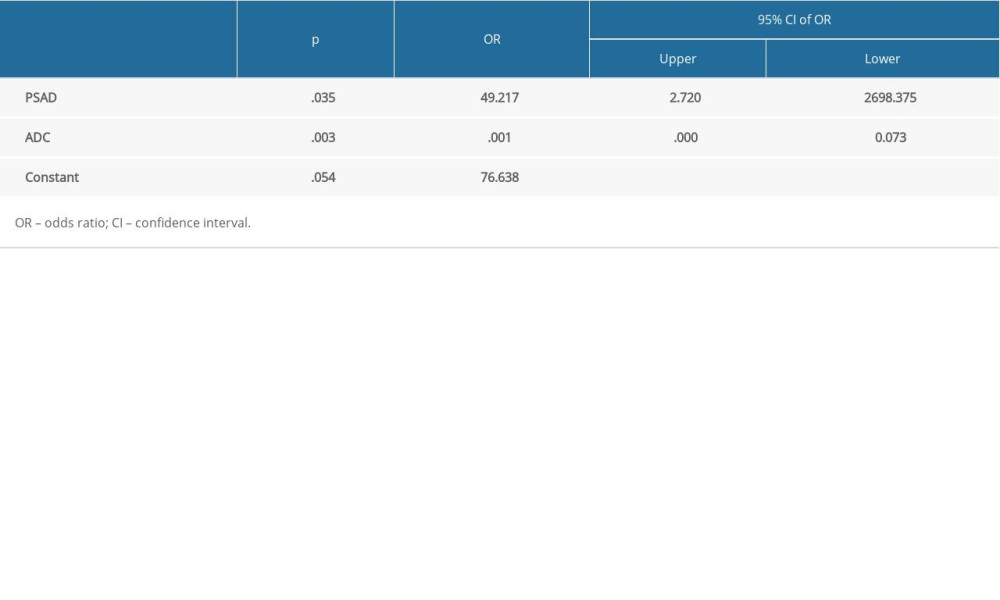 Table 5. Statistical parameters of the combined LR model.Table 1. Primary MRI protocol parameters.Table 2. Patients’ characteristics.Table 3. MRI results and PSA metrics of the two groups.Table 4. Performance of the independent variables and combined model.Table 5. Statistical parameters of the combined LR model.
 In Press
Clinical Research
Analysis of the Clinical Characteristics and Endoscopic Features of Phytobezoar-Induced Ulcers and Gastric ...Med Sci Monit In Press; DOI: 10.12659/MSM.952191
Clinical Research
Effect of Indirect Co-Culture With Gingival Mesenchymal Stem Cells on Cytokine Secretion in Primary Oral Sq...Med Sci Monit In Press; DOI: 10.12659/MSM.952439
Clinical Research
Comparison of Sleep Architecture in Individuals Aged 65 to 80 Years With and Without Mild Cognitive Impairm...Med Sci Monit In Press; DOI: 10.12659/MSM.952493
Clinical Research
Effects of Single-Bout Endurance Exercise Intensity on Peripheral Neurotrophic Factors in Patients With Isc...Med Sci Monit In Press; DOI: 10.12659/MSM.952089
Most Viewed Current Articles
17 Jan 2024 : Review article 14,176,514
Vaccination Guidelines for Pregnant Women: Addressing COVID-19 and the Omicron VariantDOI :10.12659/MSM.942799
Med Sci Monit 2024; 30:e942799
13 Nov 2021 : Clinical Research 3,760,677
Acceptance of COVID-19 Vaccination and Its Associated Factors Among Cancer Patients Attending the Oncology ...DOI :10.12659/MSM.932788
Med Sci Monit 2021; 27:e932788
14 Dec 2022 : Clinical Research 2,466,264
Prevalence and Variability of Allergen-Specific Immunoglobulin E in Patients with Elevated Tryptase LevelsDOI :10.12659/MSM.937990
Med Sci Monit 2022; 28:e937990
16 May 2023 : Clinical Research 708,906
Electrophysiological Testing for an Auditory Processing Disorder and Reading Performance in 54 School Stude...DOI :10.12659/MSM.940387
Med Sci Monit 2023; 29:e940387