04 August 2023: Clinical Research
Impact of Coexisting Risk Factors on Outcomes in Patients with Acute Coronary Syndrome: A Real-World Analysis Using the Taiwan Chang Gung Research Database
Wei-Chieh LeeDOI: 10.12659/MSM.941258
Med Sci Monit 2023; 29:e941258


Abstract
BACKGROUND: Diabetes mellitus (DM), chronic kidney disease (CKD), and advanced age are associated with poor outcomes in patients with acute coronary syndrome (ACS). This real-world study utilized data from the Taiwan Chang Gung Research Database (CGRD) to compare outcomes in ACS patients with DM, CKD, and the elderly.
MATERIAL AND METHODS: The study enrolled 28,613 ACS patients diagnosed based on CGRD medical records between January 2005 and December 2019. Baseline characteristics and clinical outcomes were compared among groups based on patient characteristics.
RESULTS: Within the ACS cohort, 42.1% had DM, 48.2% had CKD, and 33.6% were elderly. Among them, 10.7% (3,070) were elderly patients with both DM and CKD. Elderly patients with DM and CKD had significantly higher risks of gastrointestinal bleeding (hazard ratio=11.32), cardiovascular events (HR=7.29), and all-cause mortality (HR=8.59). Patients with three or at least two of these risk factors had a 2.20-2.99-fold increased risk of recurrent ACS during the three-year follow-up period.
CONCLUSIONS: Patients with the combination of DM, CKD, and advanced age (elderly) experienced an 11.32-fold increased risk of gastrointestinal bleeding, 7.29-fold increased risk of cardiovascular events, and 8.59-fold increased risk of all-cause mortality compared to those without these risk factors. Furthermore, patients with two or more of these risk factors had a 2- to 3-fold increased risk of recurrent ACS. These findings emphasize the importance of managing multiple risk factors in ACS patients to improve outcomes.
Keywords: acute coronary syndrome, Diabetes Mellitus, Frail Elderly, Prognosis, Renal Insufficiency, Chronic, Humans, Aged, Taiwan, Risk Factors, Gastrointestinal Hemorrhage
Background
Acute coronary syndrome (ACS) refers to acute myocardial ischemia and/or infarction due to various degrees of coronary blood flow reduction due to plaque rupture/erosion and thrombosis formation or supply and demand mismatch; ACS presents as unstable angina, non-ST-segment elevation myocardial infarction (NSTEMI), and ST-segment elevation myocardial infarction (STEMI) [1]. In the current aging society, ACS is still a major health problem, especially in the elderly population [2]. Elderly patients continue to be at high risk of poor prognosis, are less likely to receive evidence-based care, and have high mortality rates regardless of evidence-based care [3–6]. Advanced age, chronic kidney disease (CKD), diabetes mellitus (DM), multiple vessel disease, partial revascularization, and hemodynamic instability were predictive factors for mortality among patients with ACS [3,7–9]. In the Asian population with ACS, TIMI and GRACE risk scores demonstrated good predictive accuracies, but most studies only focused on the patients with STEMI and short-term prognosis [10,11]. In elderly patients with ACS, 2 of the most common comorbidities are DM and CKD, affecting 20% to 30% of this population [12]. However, few large cohort studies have reported the impact of DM, CKD, and advanced age on the prognosis of Asian patients with ACS.
The Chang Gung Research Database (CGRD) is a database derived from the original medical records of Chang Gung Memorial Hospital (CGMH), which comprises 7 medical institutes spanning from the northeast to southern regions of Taiwan. CGMH, with its 10 070 beds, admits over 280 000 patients annually. Moreover, the CGRD is a multi-institutional, original medical record-based research database that offers extensive overall and disease-specific coverage of Taiwan. It is worth noting that the CGRD exhibits significantly higher severity of comorbidities [13,14]. Studies conducted using the CGRD have been recognized for their high quality and positive impact on healthcare in Taiwan. Notably, the CGRD has been utilized for ACS research to explore the effects of conduction delay and the prognosis of real-world lipid control [15,16].
Therefore, this real-world study used data from the Taiwan CGRD to compare outcomes in patients with ACS, DM, CKD, and advanced age.
Material and Methods
ETHICS STATEMENT:
This retrospective study was approved for human research by the Institutional Review Committee of the Kaohsiung Chang Gung Memorial Hospital (number: 202101103B0) and conformed to the guidelines of the 1975 Declaration of Helsinki. Informed consent was waived because of the retrospective nature of the study and the use of anonymous clinical data in the analysis.
PATIENT POPULATION AND GROUPS:
Patients diagnosed with ACS from January 2005 to December 2019 were recruited and their medical history was obtained from the CGRD, which is the largest healthcare system in Taiwan.
The inclusion criteria were age ≥18 years and a diagnosis of ACS (International Classification of Diseases, Ninth Revision, Clinical Modification [ICD-9-CM] code 410.xx, 411.xx, and 412.xx, or Tenth Revision [ICD-10] codes I20, I21, and I22). Patients were divided into DM, non-DM, CKD, non-CKD, elderly, and non-elderly groups according to comorbidities and age. CKD was defined as a creatinine clearance (Cockcroft-Gault equation) <60 mL/min. Elderly patients were defined as those aged >75 years old.
BASELINE AND OUTCOME VARIABLES:
Data on general demographics, comorbidities, medication use, gastrointestinal (GI) bleeding, recurrent ACS, cardiovascular (CV) mortality, and all-cause mortality of patients were obtained and compared between the groups with or without risk factors.
DEFINITIONS:
GI bleeding was defined as an episode of coffee ground emesis, hematemesis, melena, or red blood per rectum occurring after an ACS episode and documented by the treating physician [17]. ACS was defined as any group of clinical symptoms compatible with acute myocardial ischemia, and included UA, NSTEMI, and STEMI. CV mortality was defined as CV-related death. All-cause mortality was defined as death from any cause of death.
STUDY ENDPOINTS:
Study endpoints were GI bleeding, recurrent ACS, CV mortality, and all-cause mortality.
STATISTICAL ANALYSES:
Data are presented as mean±standard deviation or numbers (percentages) for descriptive statistics. Clinical characteristics of the 2 groups were compared using the independent sample
Results
COMPARISON OF BASELINE CHARACTERISTICS BETWEEN PATIENTS WITH AND WITHOUT DM:
This study enrolled 28 163 participants; baseline characteristics and medications are shown in Table 1. Between non-DM (57.9%) and DM (42.1%) populations, older age (non-DM vs DM; 66.02±14.68 years old vs 67.98±12.25 years old; P<0.001), lower prevalence of males (non-DM vs DM; 73.47% vs 62.89%; P<0.001), and higher body mass index (BMI) (non-DM vs DM; 24.67±4.31 kg/m2 vs 25.20±4.42 kg/m2; P<0.001) presented in patients with DM. A significantly higher prevalence of comorbidities, except for chronic obstructive pulmonary disease and smoking, was noted when DM was compared with the non-DM population. A higher prevalence of clopidogrel use and shorter follow-up period were noted in patients with DM.
COMPARISON OF BASELINE CHARACTERISTICS BETWEEN PATIENTS WITH AND WITHOUT CKD:
Between non-CKD (51.8%) and CKD (48.2%) populations, older age (non-CKD vs CKD; 61.69±13.50 years old vs 71.77±12.10 years old;
COMPARISON OF BASELINE CHARACTERISTICS BETWEEN NON-ELDERLY AND ELDERLY PATIENTS:
Between non-elderly (66.4%) and elderly (33.6%) populations, older age (non-elderly vs elderly; 59.41±10.17 years old vs 81.86±5.10 years old;
KAPLAN-MEIER CURVE ANALYSIS AND HRS FOR GI BLEEDING IN PATIENTS WITH DIFFERENT RISK FACTORS DURING THE 3-YEAR FOLLOW-UP PERIOD:
Figure 1A shows the Kaplan-Meier curve analysis for GI bleeding between the ACS population with DM, CKD, or advanced age, or the combination of 2 or 3 risk factors (log-rank P<0.001).
In patients with 1 risk factor (DM, CKD, or age; Figure 1B), the HRs of GI bleeding were 1.87 (95% CI: 1.48–2.35; P<0.001), 3.39 (95% CI: 2.74–4.18; P<0.001), and 4.33 (95% CI: 3.42–5.50; P<0.001), respectively. In the patients with a combination of 2 risk factors, the HR of GI bleeding was 6.83 (95% CI: 5.26–8.86; P<0.001) for advanced age plus DM, 3.39 (95% CI: 6.58–9.60; P<0.001) for CKD plus advanced age, and 6.21 (95% CI: 5.17–7.45; P<0.001) for CKD plus DM. In elderly patients with DM and CKD, the HR of GI bleeding was 11.32 (95% CI: 9.41–13.61; P<0.001) during the 3-year follow-up period.
KAPLAN-MEIER CURVE ANALYSIS AND HRS FOR RECURRENT ACS IN PATIENTS WITH DIFFERENT RISK FACTORS DURING THE 3-YEAR FOLLOW-UP PERIOD:
Figure 2A shows the Kaplan-Meier curve analysis for recurrent ACS between the ACS population with DM, CKD, or advanced age, or the combination of 2 or 3 risk factors (log-rank P<0.001).
In patients with 1 risk factor (DM, CKD, or age; Figure 2B), the HRs of recurrent ACS were 1.13 (95% CI: 0.99–1.29; P=0.070), 1.63 (95% CI: 1.44–1.85; P<0.001), and 1.62 (95% CI: 1.38–1.91; P<0.001), respectively. In patients with a combination of 2 risk factors, the HR of recurrent ACS was 2.20 (95% CI: 1.81–2.67; P<0.001) for advanced age plus DM, 2.35 (95% CI: 2.08–2.66; P<0.001) for CKD plus advanced age, 2.72 (95% CI: 2.45–3.03; P<0.001) for CKD plus DM. In elderly patients with DM and CKD, the HR of recurrent ACS was 2.99 (95% CI: 2.65–3.37; P<0.001) during the 3-year follow-up period.
KAPLAN-MEIER CURVE ANALYSIS AND HR FOR CV MORTALITY IN PATIENTS WITH DIFFERENT RISK FACTORS DURING THE 3-YEAR FOLLOW-UP PERIOD:
Figure 3A shows the Kaplan-Meier curve analysis for CV mortality between the ACS population with DM, CKD, or advanced age, or the combination of 2 or 3 risk factors (log-rank P<0.001).
In patients with 1 risk factor (DM, CKD, or age; Figure 3B), the HRs of CV mortality were 1.19 (95% CI: 1.00–1.42; P=0.057), 4.43 (95% CI: 3.88–5.05; P<0.001), and 4.47 (95% CI: 3.84–5.21; P<0.001), respectively. In patients with a combination of 2 risk factors, the HR of CV mortality was 4.53 (95% CI: 3.74–5.49; P<0.001) for advanced age plus DM, 8.76 (95% CI: 7.76–9.89; P<0.001) for CKD plus advanced age, and 4.17 (95% CI: 3.66–4.74; P<0.001) for CKD plus DM. In elderly patients with DM and CKD, the HR of CV mortality was 7.29 (95% CI: 6.42–8.29; P<0.001) during the 3-year follow-up period.
KAPLAN-MEIER CURVE ANALYSIS AND HR FOR ALL-CAUSE MORTALITY IN THE PATIENTS WITH DIFFERENT RISK FACTORS DURING THE 3-YEAR FOLLOW-UP PERIOD:
Figure 4A shows the Kaplan-Meier curve analysis for all-cause mortality between the ACS population with DM, CKD, or advanced age, or the combination of 2 or 3 risk factors (log-rank P<0.001).
In patients with 1 risk factor (DM, CKD, or age; Figure 4B), the HR of all-cause mortality was 1.37 (95% CI: 1.23–1.52; P<0.001), 3.92 (95% CI: 3.60–4.27; P<0.001), and 5.05 (95% CI: 4.60–5.55; P<0.001), respectively. In patients with combination of 2 risk factors, the HR of all-cause mortality was 5.30 (95% CI: 4.72–5.95; P<0.001) for advanced age plus DM, 8.27 (95% CI: 7.66–8.94; P<0.001) for CKD plus advanced age, and 4.75 (95% CI: 4.39–5.15; P<0.001) for CKD plus DM. In elderly patients with DM and CKD, the HR of CV mortality was 8.59 (95% CI: 7.94–9.30; P<0.001) during the 3-year follow-up period.
Discussion
STUDY LIMITATIONS:
This study had the limitations of having a retrospective study design and obtaining patient information from medical records. The study focused on the risk factors of DM, CKD, and advanced age and did not explore the effect of coronary artery disease and left ventricular performance severity. We also did not explore the effect of different medical treatments. Nevertheless, our results provide valuable information regarding important factors, including DM, CKD, and advanced age, and the associated clinical outcomes in patients with ACS.
Conclusions
In patients with 3 risk factors (DM, CKD, and advanced age), there was an 11.32-fold increased risk of GI bleeding, 7.29-fold increased risk of CV mortality, and 8.59-fold increased risk of all-cause mortality compared to the population without DM, CKD, and advanced age. Additionally, patients with 2 or more risk factors had a 2- to 3-fold increased risk of recurrent ACS than the population without DM, CKD, and advanced age.
Figures
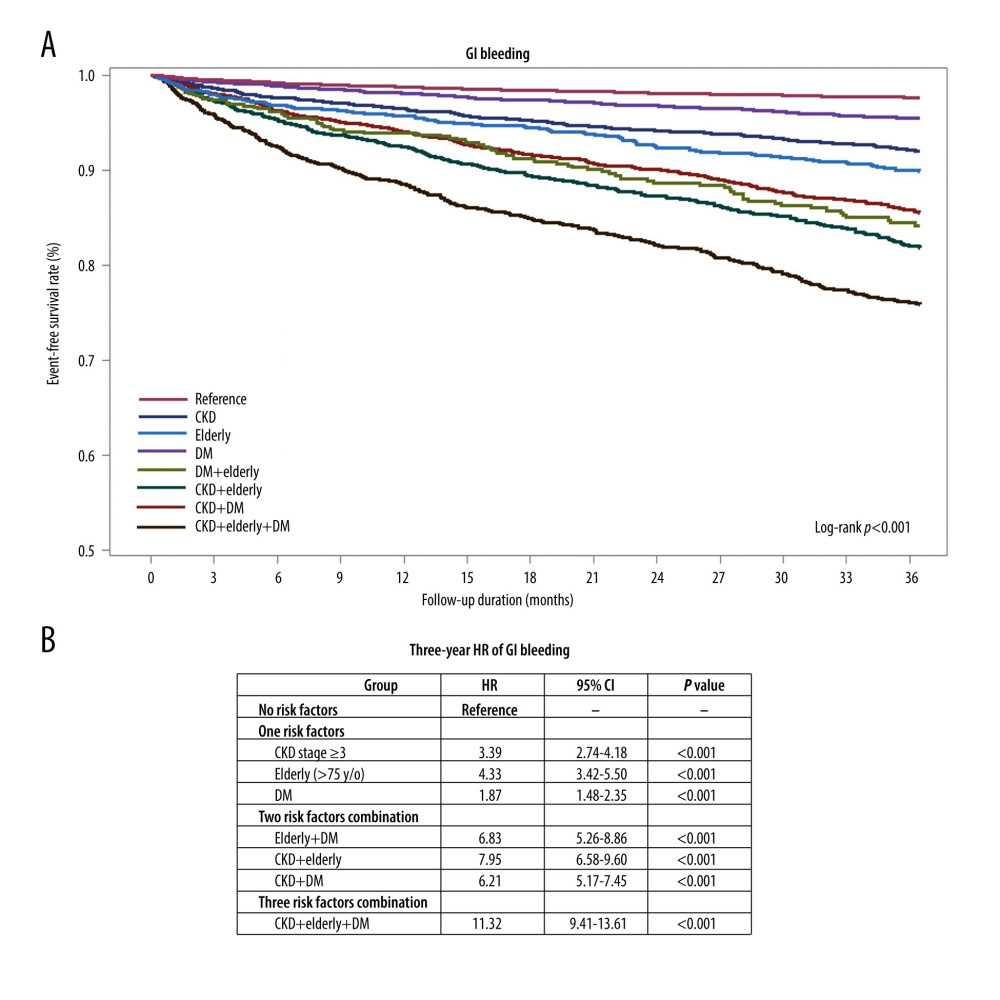 Figure 1. Kaplan-Meier curve analysis and hazard ratios (HRs) for gastrointestinal (GI) bleeding in patients with acute coronary syndrome (ACS) and a combination of diabetes mellitus (DM), chronic kidney disease (CKD), or advanced age during the 3-year follow-up period. (A) Kaplan-Meier curve analysis for GI bleeding between the ACS population with DM, CKD, or advanced age, or the combination of 2 or 3 risk factors (log-rank P<0.001). (B) In patients with 1 risk factor (DM, CKD, or elderly age), the HR of GI bleeding was 1.87 (95% CI: 1.48–2.35; P<0.001), 3.39 (95% CI: 2.74–4.18; P<0.001), and 4.33 (95% CI: 3.42–5.50; P<0.001), respectively. In patients with a combination of 2 risk factors, the HR of GI bleeding was 6.83 (95% CI: 5.26–8.86; P<0.001) for elderly age plus DM, 3.39 (95% CI: 6.58–9.60; P<0.001) for CKD plus elderly age, 6.21 (95% CI: 5.17–7.45; P<0.001) for CKD plus DM. In elderly patients with DM and CKD, HR of GI bleeding was 11.32 (95% CI: 9.41–13.61; P<0.001) during the 3-year follow-up period.
 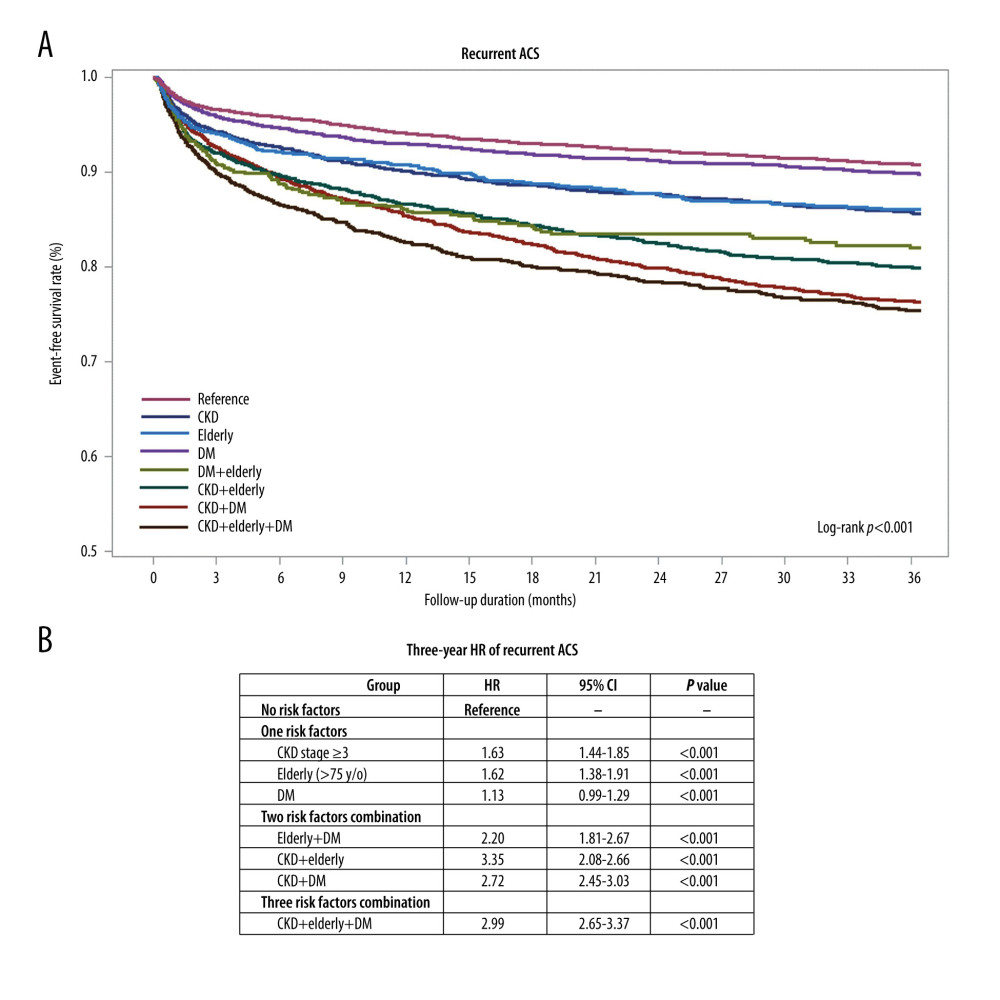 Figure 2. Kaplan-Meier curve analysis and hazard ratios (HRs) for recurrent acute coronary syndrome (ACS) in patients with ACS and a combination of diabetes mellitus (DM), or chronic kidney disease (CKD), or advanced age during the 3-year follow-up period. (A) Kaplan-Meier curve analysis for recurrent ACS between the ACS population with DM, CKD, or advanced age, or the combination of 2 or 3 risk factors (log-rank P<0.001). (B) In patients with 1 risk factor (DM, CKD, or advanced age), the HR of recurrent ACS was 1.13 (95% CI: 0.99–1.29; P=0.070), 1.63 (95% CI: 1.44–1.85; P<0.001), and 1.62 (95% CI: 1.38–1.91; P<0.001), respectively. In patients with a combination of 2 risk factors, the HR of recurrent ACS was 2.20 (95% CI: 1.81–2.67; P<0.001) for advanced age plus DM, 2.35 (95% CI: 2.08–2.66; P<0.001) for CKD plus advanced age, and 2.72 (95% CI: 2.45–3.03; P<0.001) for CKD plus DM. In elderly patients with DM and CKD, the HR of recurrent ACS was 2.99 (95% CI: 2.65–3.37; P<0.001) during the 3-year follow-up period.
 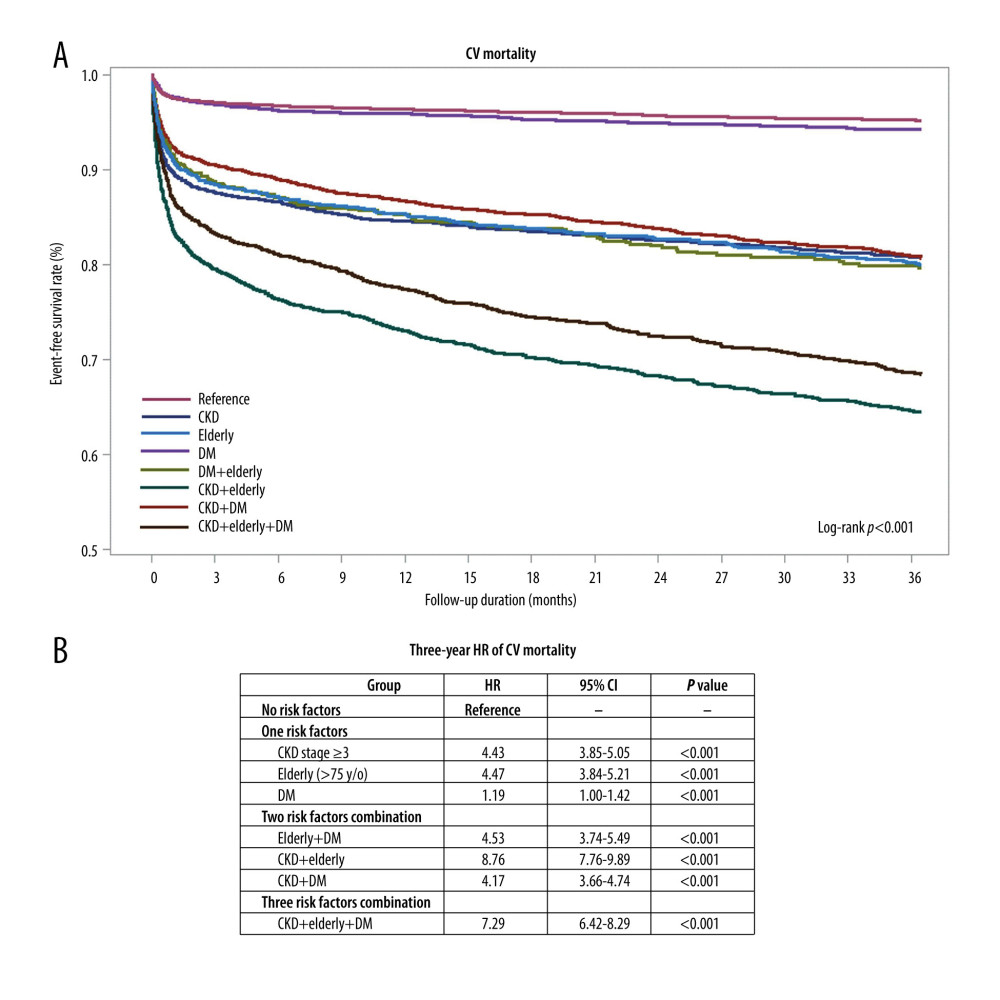 Figure 3. Kaplan-Meier curve analysis and hazard ratios (HRs) for cardiovascular (CV) mortality in patients with acute coronary syndrome (ACS) and a combination of diabetes mellitus (DM), or chronic kidney disease (CKD), or advanced age during the 3-year follow-up period. (A) Kaplan-Meier curve analysis for CV mortality between the ACS population with DM, CKD, or advanced age, or the combination of 2 or 3 risk factors (log-rank P<0.001). (B) In patients with 1 risk factor (DM, CKD, or advanced age), HR of CV mortality was 1.19 (95% CI: 1.00–1.42; P=0.057), 4.43 (95% CI: 3.88–5.05; P<0.001), and 4.47 (95% CI: 3.84–5.21; P<0.001), respectively. In patients with combination of two risk factors, HR of CV mortality was 4.53 (95% CI: 3.74–5.49; P<0.001) for advanced age plus DM, 8.76 (95% CI: 7.76–9.89; P<0.001) for CKD plus advanced age, and 4.17 (95% CI: 3.66–4.74; P<0.001) for CKD plus DM. In elderly patients with DM and CKD, HR of CV mortality was 7.29 (95% CI: 6.42–8.29; P<0.001) during the 3-year follow-up period.
 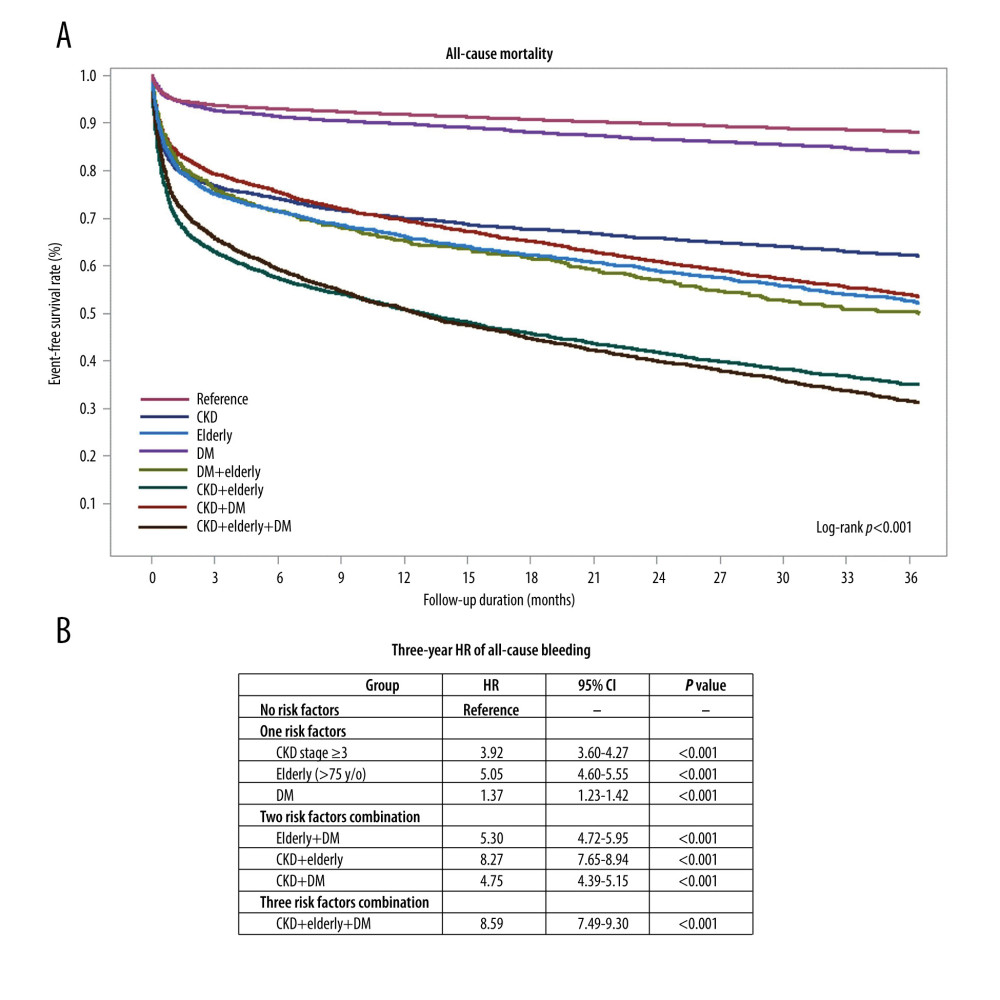 Figure 4. Kaplan-Meier curve analysis and hazard ratios (HRs) for all-cause mortality in patients with acute coronary syndrome (ACS) and a combination of diabetes mellitus (DM), or chronic kidney disease (CKD), or advanced age during the 3-year follow-up period. (A) Kaplan-Meier curve analysis for all-cause mortality between the ACS population with DM, CKD, or advanced age, or the combination of 2 or 3 risk factors (log-rank P<0.001). (B) In patients with 1 risk factor (DM, CKD, or advanced age), HR of all-cause mortality was 1.37 (95% CI: 1.23–1.52; P<0.001), 3.92 (95% CI: 3.60–4.27; P<0.001), and 5.05 (95% CI: 4.60–5.55; P<0.001), respectively. In the patients with a combination of two risk factors, HR of all-cause mortality was 5.30 (95% CI: 4.72–5.95; P<0.001) for advanced age plus DM, 8.27 (95% CI: 7.66–8.94; P<0.001) for CKD plus advanced age, and 4.75 (95% CI: 4.39–5.15; P<0.001) for CKD plus DM. In elderly patients with DM and CKD, the HR of CV mortality was 8.59 (95% CI: 7.94–9.30; P<0.001) during the 3-year follow-up period.
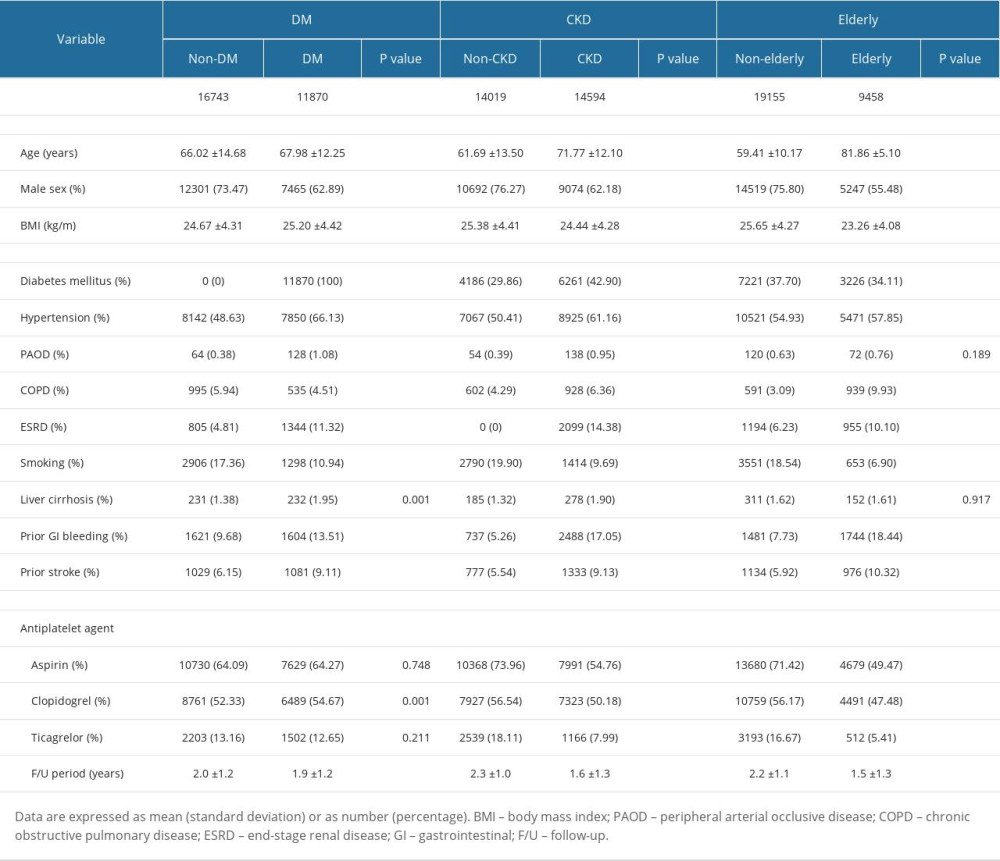
References
1. Collet JP, Thiele H, Barbato E, 2020 ESC Guidelines for the management of acute coronary syndromes in patients presenting without persistent ST-segment elevation: Eur Heart J, 2021; 42(14); 1289-367
2. Dai X, Busby-Whitehead J, Alexander KP, Acute coronary syndrome in the older adults: J Geriatr Cardiol, 2016; 13(2); 101-8
3. Constantinides SS, Gieowarsingh S, Halim M, Predictors of mortality in patients with acute coronary syndrome undergoing percutaneous coronary intervention: Heart, 2003; 89(10); 1245-46
4. Alexander KP, Roe MT, Chen AY, Evolution in cardiovascular care for elderly patients with non-ST-segment elevation acute coronary syndromes: Results from the CRUSADE National Quality Improvement Initiative: J Am Coll Cardiol, 2005; 46(8); 1479-87
5. Zaman MJ, Stirling S, Shepstone L, The association between older age and receipt of care and outcomes in patients with acute coronary syndromes: A cohort study of the Myocardial Ischaemia National Audit Project (MINAP): Eur Heart J, 2014; 35(23); 1551-58
6. Saada M, Kobo O, Polad J, Prognosis of PCI in AMI setting in the elderly population: Outcomes from the multicenter prospective e-ULTIMASTER registry: Clin Cardiol, 2022; 45(12); 1211-19
7. Granger CB, Goldberg RJ, Dabbous O, Predictors of hospital mortality in the global registry of acute coronary events: Arch Intern Med, 2003; 163(19); 2345-53
8. Zuhdi AS, Ahmad WA, Zaki RA, Acute coronary syndrome in the elderly: The Malaysian National Cardiovascular Disease Database-Acute Coronary Syndrome registry: Singapore Med J, 2016; 57(4); 191-97
9. Savonitto S, Morici N, Nozza A, Predictors of mortality in hospital survivors with type 2 diabetes mellitus and acute coronary syndromes: Diab Vasc Dis Res, 2018; 15(1); 14-23
10. Ismail SR, Khalil MKN, Mohamad MSF, Systematic review and meta-analysis of prognostic models in Southeast Asian populations with acute myocardial infarction: Front Cardiovasc Med, 2022; 9; 921044
11. Komiyama K, Nakamura M, Tanabe K, In-hospital mortality analysis of Japanese patients with acute coronary syndrome using the Tokyo CCU Network database: Applicability of the GRACE risk score: J Cardiol, 2018; 71(3); 251-58
12. Dégano IR, Subirana I, Fusco D, Percutaneous coronary intervention reduces mortality in myocardial infarction patients with comorbidities: Implications for elderly patients with diabetes or kidney disease: Int J Cardiol, 2017; 249; 83-89
13. Tsai MS, Lin MH, Lee CP, Chang Gung Research Database: A multi-institutional database consisting of original medical records: Biomed J, 2017; 40(5); 263-69
14. Shao SC, Chan YY, Kao Yang YH, The Chang Gung Research Database – a multi-institutional electronic medical records database for real-world epidemiological studies in Taiwan: Pharmacoepidemiol Drug Saf, 2019; 28(5); 593-600
15. Lee WC, Fang YN, Chen TY, The relationship of conduction disorder and prognosis in patients with acute coronary syndrome: Int J Clin Pract, 2022; 2022; 9676434
16. Lee WC, Tsai YH, Hsieh YY, Clinical outcomes based on the attainment of low-density lipoprotein cholesterol targets in patients with acute coronary syndrome in real-world practice: Int J Clin Pract, 2022; 2022; 2292379
17. Nikolsky E, Stone GW, Kirtane AJ, Gastrointestinal bleeding in patients with acute coronary syndromes: Incidence, predictors, and clinical implications: analysis from the ACUITY (Acute Catheterization and Urgent Intervention Triage Strategy) trial: J Am Coll Cardiol, 2009; 54(14); 1293-302
18. Ponniah JP, Shamsul AS, Adam BM, Predictors of mortality in patients with Acute Coronary Syndrome (ACS) undergoing Percutaneous Coronary Intervention (PCI): Insights from National Cardiovascular Disease Database (NCVD), Malaysia: Med J Malaysia, 2012; 67(6); 601-5
19. Pramudyo M, Yahya AF, Martanto E, Predictors of in-hospital mortality in patients with acute coronary syndrome in Hasan Sadikin Hospital, Bandung, Indonesia: A retrospective cohort study: Acta Med Indones, 2022; 54(3); 379-88
20. Franchi F, James SK, Ghukasyan Lakic TPLATO Investigators, Impact of diabetes mellitus and chronic kidney disease on cardiovascular outcomes and platelet P2Y12 receptor antagonist effects in patients with acute coronary syndromes: Insights from the PLATO trial: J Am Heart Assoc, 2019; 8(6); e011139
21. Mandelzweig L, Battler A, Boyko V, The second Euro Heart Survey on acute coronary syndromes: Characteristics, treatment, and outcome of patients with ACS in Europe and the Mediterranean Basin in 2004: Eur Heart J, 2006; 27(19); 2285-93
22. Jensen LO, Maeng M, Thayssen P, Influence of diabetes mellitus on clinical outcomes following primary percutaneous coronary intervention in patients with ST-segment elevation myocardial infarction: Am J Cardiol, 2012; 109(5); 629-35
23. Lee WC, Fang HY, Chen HC, Anemia: A significant cardiovascular mortality risk after ST-segment elevation myocardial infarction complicated by the comorbidities of hypertension and kidney disease: PLoS One, 2017; 12(7); e0180165
24. Chen HC, Lee WC, Fang HY, Impact of high triglyceride/high-density lipoprotein cholesterol ratio (insulin resistance) in ST-segment elevation myocardial infarction: Medicine (Baltimore), 2020; 99(43); e22848
25. Choi Y, Kang DY, Lee J, Ticagrelor versus clopidogrel in East Asian patients with acute coronary syndrome and diabetes mellitus: JACC Asia, 2022; 2(6); 666-74
26. Wong JA, Goodman SG, Yan RT, Temporal management patterns and outcomes of non-ST elevation acute coronary syndromes in patients with kidney dysfunction: Eur Heart J, 2009; 30(5); 549-57
27. Fox CS, Muntner P, Chen AY, Use of evidence-based therapies in short-term outcomes of ST-segment elevation myocardial infarction and non-ST-segment elevation myocardial infarction in patients with chronic kidney disease: A report from the National Cardiovascular Data Acute Coronary Treatment and Intervention Outcomes Network registry: Circulation, 2010; 121(3); 357-65
28. Morici N, De Servi S, Toso A, Renal function estimation and one-year mortality in elderly patients with non-ST-segment elevation acute coronary syndromes: Int J Cardiol, 2014; 174(1); 127-28
29. Ismail N, Jordan KP, Rao S, Incidence and prognostic impact of post discharge bleeding post acute coronary syndrome within an outpatient setting: A systematic review: BMJ Open, 2019; 9(2); e023337
30. Gangwani MK, Aziz M, Nawras A, Predictors of gastrointestinal bleeding in patients following left ventricular assist device implantation: A systematic review and meta-analysis: Future Cardiol, 2022; 18(12); 957-67
31. Graipe A, Ulvenstam A, Irevall AL, Incidence and predictors of serious bleeding during long-term follow-up after acute coronary syndrome in a population-based cohort study: Sci Rep, 2021; 11(1); 21967
32. Haffner SM, Lehto S, Rönnemaa T, Mortality from coronary heart disease in subjects with type 2 diabetes and in nondiabetic subjects with and without prior myocardial infarction: N Engl J Med, 1998; 339(4); 229-34
33. Juutilainen A, Lehto S, Rönnemaa T, Type 2 diabetes as a “coronary heart disease equivalent”: An 18-year prospective population-based study in Finnish subjects: Diabetes Care, 2005; 28(12); 2901-7
34. Yudi MB, Clark DJ, Farouque O, Trends and predictors of recurrent acute coronary syndrome hospitalizations and unplanned revascularization after index acute myocardial infarction treated with percutaneous coronary intervention: Am Heart J, 2019; 212; 134-43
35. Lee SH, Jeong MH, Ahn JH, Predictors of recurrent acute myocardial infarction despite successful percutaneous coronary intervention: Korean J Intern Med, 2022; 37(4); 777-85
Figures
Figure 1. Kaplan-Meier curve analysis and hazard ratios (HRs) for gastrointestinal (GI) bleeding in patients with acute coronary syndrome (ACS) and a combination of diabetes mellitus (DM), chronic kidney disease (CKD), or advanced age during the 3-year follow-up period. (A) Kaplan-Meier curve analysis for GI bleeding between the ACS population with DM, CKD, or advanced age, or the combination of 2 or 3 risk factors (log-rank P<0.001). (B) In patients with 1 risk factor (DM, CKD, or elderly age), the HR of GI bleeding was 1.87 (95% CI: 1.48–2.35; P<0.001), 3.39 (95% CI: 2.74–4.18; P<0.001), and 4.33 (95% CI: 3.42–5.50; P<0.001), respectively. In patients with a combination of 2 risk factors, the HR of GI bleeding was 6.83 (95% CI: 5.26–8.86; P<0.001) for elderly age plus DM, 3.39 (95% CI: 6.58–9.60; P<0.001) for CKD plus elderly age, 6.21 (95% CI: 5.17–7.45; P<0.001) for CKD plus DM. In elderly patients with DM and CKD, HR of GI bleeding was 11.32 (95% CI: 9.41–13.61; P<0.001) during the 3-year follow-up period.Figure 2. Kaplan-Meier curve analysis and hazard ratios (HRs) for recurrent acute coronary syndrome (ACS) in patients with ACS and a combination of diabetes mellitus (DM), or chronic kidney disease (CKD), or advanced age during the 3-year follow-up period. (A) Kaplan-Meier curve analysis for recurrent ACS between the ACS population with DM, CKD, or advanced age, or the combination of 2 or 3 risk factors (log-rank P<0.001). (B) In patients with 1 risk factor (DM, CKD, or advanced age), the HR of recurrent ACS was 1.13 (95% CI: 0.99–1.29; P=0.070), 1.63 (95% CI: 1.44–1.85; P<0.001), and 1.62 (95% CI: 1.38–1.91; P<0.001), respectively. In patients with a combination of 2 risk factors, the HR of recurrent ACS was 2.20 (95% CI: 1.81–2.67; P<0.001) for advanced age plus DM, 2.35 (95% CI: 2.08–2.66; P<0.001) for CKD plus advanced age, and 2.72 (95% CI: 2.45–3.03; P<0.001) for CKD plus DM. In elderly patients with DM and CKD, the HR of recurrent ACS was 2.99 (95% CI: 2.65–3.37; P<0.001) during the 3-year follow-up period.Figure 3. Kaplan-Meier curve analysis and hazard ratios (HRs) for cardiovascular (CV) mortality in patients with acute coronary syndrome (ACS) and a combination of diabetes mellitus (DM), or chronic kidney disease (CKD), or advanced age during the 3-year follow-up period. (A) Kaplan-Meier curve analysis for CV mortality between the ACS population with DM, CKD, or advanced age, or the combination of 2 or 3 risk factors (log-rank P<0.001). (B) In patients with 1 risk factor (DM, CKD, or advanced age), HR of CV mortality was 1.19 (95% CI: 1.00–1.42; P=0.057), 4.43 (95% CI: 3.88–5.05; P<0.001), and 4.47 (95% CI: 3.84–5.21; P<0.001), respectively. In patients with combination of two risk factors, HR of CV mortality was 4.53 (95% CI: 3.74–5.49; P<0.001) for advanced age plus DM, 8.76 (95% CI: 7.76–9.89; P<0.001) for CKD plus advanced age, and 4.17 (95% CI: 3.66–4.74; P<0.001) for CKD plus DM. In elderly patients with DM and CKD, HR of CV mortality was 7.29 (95% CI: 6.42–8.29; P<0.001) during the 3-year follow-up period.Figure 4. Kaplan-Meier curve analysis and hazard ratios (HRs) for all-cause mortality in patients with acute coronary syndrome (ACS) and a combination of diabetes mellitus (DM), or chronic kidney disease (CKD), or advanced age during the 3-year follow-up period. (A) Kaplan-Meier curve analysis for all-cause mortality between the ACS population with DM, CKD, or advanced age, or the combination of 2 or 3 risk factors (log-rank P<0.001). (B) In patients with 1 risk factor (DM, CKD, or advanced age), HR of all-cause mortality was 1.37 (95% CI: 1.23–1.52; P<0.001), 3.92 (95% CI: 3.60–4.27; P<0.001), and 5.05 (95% CI: 4.60–5.55; P<0.001), respectively. In the patients with a combination of two risk factors, HR of all-cause mortality was 5.30 (95% CI: 4.72–5.95; P<0.001) for advanced age plus DM, 8.27 (95% CI: 7.66–8.94; P<0.001) for CKD plus advanced age, and 4.75 (95% CI: 4.39–5.15; P<0.001) for CKD plus DM. In elderly patients with DM and CKD, the HR of CV mortality was 8.59 (95% CI: 7.94–9.30; P<0.001) during the 3-year follow-up period. In Press
Clinical Research
Effects of Single-Bout Endurance Exercise Intensity on Peripheral Neurotrophic Factors in Patients With Isc...Med Sci Monit In Press; DOI: 10.12659/MSM.952089
Review article
Anisodus tanguticus in Cancer Research: A Review of Traditional Use, Phytochemistry, Extraction Methods, an...Med Sci Monit In Press; DOI: 10.12659/MSM.952999
Clinical Research
Nasal Mucociliary Clearance and Its Relationship With Disease Severity in Patients With Multiple SclerosisMed Sci Monit In Press; DOI: 10.12659/MSM.952850
Clinical Research
Modified Thoracoabdominal Nerves Block Through the Perichondrial Approach vs Subcostal Transversus Abdomini...Med Sci Monit In Press; DOI: 10.12659/MSM.953976
Most Viewed Current Articles
17 Jan 2024 : Review article 14,176,570
Vaccination Guidelines for Pregnant Women: Addressing COVID-19 and the Omicron VariantDOI :10.12659/MSM.942799
Med Sci Monit 2024; 30:e942799
13 Nov 2021 : Clinical Research 3,762,188
Acceptance of COVID-19 Vaccination and Its Associated Factors Among Cancer Patients Attending the Oncology ...DOI :10.12659/MSM.932788
Med Sci Monit 2021; 27:e932788
14 Dec 2022 : Clinical Research 2,466,310
Prevalence and Variability of Allergen-Specific Immunoglobulin E in Patients with Elevated Tryptase LevelsDOI :10.12659/MSM.937990
Med Sci Monit 2022; 28:e937990
16 May 2023 : Clinical Research 708,927
Electrophysiological Testing for an Auditory Processing Disorder and Reading Performance in 54 School Stude...DOI :10.12659/MSM.940387
Med Sci Monit 2023; 29:e940387