10 March 2024: Database Analysis
Potential of Gut Microbial Metabolites in Treating Osteoporosis and Obesity: A Network Pharmacology and Bioinformatics Approach
Md. Niaj MorshedDOI: 10.12659/MSM.942899
Med Sci Monit 2024; 30:e942899


Abstract
BACKGROUND: The gut microbial metabolites demonstrate significant activity against metabolic diseases including osteoporosis (OP) and obesity, but active compounds, targets, and mechanisms have not been fully identified. Hence, the current investigation explored the mechanisms of active metabolites and targets against OP and obesity by using network pharmacology approaches.
MATERIAL AND METHODS: The gutMGene database was used to collect gut microbial targets-associated metabolites; DisGeNET and OMIM databases were used to identify targets relevant to OP and obesity. A total of 63 and 89 overlapped targets were considered the final OP and obesity targets after creating a Venn diagram of metabolites-related targets and disease-related targets. Furthermore, the top 20% of degrees, betweenness, and closeness were used to form the sub-network of protein–protein interaction of these targets. Finally, the biotransformation-increased receptors and biological mechanisms were identified and validated using ADMET properties analysis, molecular docking, and molecular dynamic simulation.
RESULTS: GO, KEGG pathway analysis, and protein–protein interactions were performed to establish metabolites and target networks. According to the enrichment analysis, OP and obesity are highly linked to the lipid and atherosclerosis pathways. Moreover, ADMET analysis depicts that the major metabolites have drug-likeliness activity and no or less toxicity. Following that, the molecular docking studies showed that compound K and TP53 target have a remarkable negative affinity (-8.0 kcal/mol) among all metabolites and targets for both diseases. Finally, the conformity of compound K against the targeted protein TP53 was validated by 250ns MD simulation.
CONCLUSIONS: Therefore, we summarized that compound K can regulate TP53 and could be developed as a therapy option for OP and obesity.
Keywords: Molecular Docking Simulation, Network Pharmacology, Obesity, Osteoporosis, Postmenopausal, Humans, Gastrointestinal Microbiome, Computational Biology, molecular dynamics simulation, Osteoporosis, Drugs, Chinese Herbal, Ginsenosides
Background
Osteoporosis (OP) is a cumulative metabolic bone disorder defined by loss of bone mass, bone microstructural damage, bone density reduction, bone fragility progression, and a greater chance of bone fracture [1]. In most OP cases, bone loss is caused by faster bone resorption than bone formation, thus disrupting the natural balance of bone development [2]. The prevalence of OP is increasing along with the aging of the population, which significantly impacts the health and quality of life of the elderly [3]. It affects more than 200 million people globally and results in 8.9 million fractures each year. In addition, OP affects more than 30% of postmenopausal women over the age of 50 [4]. OP can lead to bedsores, pneumonia, urinary tract infections, and even death [5]. OP develops during aging due to changes in the bone marrow composition that promote the presence of adipocytes, an increase in osteoclast activity, and a decrease in osteoblast function. Adiposity in the bone marrow is linked to secondary causes of OP, such as diabetes mellitus, obesity, and use of glucocorticoids [6]. OP can arise from irregular bone homeostasis, which is linked to obesity and chronic inflammation [7]. Recent studies have revealed that those who are obese have higher incidences of OP and bone fractures than those who are not obese [8]. Studies have shown that postmenopausal women with obesity have higher risk of OP fractures [9]. Some overlap between the environmental and genetic variables impact both diseases. The relationship between OP and obesity in terms of pathophysiology, epidemiology, and clinical studies has been extensively researched [10]. However, OP and obesity are frequently effectively untreated, because of the expense and adverse effects of approved medications, which highlights the urgent need for development of low-cost and safe therapies [11]. Therefore, safer and more successful therapeutic approaches are required for the treatment of OP and obesity.
The gut microbiota is a diverse and spontaneous population of living organisms (viruses, bacteria, and fungi) that inhabit the gastrointestinal systems [12]. A recent study found that metabolites produced by the gut microbiota may be effective in treating metabolic disorders, including OP and obesity, and reducing their harmful effects [13,14]. According to various studies, gut microbial metabolites act as regulators to maintain the host system’s energy balance [15]. Various studies have demonstrated that the gut microbiome (members of microbiota), along with other elements like nutrition, genetic predisposition, lifestyle, and medications, can enhance bone health and obesity conditions in healthy and diseased states [16]. The gut microbiota loses its protective properties when it is changed. Diminished α-diversity and decreased quantity of commensal bacteria are hallmarks of dysbiosis, a condition known as altered gut microbiota. Over the last 10 years, a growing body of research has revealed a connection between gut dysbiosis and many illnesses and conditions, such as obesity, metabolic syndrome, Parkinson disease, osteoporosis, autism spectrum disorder, inflammatory bowel disorders, type 2 diabetes, cancer, and cardiovascular and neurological diseases [17]. The gut microbiota carries out these functions by controlling the host’s numerous signaling pathways through a wide range of metabolites, including SCFA, D-amino acids, vitamins, and bacteriocins [18]. These byproducts of the gut microbe are a component of an enormous network with molecular pathways that cross over. Consequently, research focused on a single metabolite is essential to ascertain its significance for host physiology [19].
Based on these investigations, the present study used online resources to virtually identify gut metabolites and targets against OP and obesity. In silico technologies such as molecular docking and molecular dynamic simulation (MDS) are prominent instances of structure-based virtual screening methods that have been very beneficial in clarifying the interactions between biomolecules [20]. Furthermore, the development of numerous biological networks provides potential understanding to clarify complex pharmacological data, including microbial relationships, protein–protein interaction (PPI) network analysis, and topological analysis [21]. To identify the fundamental causes of complex disorders, biological network models can be used as a metaphor [22]. Network pharmacology is a comprehensive analytical approach to identify essential elements such as metabolites, target proteins, and diseases [23]. It can also reveal the mechanism of metabolites in the gut with disease-related target genes with a multifaceted concept [24]. Therefore, the objective of this research was to identify the hierarchical targets for managing OP and obesity using a network pharmacology and bioinformatics approach and to identify the most important gut microbial metabolites that can combat the co-morbidity of these 2 diseases. In addition, we described the key probiotics identified by the molecular docking test (MDT) and molecular dynamic simulation as the most stably bound metabolites on a key target. Therefore, by impacting intricate microbiome systems, our findings can help to reveal the potential of anti-OP and anti-obesity therapies.
Material and Methods
GUT MICROBIAL METABOLITES AND TARGETS ACQUISITION:
The gutMGene v1.0 database (http://bio-annotation.cn/gutmgene/) was used to retrieve the gut microbiota targets and metabolites [25] (accessed on 28 June 2023). A subfolder of the download section was used to identify the gut microbial metabolites. All metabolites were identified by PubChem (https://pubchem.ncbi.nlm.nih.gov/) using their Simplified Molecular Input Line Entry System (SMILES) forms. DisgeNET (https://www.disgenet.org/) [26] and OMIM (https://www.omim.org/) [27] databases were also utilized to retrieve OP and obesity-related targets (accessed on 29 June 2023). The online mapping tool Venny 2.1.0 (https://bioinfogp.cnb.csic.es/tools/venny/) was used to identify significant targets among the metabolites and selected disease-related targets. After that, we used the overlapped genes for further analysis.
GENES CHROMOSOMAL LOCATION AND TISSUE-ASSOCIATED GENES:
To understand the pathophysiology of these genes and to find the therapeutic targets, it is necessary to know the chromosomal location of certain genes, as common genes are distributed differently in different tissues. Thus, to identify tissue and cell-specific distribution of genes, we used the Pa-GenBase dataset via the Metascape web server (accessed on 30 June 2023) (https://metascape.org/gp/index.html#/main/) [28]. Furthermore, the ShinyGO web tool (http://bioinformatics.sdstate.edu/go/) [29] was used to determine the chromosomal position of genes (accessed on 30 June 2023).
ANALYSIS OF GENE ONTOLOGY (GO) AND KYOTO ENCYCLOPEDIA OF GENES AND GENOMES (KEGG) PATHWAY:
GO analysis was used to define the activities of targets, and consisted of molecular function (MF), biological function (BF), and cellular component (CC) analysis. The putative signaling pathways connected to the final targets against OP and obesity were clarified using the KEGG pathway analysis. The enrichment plots are based on the P value, and adj. P value was defined as the gene ratio expressed differentially to the total target number in a signaling pathway [30]. GO and KEGG enrichment analyses were performed using the EnrichR (https://maayanlab.cloud/Enrichr/) package with a P value <0.05 [31].
CONSTRUCTION OF THE PROTEIN–PROTEIN INTERACTION (PPI) NETWORK:
The initial phase of drug development involves analyzing protein interactions, which reveal a great deal about the function of proteins [32]. A comprehensive PPI network study estimates the aggregate amount of complex biological processes [33]. To investigate the molecular mechanisms associated with significant signaling pathways and cellular processes, the PPIs of common genes were determined by applying the STRING dataset through the NetworkAnalyst v3.0 (https://www.networkanalyst.ca/) [34]. The PPI network was generated with the basic PPI configuration H. sapiens as the organism, STRING with scientific proof as the database, and a confidence score cutoff of 900. Afterward, we evaluated the accuracy and concluded that the most likely hubs were the common nodes. Additionally, sub-PPI networks were constructed using the top 20% degree centrality (DC), betweenness centrality, and closeness centrality (CC) from the PPI networks via CytoNCA in Cytoscape version 3.7.2. [35].
PHYSIOCHEMICAL AND ADMET PROPERTIES ANALYSIS OF MICROBIAL COMPOUNDS:
In silico physiochemical assessment was performed on the identified compounds. The drug-likeness analysis was conducted on the SwissADME (http://www.swissadme.ch/index.php) [36], ADMETlab2.0 (https://admetmesh.scbdd.com/) [37], and pkCSM (https://biosig.lab.uq.edu.au/pkcsm/) [38] web servers, while the predicted toxicology properties were analyzed using the Protox-II webserver (https://tox-new.charite.de/protox_II/) [39]. The canonical SMILES of the metabolites were accessed from the PubChem Database to predict absorption, distribution, metabolism, excretion, and toxicity (ADMET) characteristics using the standard settings. Finally, we omitted the metabolites that violated more than 2 rules from Lipinski’s rule of 5 (LO5) and protein targets related to those metabolites. The remaining targets and metabolites were used for further investigations.
VALIDATION OF THE EXPRESSION OF THE HUB TARGETS:
The objective of the Human Protein Atlas database (HPA) (https://www.proteinatlas.org/) [40] is to provide information on the distribution and expression of various human proteins in different tissues. Also, the HPA database was developed to map every human protein found in cells, tissues, and organs by combining many omic technologies [41]. Here, we explored the expression levels of hub targets in the bone marrow and adipose tissues based on the HPA database.
PROTEIN AND LIGANDS PREPARATION:
The crystal structures of HMOX1 (PDB: 1N3U), AKT1 (PDB: 3O96), MAPK3 (PDB: 2ZOQ), MAPK1 (PDB: 4QP6), MAPK8 (PDB: 5LW1), NFKB1 (PDB: 3GUT), TP53 (PDB: 1C26), PIK3CA (PDB: 5SXK), G6PD (PDB: 7SNF), and IL18 (PDB: 3WO4) were retrieved from the RCSB protein data bank (https://www.rcsb.org/, accessed on 11 July 2023) [42]. Cofactors, water, and metal ions from the complex structure were removed to prepare proteins. Gasteiger charges for the protein were calculated after the non-polar hydrogen atoms were merged and polar hydrogen atoms were added [43]. Utilizing AutoDock Tools, the non-polar hydrogens were merged, aromatic carbons were found, and the ‘torsion tree’ of the molecules was configured. These results were obtained in PDBQT format for further screening. Additionally, the PubChem Database was used to retrieve the 3D structures of the active ingredients (https://pubchem.ncbi.nlm.nih.gov/) [44]. The download format was an SDF file.
BINDING SITE IDENTIFICATION AND GRID BOX GENERATION:
Analysis of comparable pockets from known protein–ligand interactions can identify binding sites. The known and unknown active sites of protein structures were retrieved by PDB and CASTp (
MOLECULAR DOCKING SIMULATION:
Using the PyRx tool, a molecular docking simulation was carried out to determine the best-fit candidates against target proteins [45]. PyRx is a freely available computational screening program including both AutoDock Vina and AutoDock 4 as a docking wizard that can analyze a sizable dataset against a particular biological targeted macromolecule. The AutoDock Vina Wizard was used through PyRx as the default parameter to simulate molecular docking. The top compounds have the highest binding affinity (kcal/mol) to the desired protein compared to the control. Finally, the receptor grids were generated following the default setup.
MOLECULAR DYNAMICS SIMULATION:
The intricate configuration of the selected potential compound was assessed by using 250-nanoseconds MD simulation to determine their ability to bind to the target protein and its active site cavity [46]. To assess the thermodynamic integrity of receptor-ligand interactions, the dynamic simulation of that interaction was carried out using “Desmond v6.3 Program” in Schrödinger 2023–3 under the Linux platform [47]. An orthorhombic periodic boundary box with a spacing of 10 Å assigned to both sides was utilized to keep a particular volume to solve the system using a predefined TIP3P water model. The system was neutralized using both sodium and chlorine ions to achieve a 0.15 M molar concentration of salt. The 9 Cl− and 11 Na+ ions were being neutralized. Following the construction of the solvated system with the protein in association with the binding ligand, the system was reduced and relaxed with the help of the default protocol that was added to the Desmond module using the force field parameters of OPLS_2005. NPT ensemble was maintained at 310 K with a single standard pressure (1.01325 bar) using the Nose-Hoover (NH) thermal coupling with isotropic scaling approach. We then employed 250 PS recording frequencies with an energy of 1.2. It has been observed that the highest temperatures of Newtonian and non-Newtonian blood fluids are 310.0045 K and 310.007 K, respectively [48]. Therefore, a temperature of 310 k has the greatest effect on the system [49]. The total number of atoms was calculated as 10 340.
All MD simulation snapshots were created with Maestro v-12.5. Based on the 250 ns trajectory performance, the stability of the complex structure was assessed using the RMSD (root-mean-square deviation), RMSF (root-mean-square fluctuation), ROG (radius of gyration), SASA (solvent-accessible surface area), P-L contact (protein–ligand contacts), and hydrogen bond interaction using the simulation interaction diagram (SID) of Desmond module v6.3.
MM-GSBA INVESTIGATION FROM THE TRAJECTORY OF POST-MOLECULAR DYNAMIC SIMULATION:
“Molecular biomechanics generalized Born surface area” (MM-GBSA) approaches have gained popularity for determining the ability to bind the free energy of ligands to macromolecules [50]. Using the Maestro program included in Schrödinger (Release 2020–3), the MM-GBSA was utilized to compute the bound-free energy for the compounds using default values. Overall methods are revealed in the graphical abstract (Figure 1).
Results
RETRIEVE METABOLITES AND POTENTIAL TARGET PROTEINS LINKED WITH OP AND OBESITY:
We obtained microbes, substrates, 39 metabolites, and metabolites regulated 168 targets from the gutMGene microbiome database. A total of 1426 and 3827 target genes for OP and obesity, respectively, were retrieved from DisgeNET and OMIM. The revealed targets and compounds were regarded to be important factors in analyzing the treatment outcomes of gut microbiota. After that, 63 and 89 overlapped targets related to OP and obesity, respectively, were identified in a Venn diagram (Figure 2A). Therefore, these selective targets were used for further analysis.
TISSUE- AND CELL-SPECIFIC DISTRIBUTION AND LOCATION OF GENES IN CHROMOSOMES:
Identifying a protein at the transcription level requires understanding the genes’ precise cellular and molecular locations, as shown in (Figure 2B, 2C). Most of the genes related to OP (8) were expressed in the lung, while the smallest number of genes (3) were expressed in the bone marrow. Furthermore, obesity-related genes (7) were expressed in the lung, and a significant number of genes were found in the bone marrow and adipose tissue, with a small number of genes (2) present in adipocytes (Figure 2B). Additionally, in the analysis of the Osteoporotic gene, most of the common genes (5) were found on chromosomes 1, 2, and 5, with 4 genes on chromosomes 3, 4, 5, 9, and 17. Chromosomes are uniformly dispersed across the genome, except 8, 13, and Y. Additionally, 7 of the genes common associated with obesity were discovered on chromosomes 11 and 19, while 6 genes were discovered on chromosomes 2, 5, 6, 7, and 12. Except for 8, 13, and Y chromosomes, the rest were evenly distributed throughout the genome. Shared genes were also missing (Figure 2C).
BIO-FUNCTION ANALYSIS OF TARGETS:
To further investigate the potential mechanism of the genes for OP and obesity, GO and KEGG enrichment analyses were conducted based on 63 and 89 targets, respectively. We found these genes were enriched in 1275 BP terms, 112 MF terms, and 37 CC terms for OP and 1210 BP terms, 110 MF terms and, 35 CC terms for obesity (P<0.05), and to the p 10 entries of BP, MF, and CC are shown in Figure 3A, 3B for both diseases. In the case of OP and obesity, BP analysis showed that associated targets were primarily centered on cytokine-mediated signaling pathways and cellular response to cytokine stimulus, according to MF analysis, potential OP targets were mainly focused on receptor-ligand activity, transcription factor activity, transcription cis-regulatory region binding, RNA polymerase II-specific DNA-binding transcription factor binding, and cytokines activity. CC analysis indicated that related targets were mainly centered on intracellular membrane-bounded organelles and nuclei.
KEGG enrichment analysis was performed to investigate the representative signaling pathways associated with the key targets. The results showed that 78 significantly enriched signaling pathways for OP and 95 signaling pathways for obesity were retrieved (P<0.05). The top 30 significantly enriched signaling pathways closely correlated with OP and obesity are shown in Figure 3C, 3D. Furthermore, enrichment analysis exhibited that lipid and atherosclerosis, AGE-RAGE signaling pathway, atherosclerosis, TNF signaling pathway, Non-alcoholic fatty liver disease, and osteoclast differentiation were most closely related to OP. Similarly, lipid and atherosclerosis, AGE-RAGE signaling pathway, atherosclerosis, PI3K-Akt signaling pathway, and Non-alcoholic fatty liver disease were linked to obesity in these enriched pathways, and the expected targets were connected to these signaling pathways.
PROTEIN–PROTEIN INTERACTION NETWORK:
In PPI networks, ADRA2B among the OP-related targets and ALPI, ADRA2B, and PEMT among the obesity-related targets did not interact with other targets consisting of 63 nodes, 710 edges, and 89 nodes, 962 edges, respectively (Figure 4A). The top 20% of degree centrality (DC), which includes 324 nodes, 2156 edges, and 319 nodes, 3562 edges, were chosen to create the sub-networks of targets associated with OP and obesity. Next to DC, screening the top 20% in terms of betweenness centrality of the sub-network comprised 65 nodes, 481 edges, and 64 nodes, 730 edges in OP and obesity, respectively. After that, the remaining targets were analyzed in the top 20% in terms of closeness centrality (CC) comprising 13 nodes, 56 edges, and 13 nodes, and 77 edges for OP and obesity, respectively. Finally, we obtained 13 targets related to OP and 13 targets related to obesity according to the top DC, BC, and CC values (Figure 4B; Table 1).
PHYSIOCHEMICAL AND ADMET PROPERTIES ANALYSIS OF LEADS COMPOUNDS:
After PPI networks, we retrieved 13 hub-targets for OP and another 13 hub-targets for obesity that can be regulated by gut microbial metabolites (Table 2). These targets-regulated metabolites were considered to analyze physiochemical and absorption, distribution, metabolism, excretion, and toxicity (ADMET) properties. We found that all metabolites except vancomycin and butyrate presented several desirable physicochemical properties. As per the Lipinski rules of 5 (LO5), an orally administrated drug must have HBA ≤10, log P≤5, HBD≤5, and molecular weight (MW) <500 Daltons [51]. However, out of these metabolites, vancomycin does not follow the LO5 rules and butyrate violates 2 rules of LO5; therefore, we omitted vancomycin, butyrate, and their related targets (LEP, MAPK14, JUN, HDAC1, and CHGA). Finally, 14 metabolites with 0 violations and 1 metabolite with 2 violations were selected. In ADMET analysis, we found all these metabolites maintained the standard ranges of several parameters. Also, these metabolites were non-toxic or less toxic in different toxicity parameters. Among them, Table 3 exhibits the ADMET properties of 6 key gut microbial metabolites that can follow the drug-likeliness properties.
EXPLORATION OF THE EXPRESSION OF HUB-TARGETS:
After ADMET analysis, we found 15 metabolites and metabolite-related targets. To analyze the functions of these targets in OP and obesity, we first detected the expression of targets in the HPA database. The results indicated that HMOX1, AKT1, MAPK3, MAPK1, NFKB1, TP53, PIK3CA, MAPK8 were expressed in the bone marrow and HMOX1, MAPK3, G6PD, MAPK1, NFKB1, IL18, TP53, MAPK8 were expressed in adipocytes. Although EGFR was a hub target related to OP, it did not express in the bone marrow. Similarly, GHRL and IL22 targets slightly expressed or did not express in adipocytes. Thus, we omitted these unexpressed proteins and their related metabolites (Figure 5A, 5B). Finally, we found 14 metabolites, 8 hub-targets in OP (HMOX1, AKT1, MAPK3, MAPK1, NFKB1, TP53, PIK3CA, and MAPK8), and 8 hub-targets in obesity (HMOX1, MAPK3, G6PD, MAPK1, NFKB1, IL18, TP53, and MAPK8) were selected for further analysis.
BIOACTIVE COMPOUND–TARGET MOLECULAR DOCKING:
The molecular-level interactions of the above-mentioned targets related to OP and obesity with microbial metabolites were analyzed using molecular docking. Estrogen (for OP) and Rosiglitazone (for obesity) were employed as a control, and the crucial active site residues were maintained flexibly. The establishment of hydrogen bonds and the binding energy to the essential active residues and ligands served as confirmation of the interaction results. We treated the highly expressed 8 targets in bone marrow and adipocytes (see the Exploration of the expression of hub-targets section) in molecular docking for both OP and obesity. Table 4 contains information on the selected targets with ligands, binding affinity, grid box dimensions, and center features. We determined the binding energy of the components to the receptor protein. Among all the molecular docking results, the maximum binding energy was −3.3 kcal/mol for OP and −3.4 kcal/mol for obesity. On the other hand, the minimum binding energy was −8 kcal/mol for both diseases. After analyzing the binding affinity, we obtained 3 targets (AKT1, TP53, and MAPK8) for OP and 5 targets (HMOX1, IL18, TP53, MAPK8, G6PD) for obesity, because of their strong binding affinity compared to control drugs. When a large molecule interacts with a small ligand, the lower binding energies signify more stable bindings. In addition, by comparing the docking result, we found that indole, Compound K, Urolithin A, genipin (for OP) and 10-oxo-11-octadecenoic acid, Equol, Compound K, Urolithin A, and genipin (for obesity) had lower binding energies and better stability than the control ligands. The results were visualized using Discovery Studio.
Figure 6 shows the 3D interaction modes of metabolites with OP proteins: Indole interacts with AKT1 via the residues THR211 (hydrogen bond), and SER205, LEU210, and LEU264 (other bonds), which showed binding affinity −5.8 kcal/mol that was more stable than control interaction (Figure 6A, 6B). TP53 interacts with Compound K and Urolithin A where Compound K-TP53 interaction depicted binding affinity −8 kcal/mol with PHE328, ILE332, RSN345 (hydrogen bonds), and PHE338 by another bond. Following that, Urolithin A-TP53 interaction exhibited binding affinity −6 kcal/mol with an ARG335 (hydrogen bond) and ILE332, PHE338 (other bonds) where no hydrogen bond in control interaction (Figure 6C–6E). Moreover, MAPK8-genipin interacts through 2 hydrogen bond residues (GLN37 and ARG69) and 3 other bonds (ALA36, ASP151, and VAL186) that showed binding affinity −7.2 kcal/mol where the control interaction showed −6.8 kcal/mol via a hydrogen bond (MET111) and 4 other bonds (VAL40, LYS55, MET108, and LEU168) (Figure 6F, 6G).
Figure 7 shows the 3D interaction modes of metabolites with obesity-connected receptors. 10-Oxo-11-octadecenoic acid interacts with HMOX1 via the residues ARG136 (hydrogen bond) and HIS25, ALA28, PHE37, VAL50, LEU54, LEU147, PHE167, and PHE207 (other bonds), and showed binding affinity −6.6 kcal/mol, which was lower than the control interaction (Figure 7A, 7B). IL18 interacts with Equol and Indole where Equol showed better binding affinity (−5.1 kcal/mol) than Indole (−4 kcal/mol) compared to control interaction (−5.1 kcal/mol) (Figure 7C–7E). TP53 interacts with Compound K and urolithin A where Compound K-TP53 interaction showed binding affinity −8 kcal/mol with 3 hydrogen bonds (PHE328, ILE332, and ASN345), and another bond. Following that, Urolithin A-TP53 interaction exhibited binding affinity −6 kcal/mol with ARG335 (hydrogen bond), ILE332, and PHE338 (other bonds), where the GLY334 hydrogen bond is the control interaction, which was −5.9 kcal/mol (Figure 7F–7H). Furthermore, MAPK8-genipin interacts through 2 hydrogen bond residues (GLN37 and ARG69) and 3 other bonds (ALA36, ASP151, and VAL186) that showed binding affinity −7.2 kcal/mol, where the control interaction showed −6.4 kcal/mol via ARG69, LYS163 (2 hydrogen bonds) and LEU330, ILE332, PHE338 (3 other bonds) (Figure 7I, 7J). Finally, G6PD protein interacts with Urolithin A exhibited −7.7 kcal/mol with Leu140, TYR147 (2 hydrogen bonds) and LEU43, ARG246, TYR249 (3 other bonds) that interaction was more stable and had less binding affinity than the control (−7.4 kcal/mol) (Figure 7K, 7L). Our results suggested that TP53 and compound K have the best binding affinity (−8 kcal/mol) among all protein–ligand interactions. Therefore, further dynamic simulation was conducted using the compound K-TP53 protein–ligand complex.
STABILITY OF PROTEIN–LIGAND: To test the stability of the protein structure throughout a 250 ns simulation time frame, the root mean square deviations (RMSDs) of Cα atoms were calculated for the compound K and TP53 protein complexes. After 145 ns, the protein–ligand showed significant stability and the average fluctuation rate was very low (1.11 Å). During the 250-ns simulation period, the values of the average, maximum, and lowest RMSD were discovered to be 5.242 Å, 8.426 Å, and 1.162 Å, respectively (Figure 8A).
Protein structural fluctuations in amino acid (AA) residues are indicated by root mean square fluctuation (RMSF). The degree of fluctuation and stability of amino acid residues in a complex system is determined by their high RMSF value. The complex was exhibiting the stability confirmation by RMSF value. During the simulating period, the average, lowest, and highest of RMSF were 2.391 Å, 0.991 Å, and 6.23 Å, respectively (Figure 8B).
In addition, the radius of gyration (ROG), solvent-accessible surface area [49], and hydrogen bond (H-Bond) were analyzed for the protein–ligand complex. The ROG and SASA showed good stability and their results were the opposite. The average ROG and SASA values were 5.898 Å2 and 676.78 Å2, respectively (Figure 8C, 8D). The number of hydrogen bonds in the protein–ligand can help to represent it, which has a big impact on binding and adsorption. Therefore, the lowest and highest number of hydrogen bonds are 1 and 4, respectively (Figure 8E). The ROG, SASA, and hydrogen bond results are confirmation of the stability of compound K and TP53 complex.
MM-GBSA ANALYSIS FROM POST-MOLECULAR DYNAMIC SIMULATION TRAJECTORY: In this investigation, MM/GBSA methods were employed to calculate the ligand-binding energy free of charge to the required protein. The MM/GBSA of the protein–ligand complex structure was computed using snapshots of the DM simulation trajectory (250 ns). The complex structure analysis revealed the higher net negative binding free energy values of −54.64 kcal/mol at 225 ns and an average net negative binding free energy value of −33.89 kcal/mol during 250-ns simulation time (Figure 8F). As a result, compound K may be able to sustain a long-term association with the targeted TP53 protein. Table 5 shows that the values of ΔGbind coulomb, covalent, H-bond, lipophilicity, packing, self-contact, and vdW were significantly more stable.
PROTEIN–LIGAND CONTACT ANALYSIS:
The complex structure of the interaction between the protein and the ligand was examined (Figure 9). These characteristics include hydrogen bonds, non-covalent bonds (hydrophobic bonds), ionic bonds, and water bridge bonds. The interaction fraction (IF) values of 0.4, 0.35, 0.3, 0.28, 0.20, 0.17, and 0.15 with interacting residues ASN345, GLU349, PHE328, PHE341, THR329, LEU348, and TYR 327, respectively, during 250-ns simulation. The hydrogen-interacting residues were ASN345, GLU349, THR 329, GLU 326, GLN 331, TYR327, GLY325, GLU346, ASP352, and GLN354.
Discussion
In this study, we analyzed metabolites and disease-related targets to find the microbiome-substrates-metabolites and diseases network. We found that
Our research offers vital insights into the systemic interactions among OP, obesity, and the microbiome, which is an important and reliable technique to elucidate the roles of putative bioactive compounds at the systemic level. According to the network study, after performing GO and KEGG pathway analyses, as well as PPI network analysis, we found 13 key targets related to OP and 13 key targets related to obesity. However, according to ADMET properties analysis of gut metabolites, we omitted some metabolites that violet LO5 and their related targets. Following that 8 hub-targets for OP (HMOX1, AKT1, MAPK3, MAPK1, NFKB1, TP53, PIK3CA, and MAPK8) and 8 hub-targets for obesity (HMOX1, MAPK3, G6PD, MAPK1, NFKB1, IL18, TP53, and MAPK8) were chosen for future investigation. We performed MDT and found that OP hub target interacts with different compounds (such as AKT1 with indole, TP53 with urolithin A and compound K, MAPK8 with genipin, HMOX with 10-Oxo-11-octadecenoic acid, MAPK1 with succinate, MAPK3 with succinate, NFKB1 with 3-indole propionic acid, and PIK3CA with indole). Moreover, in the case of obesity hub targets, we also found it interacts with different compounds by MDT, such as HMOX1 with 10-Oxo-11-octadecenoic acid, IL18 with equol, TP53 with urolithin A and compound K, MAPK8 with genipin and G6PD with urolithin A. By analyzing the MDT data, we found that compound K and TP53 showed higher negative binding affinity compared to others bonds, even the controls, for both diseases. Additionally, MD simulation confirmed the integrity of a protein in an interaction with a ligand [55]. According to MD simulation, the compound K showed strongly stable RMSD and RMSF values. The center of mass estimated for ROG determined using the protein C and N terminal examines the integrity of the structure of the protein and provides a deeper comprehension of protein folding features [56]. The lower ROG value indicates great compactness, whereas the higher value indicates disengagement of the substances from the protein. It has been shown that compound K has a higher ROG value. The higher the SASA value, the less stable the structure, while the lower value implies a tightly condensed combination of molecules of water and amino acid residues [57], as compound K showed a strong SASA value.
TP53 is a member of the transcription factors known as the “p53 gene family,” which also consists of proteins called p63, p73, and p53. P53 inhibits the MSCs’ differentiation processes. By down-regulating the expression levels of important transcription factor genes, P53 can adversely influence the differentiation of mesenchymal progenitor cells, including osteogenesis, myogenesis, adipogenesis, and neurogenesis pathways. Important transcription factor genes involved in the early stages of differentiation, such as Runx2 and Osterix for osteogenesis, PPAR-γ, CEBP-α for adipogenesis, Rb for myogenesis, and PTEN for neurogenesis, are maintained at reduced expression levels in undifferentiated MSCs due to p53. The P53 status has a significant impact on MSC commitment, differentiation, maturation, and proliferation. Wang et al showed that P53-deficient mice exhibit osteosclerotic trait because of the net outcome of increased bone production and higher bone resorption. P53-deprived osteoblasts show higher osteoclastogenic activity, improved differentiation, and faster proliferation. Raising the expression of osterix can lead to enhanced differentiation, and raising M-CSF expression, which is also triggered by raised osterix, can lead to improved osteoclastogenesis. These results suggest that p53 expresses osteoblast-specific transcription factor osterix to regulate bone remodeling [58].
According to a recent study by Molchadsky et al, p53 is a positive regulating factor that preserves appropriate brown adipocyte differentiation in vitro and inhibits the accumulation of obesity in a mouse model due to a high-fat diet. Myogenic C2 cells overexpressing p53 in the PR-domain includes 16 (PRDM16) decreased the expression of functional brown marker genes, including ELOVL fatty acid elongase 3 (Elovl3), cell death-inducing DFFA-like effector a (Cidea), and general adipogenic genes aP2. Furthermore, oil red O staining data provide credence to the theory that p53 is necessary for brown adipocyte growth [59]. According to research by Hallenborg et al, depleting p53 in mice prevented them from becoming obese due to a high-fat diet [60]. When p53 was lost, MEF cells generated from p53 mutant mice expressed more Ucp1 and Pgc-1α and Pgc-1β had higher transcriptional activity. Crucially, they also demonstrated that p53 mutant-expressing brown adipocytes more closely resembled beige adipocytes and that BATs from the p53 mutant mice differed phenotypically from normal BAT. Overall, p53 KO animals on a high-fat diet gain less body weight than their WT littermates, which is consistent with these results. Conditional genetic p53 mutation in BAT did not alter thermogenic activity or body weight gain. Compared to previous studies, this intriguing study revealed contentious phenotypes in mice models fed a high-fat diet; yet, the statement also suggested that p53 is essential for the development of brown adipocytes [61]. Interestingly, Zhang et al found that CK can promote P53 to regulate apoptosis and cell cycle arrest in vitro and in vivo [62]. CK significantly up-regulates the TP53 expression in different disease states, including colon cancer [63], breast cancer [64], and lung cancer [65]. Evidence suggests that TP53 might be inhibited by CK in case of OP and obesity.
Conclusions
Overall, this research offers significant new understandings of the biological activity, possible interaction targets, and mechanism of action of gut microbial metabolites against OP and obesity. Additionally, it gives researchers a theoretical foundation for investigating microbial metabolite function and associated mechanisms in the management of OP and obesity. Our findings could be useful in the creation of microbial metabolites-based medications or dietary supplements that prevent OP and obesity. To provide more scientific support for the clinical use of CK in the treatment of OP and obesity, we will carry out animal and clinical research in the future to validate the screening targets derived from this prediction analysis.
Availability of Data and Materials
The datasets are publicly available-Acquisition of gut microbial metabolites: gutMGene v1.0 database (http://bio-annotation.cn/gutmgene/); core targets of osteoporosis and obesity: DisgeNET (https://www.disgenet.org/) and OMIM (https://www.omim.org/); Online mapping tool: Venny 2.1.0 (https://bioinfogp.cnb.csic.es/tools/venny/); chromosomal position of genes: ShinyGO (http://bioinformatics.sdstate.edu/go/); cell-specific distribution of genes: Metascape (https://metascape.org/gp/index.html#/main/); GO and KEGG enrichment analysis: EnrichR (https://maayanlab.cloud/Enrichr/); Protein–Protein Interaction (PPI) network: NetworkAnalyst v3.0 (https://www.networkanalyst.ca/); Construction of sub-PPI networks: CytoNCA in Cytoscape version 3.7.2; Physiochemical and ADMET properties analysis: SwissADME (http://www.swissadme.ch/index.php), ADMETlab2.0 (https://admetmesh.scbdd.com/), pkCSM (https://biosig.lab.uq.edu.au/pkcsm/), and Protox-II webserver (https://tox-new.charite.de/protox_II/); Expression of the Hub-Targets: Human Protein Atlas database (HPA) (https://www.proteinatlas.org/); Crystal structure of protein: protein data bank (https://www.rcsb.org/); 3D structures of metabolites: Pubchem (https://pubchem.ncbi.nlm.nih.gov/); Molecular docking simulation: CASTp (http://sts.bioe.uic.edu/castp/), BIOVIA Discovery Studio Visualizer v19.1 (BIOVIA), AutoDock Vina Wizard via PyRx, Schrödinger suits 2023–3.
Figures
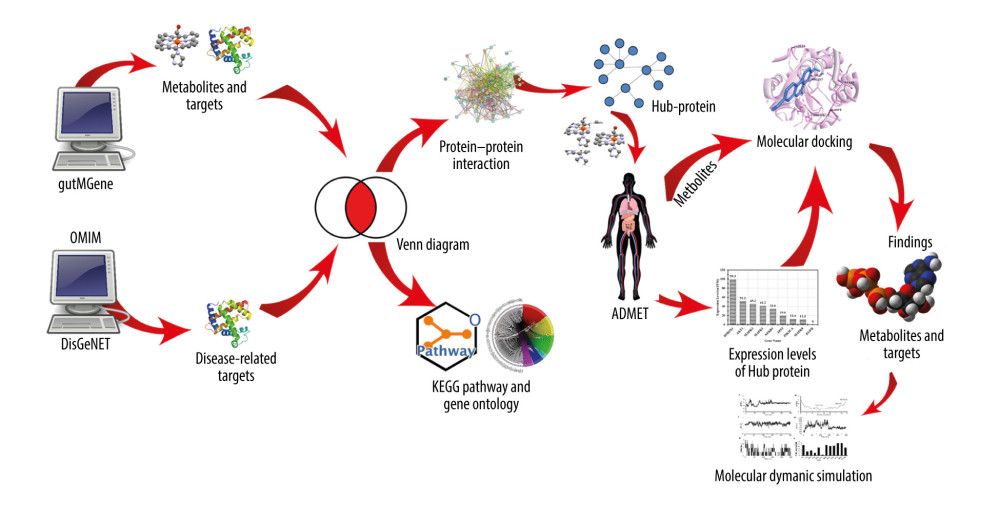 Figure 1. Graphical abstract.
 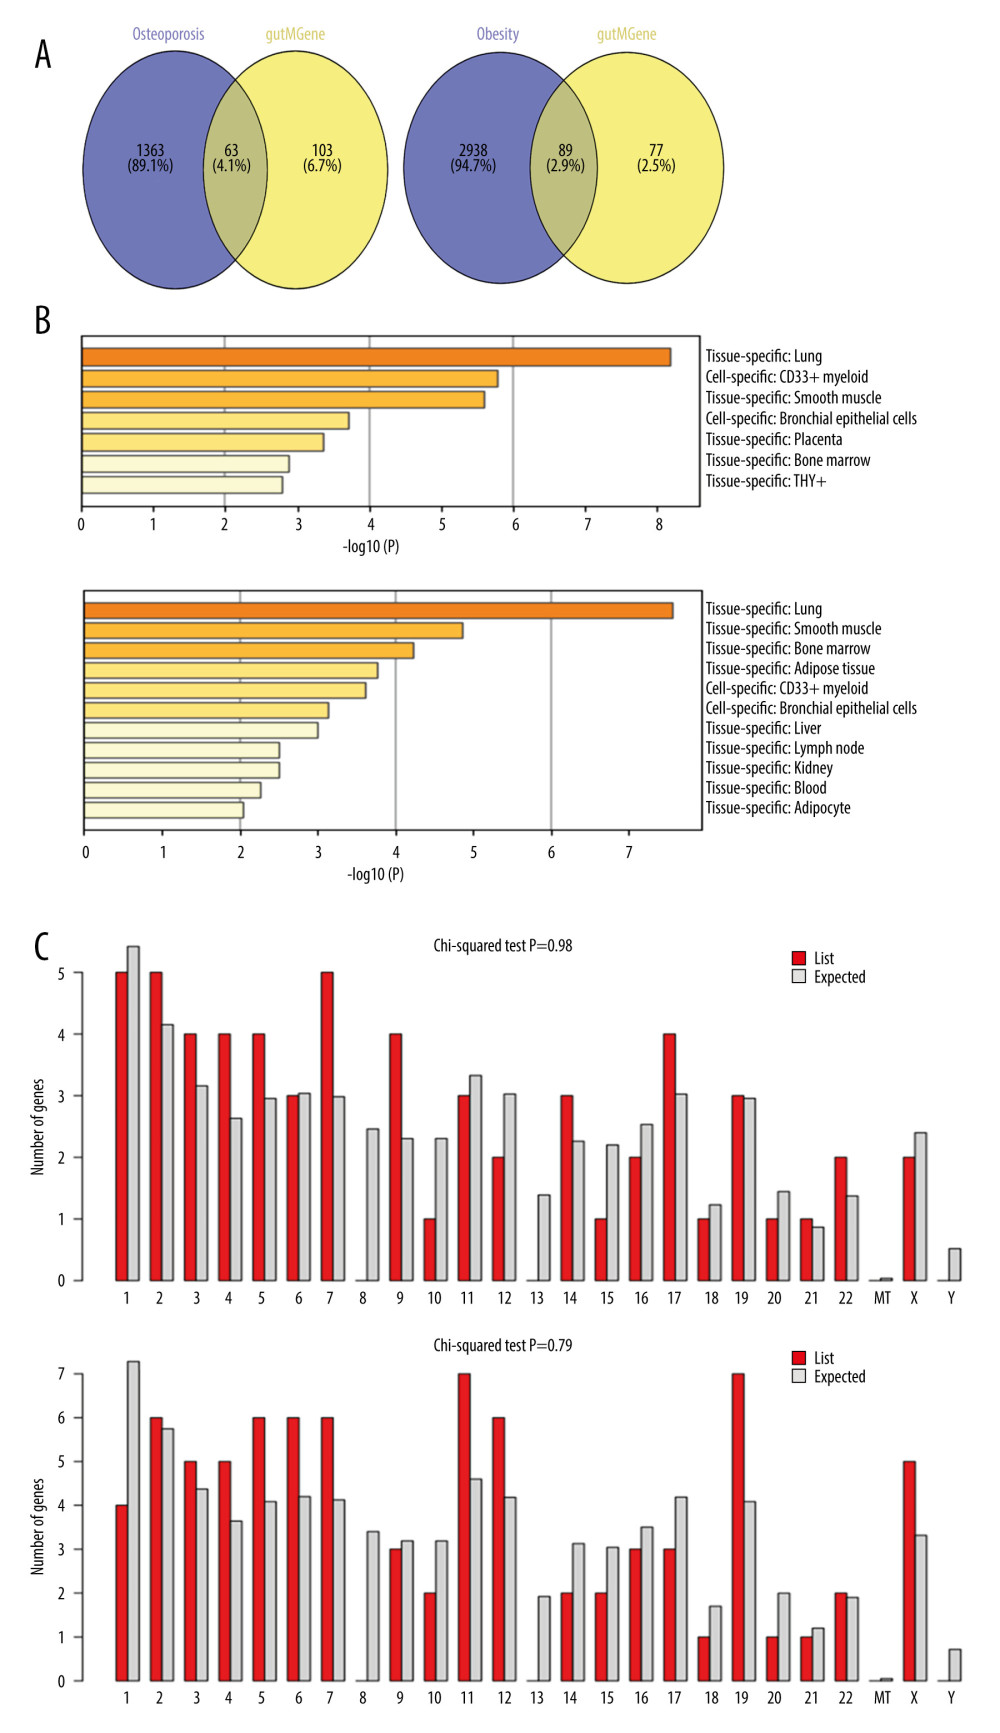 Figure 2. (A) Venn diagram between metabolites and disease-related targets. (B) Tissue and cell-specific distribution of genes. Pa-GenBase dataset via the Metascape web server was used to generate the figure. (C) Chromosomal location of genes. The ShinyGO web tool was used to determine the chromosomal position of genes.
 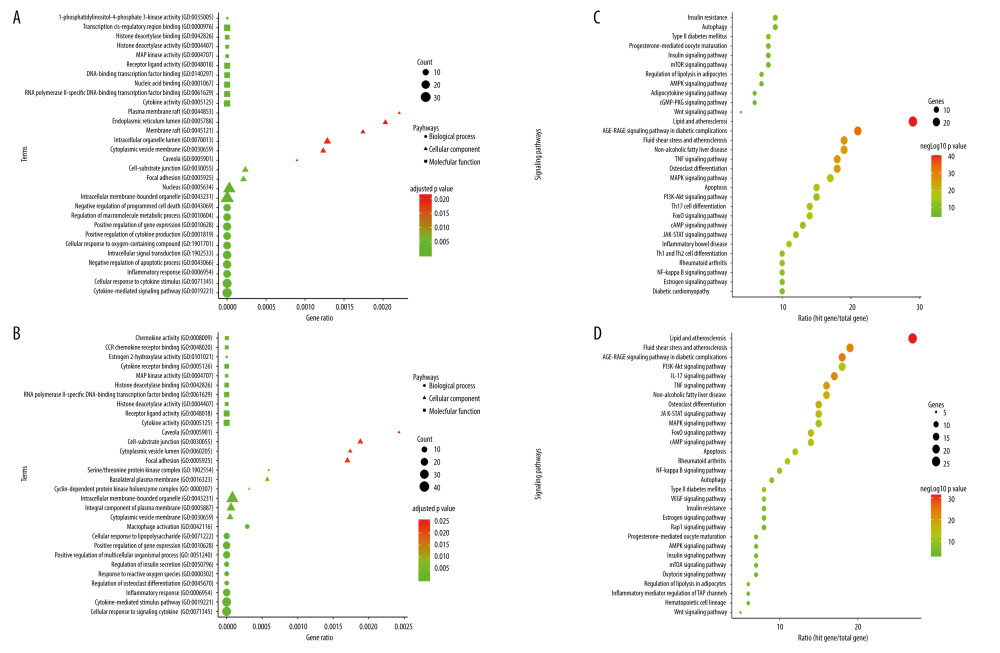 Figure 3. (A) The biological processes, cellular components, and molecular function identified in the Gene Ontology enrichment analysis of OP targets. (B) The biological processes, cellular components, and molecular function identified in the Gene Ontology enrichment analysis of Obesity targets. (C) Kyoto Encyclopedia of Genes and Genomes pathways identified in the enrichment analysis of OP targets. (D) Kyoto Encyclopedia of Genes and Genomes pathways identified in the enrichment analysis of Obesity-target. GO and KEGG enrichment analysis was performed using EnrichR.
 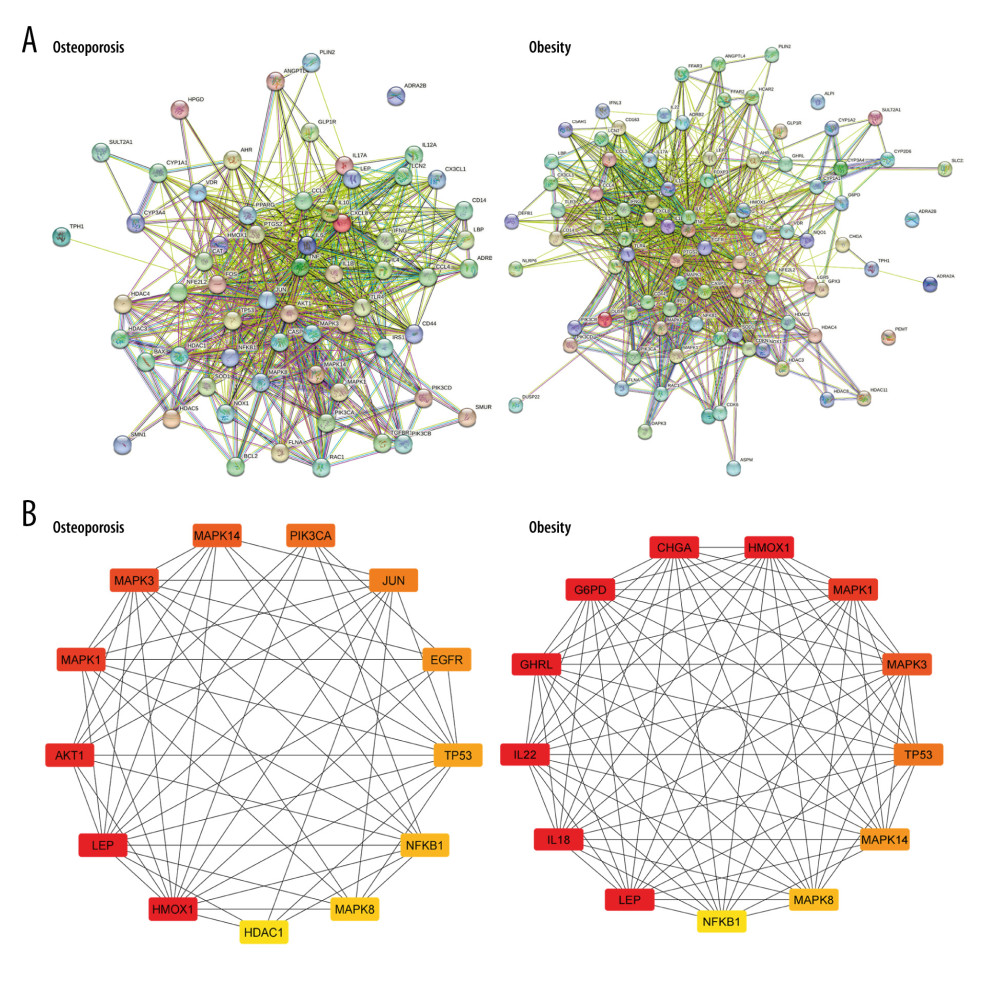 Figure 4. (A) Identification of Hub proteins. (B, C) PPI network of Hub proteins (the nodes represent proteins, and the edges represent protein–protein interactions).
 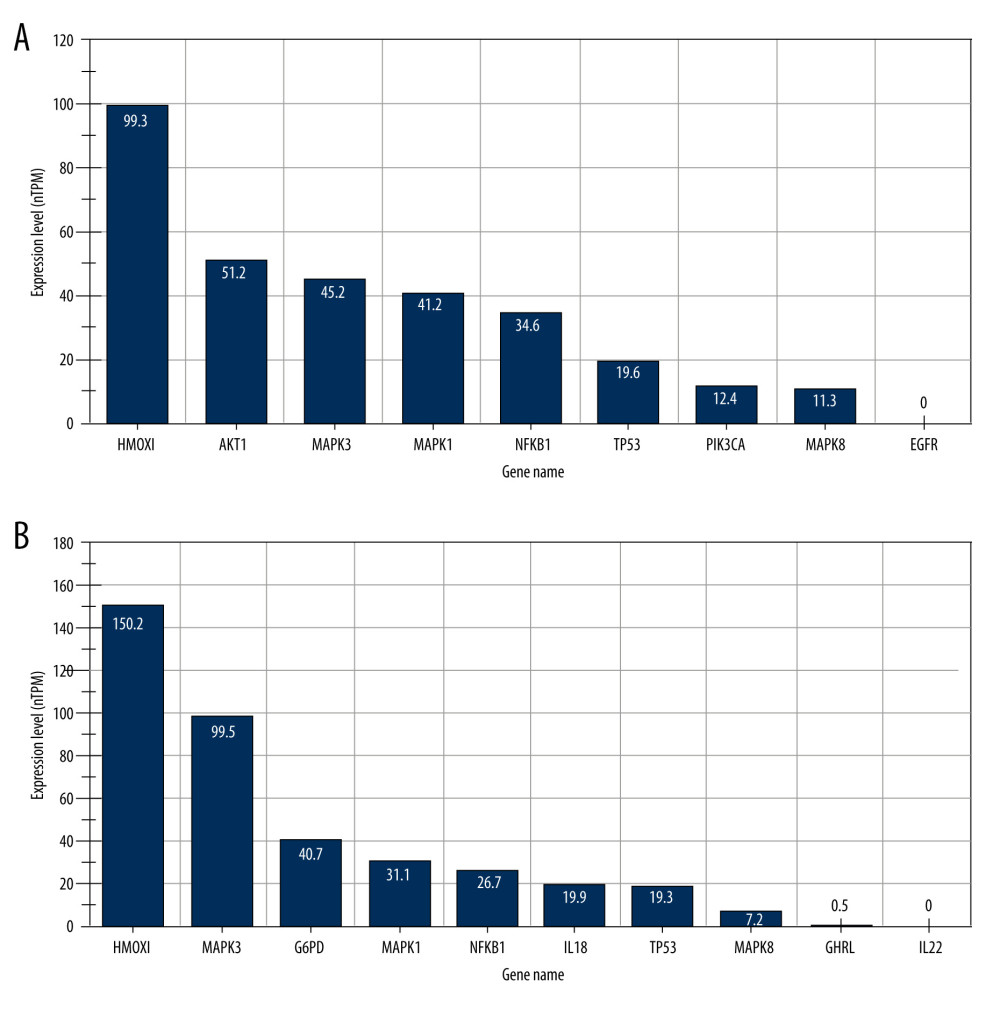 Figure 5. RNA tissue specificity in (A) bone marrow and (B) adipocyte using the Human Protein Atlas database.
 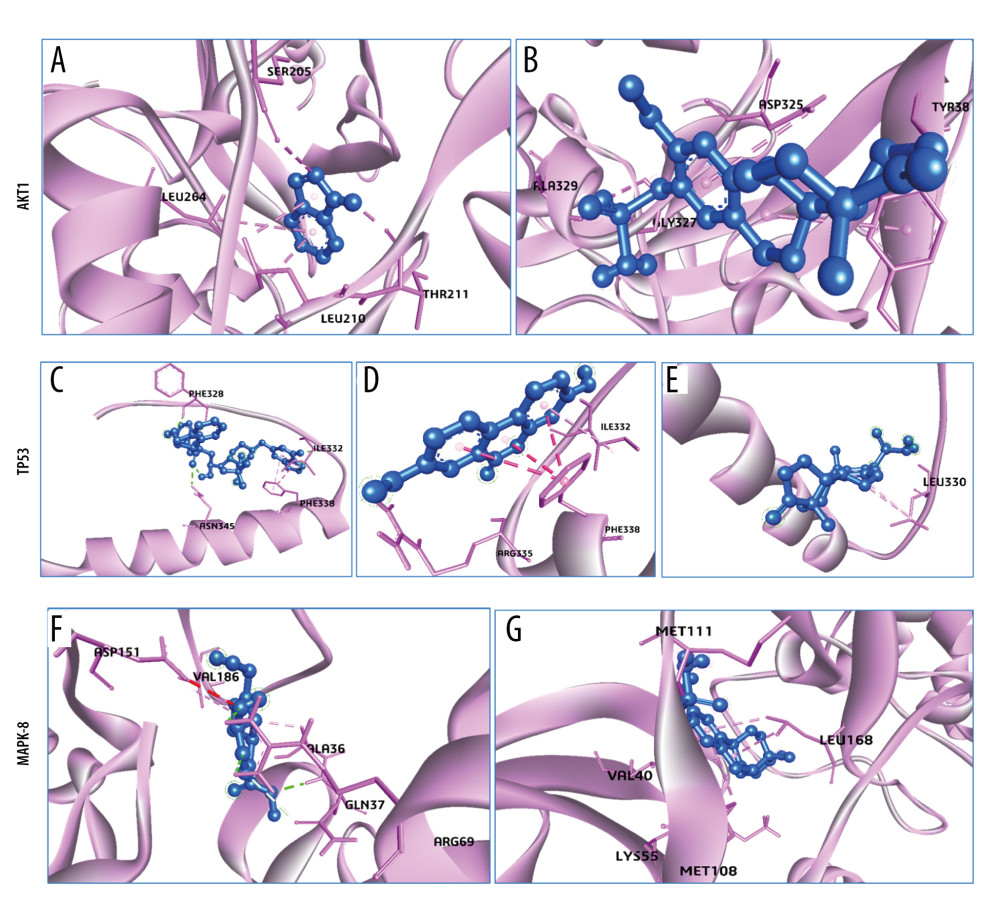 Figure 6. 3D Interactions of Osteoporosis related targets-their related metabolites and control (Estrogen). (A) AKT1-Indole (798), (B) AKT1-Oestrogen (9907745), (C) TP53-Compound K (9852086), (D) TP53-Urolithin A, (5488186) (E) TP53-Oestrogen (9907745), and (F) MAPK8-genipin (442424), (G) MAPK8-Oestrogen (9907745). All the figures were generated using BIOVIA Discovery Studio Visualizer v19.1 (BIOVIA).
 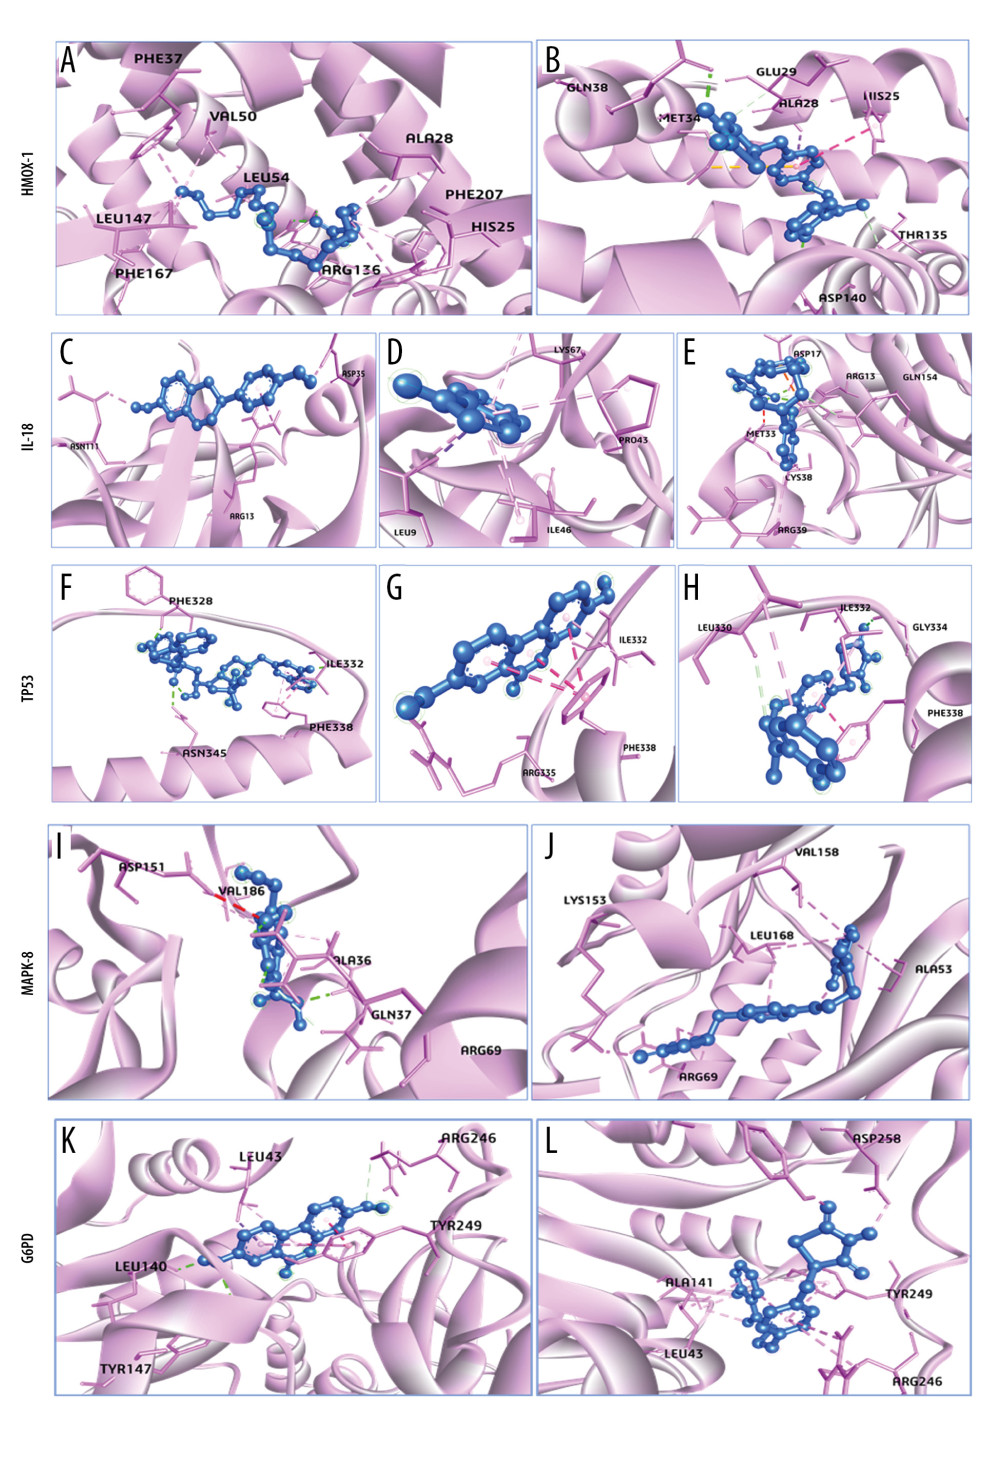 Figure 7. 3D Interactions of Obesity-related targets-their related metabolites and control (Rosiglitazone). (A) HMOX1-10-Oxo-11-octadecenoic acid (10308378), (B) HMOX1-Rosiglitazone (77999), (C) IL18-Equol (91469), (D) IL18-Indole (798), (E) IL18-Rosiglitazone (77999), (F) TP53-Compound K (9852086), (G) TP53-Urolithin A (5488186), (H) TP53-Rosiglitazone (77999), (I) MAPK8-genipin (442424), and (J) MAPK8-Rosiglitazone (77999), (K) G6PD-Urolithin A (5488186), (L) G6PD-Rosiglitazone (77999). All the figures were generated using BIOVIA Discovery Studio Visualizer v19.1 (BIOVIA).
 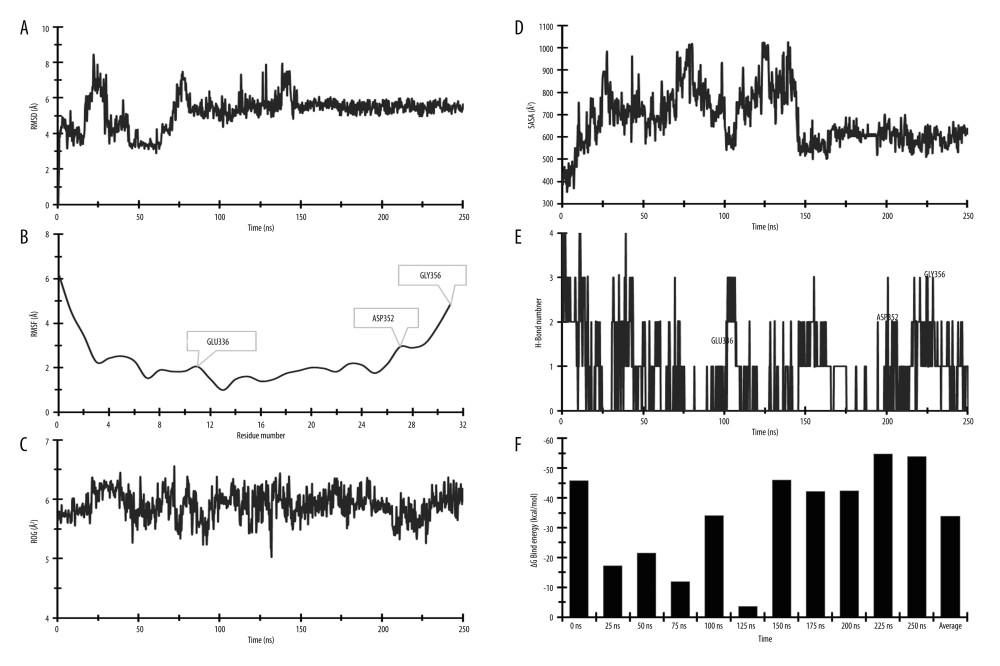 Figure 8. Molecular dynamic simulation of compound K and TP53 protein complex. (A) RMSD, (B) RMSF, (C) ROG, (D) SASA, (E) H-Bond, and (F) MM-GBSA. RMSD – root-mean-square deviation; RMSF – root-mean-square fluctuation; ROG – radius of gyration; SASA – solvent-accessible surface area; MM-GBSA – molecular biomechanics generalized Born surface area. Desmond v6.3 Program in Schrödinger 2023–3 under the Linux platform was used to perform molecular dynamic simulation.
 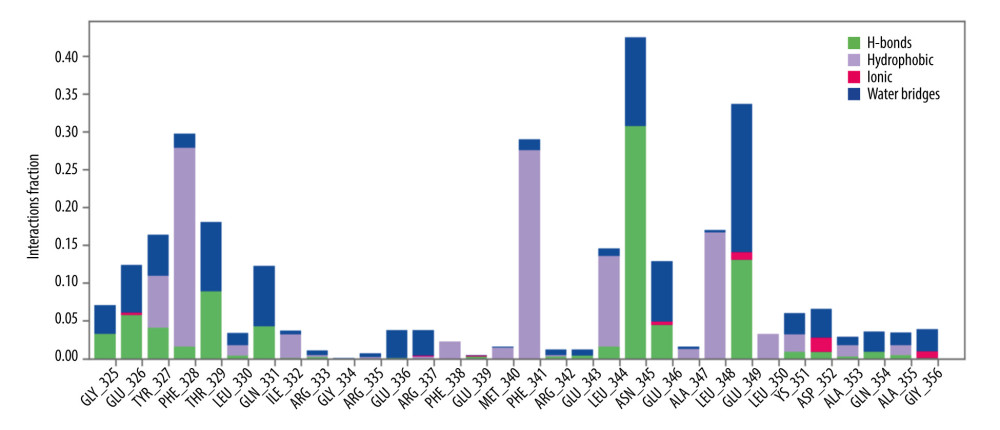 Figure 9. The protein–ligand contact was retrieved from the molecular dynamic simulation trajectory.
 Tables
Table 1. Degree Centrality (DC), Betweenness Centrality (BC), and Closeness Centrality (CC) of (A) OP-related genes and (B) Obesity-related genes.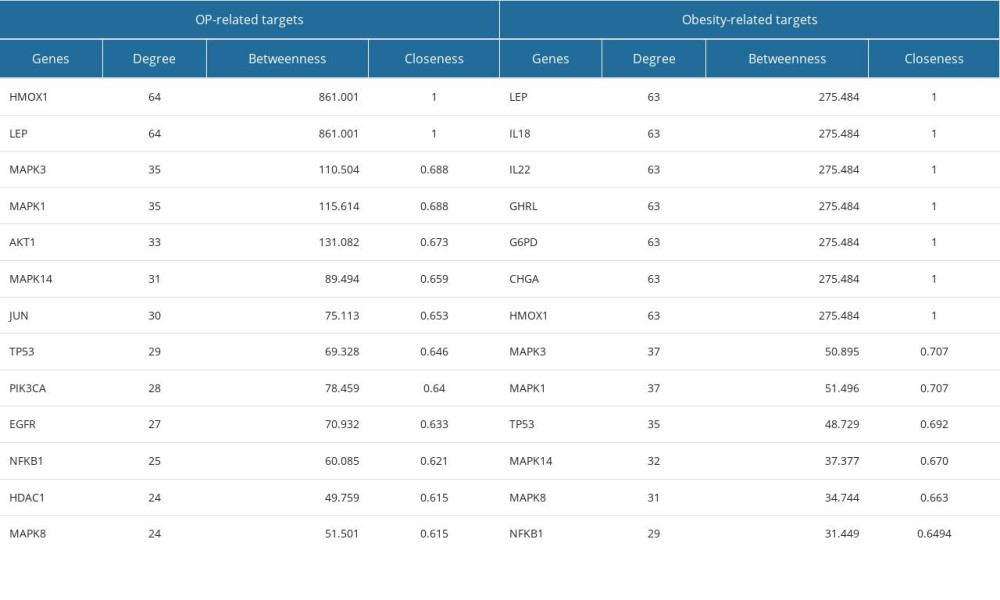 Table 2. OP and Obesity target-related gut microbial metabolites.
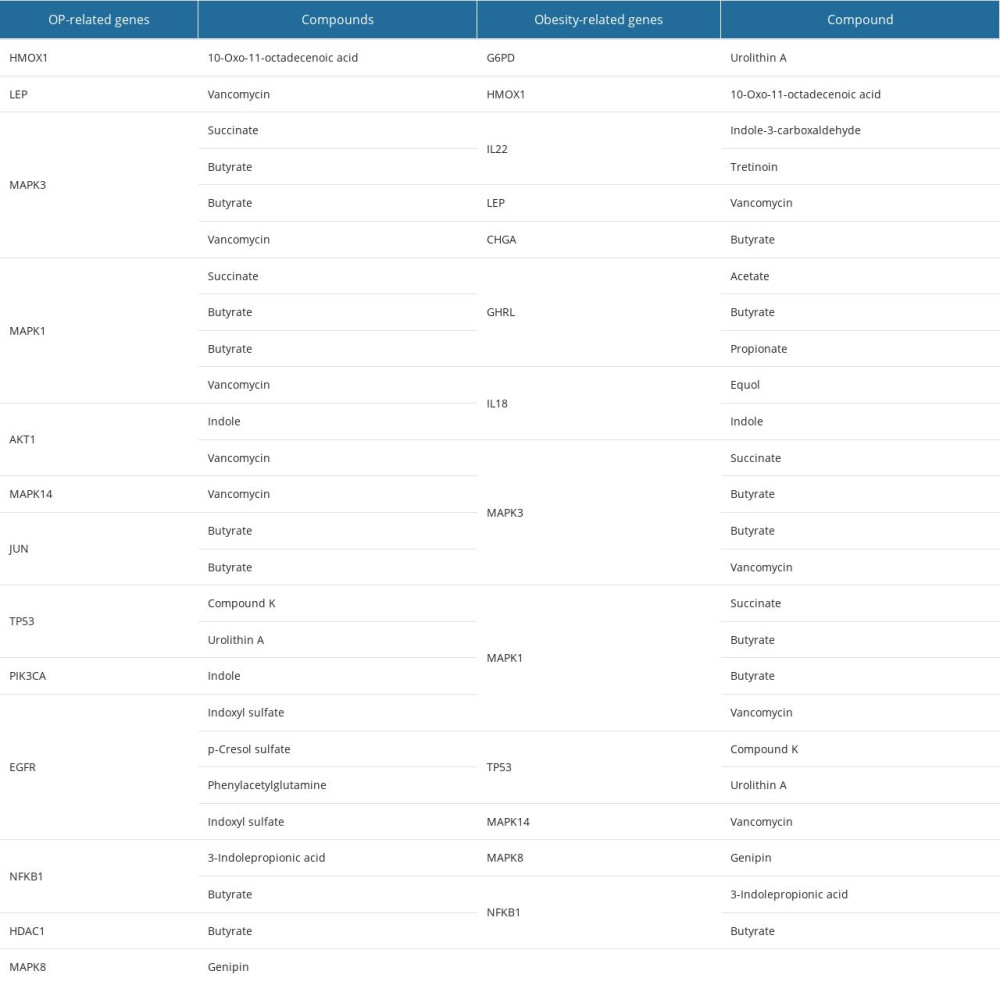 Table 3. Physiochemical and ADMET properties of 6 selected gut microbial metabolites.
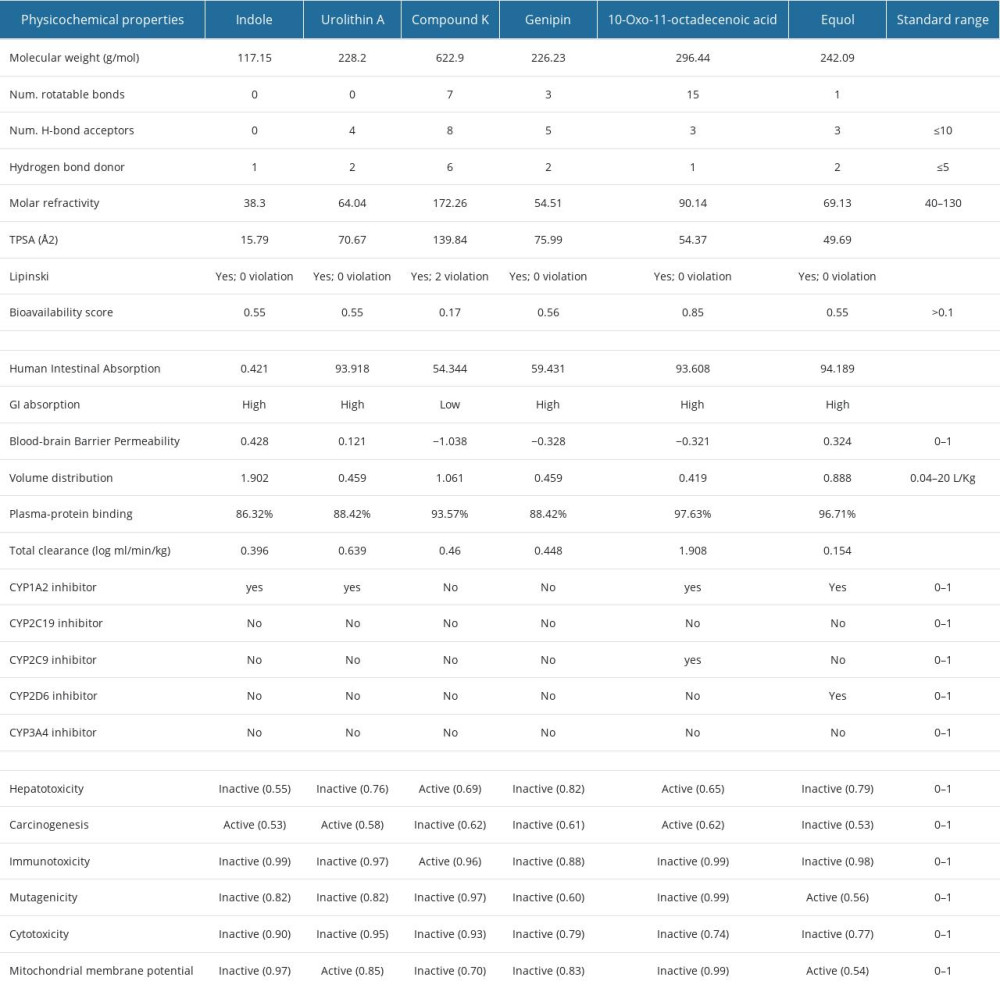 Table 4. Interaction of gut microbial metabolites and control drugs with the amino acid residue of targeted proteins.
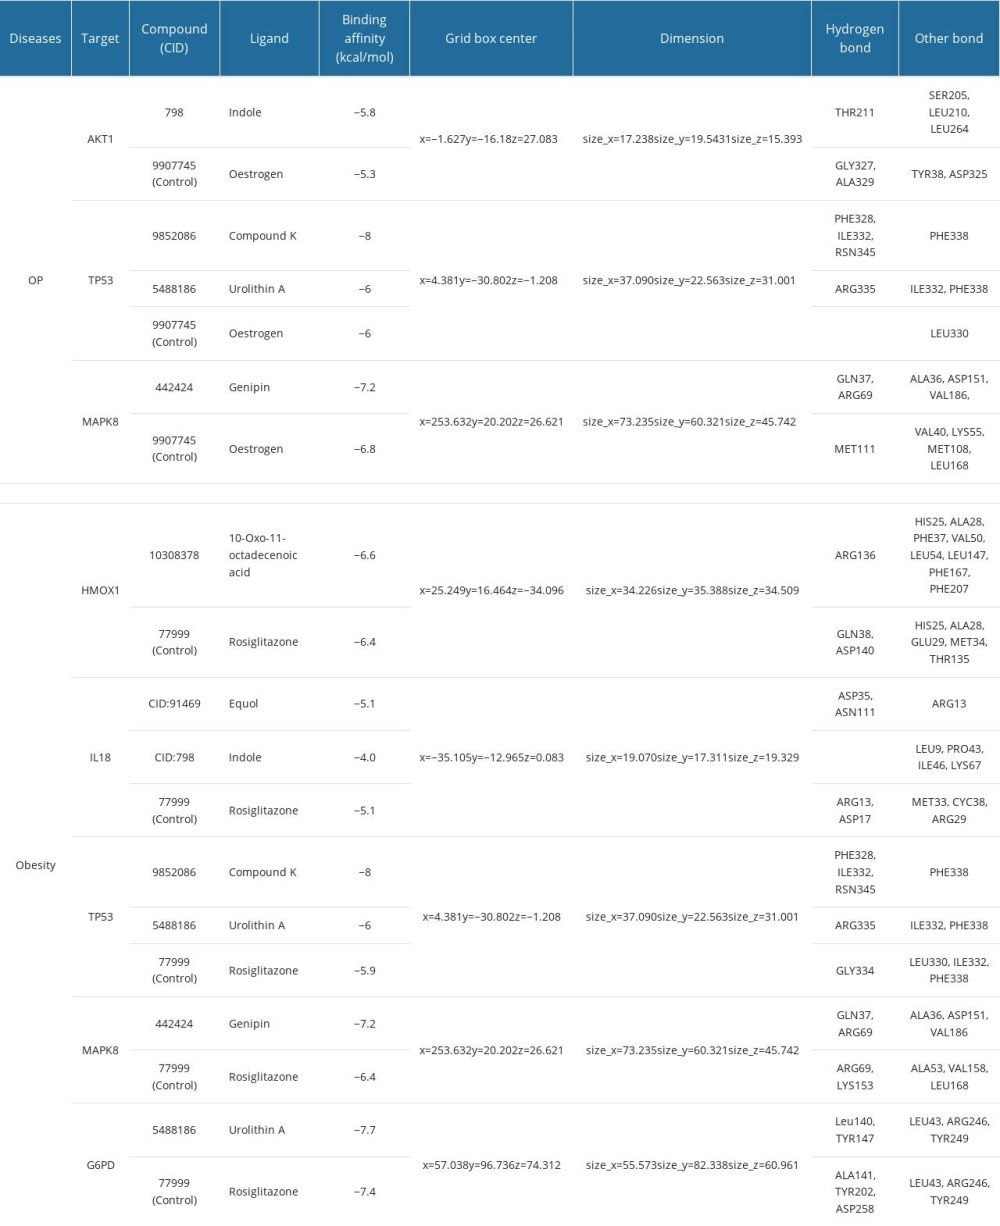 Table 5. Post-molecular dynamic simulation MM-GBSA calculation.
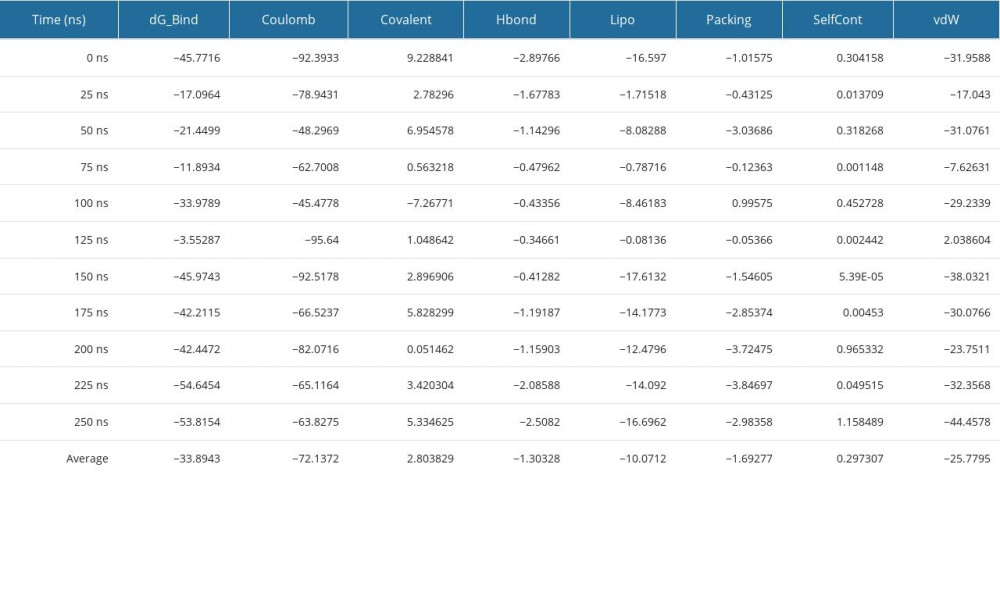 Table 6. Disease-related micro-biome, substrates, metabolites, and targets.
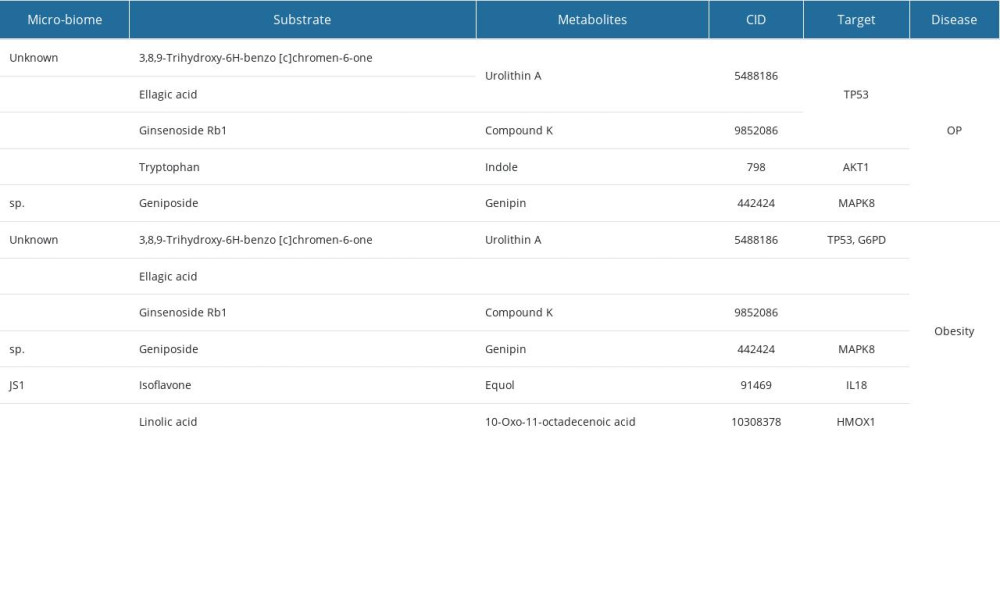
References
1. Cummings SR, Melton LJ, Epidemiology and outcomes of osteoporotic fractures: Lancet, 2002; 359(9319); 1761-67
2. Che J, Yang J, Zhao B, Shang P, HO-1: A new potential therapeutic target to combat osteoporosis: Eur J Pharmacol, 2021; 906; 174219
3. Zhu N, Hou J, Exploring the mechanism of action Xianlingubao Prescription in the treatment of osteoporosis by network pharmacology: Computa Biol Chem, 2020; 85; 107240
4. Zhao F, Guo Z, Kwok L-Y, Bifidobacterium lactis Probio-M8 improves bone metabolism in patients with postmenopausal osteoporosis, possibly by modulating the gut microbiota: Eur J Nutr, 2023; 62(2); 965-76
5. Chen Z, Cai Z, Zhuang P, Living probiotic biomaterials for osteoporosis therapy: Biomedical Technology, 2023; 1; 52-64
6. Rosen CJ, Bouxsein ML, Mechanisms of disease: is osteoporosis the obesity of bone?: Nat Clin Pract Rheumatol, 2006; 2(1); 35-43
7. Akter R, Boopathi V, Awais M: ACS Food Science & Technology, 2023; 3(11); 1975-87
8. Jin C, Tan K, Yao Z, A novel anti-osteoporosis mechanism of VK2: Interfering with Ferroptosis via AMPK/SIRT1 pathway in type 2 diabetic osteoporosis: J Agric Food Chem, 2023; 71(6); 2745-61
9. López-Gómez JJ, Castrillón JLP, de Luis Román DA, Impact of obesity on bone metabolism: Endocrinol Nutr, 2016; 63(10); 551-59
10. Zhao LJ, Jiang H, Papasian CJ, Correlation of obesity and osteoporosis: Effect of fat mass on the determination of osteoporosis: J Bone Miner Res, 2008; 23(1); 17-29
11. Guo M, Liu H, Yu Y: Gut Microbes, 2023; 15(1); 2190304
12. Bäckhed F, Fraser CM, Ringel Y, Defining a healthy human gut microbiome: Current concepts, future directions, and clinical applications: Cell Host Microbe, 2012; 12(5); 611-22
13. Agus A, Clément K, Sokol H, Gut microbiota-derived metabolites as central regulators in metabolic disorders: Gut, 2021; 70(6); 1174-82
14. Ding K, Hua F, Ding W, Gut microbiome and osteoporosis: Aging Dis, 2020; 11(2); 438-47
15. Heiss CN, Olofsson LE, Gut microbiota-dependent modulation of energy metabolism: J Innate Immun, 2018; 10(3); 163-71
16. Muscogiuri G, Cantone E, Cassarano S, Gut microbiota: A new path to treat obesity: Int J Obes Suppl, 2019; 9(1); 10-19
17. Duffuler P, Bhullar KS, Wu J, Targeting gut microbiota in osteoporosis: Impact of the microbial-based functional food ingredients: Food Science and Human Wellness, 2024; 13(1); 1-15
18. Krautkramer KA, Fan J, Bäckhed F, Gut microbial metabolites as multi-kingdom intermediates: Nat Rev Microbiol, 2021; 19(2); 77-94
19. Kumari R, Singhvi N, Sharma P, Virtual screening of gut microbiome bacteriocins as potential inhibitors of stearoyl-CoA desaturase 1 to regulate adipocyte differentiation and thermogenesis to combat obesity: J Biomol Struct Dyn, 2023; 41(22); 12632-42
20. Gan C, Jia X, Fan S, Virtual screening and molecular dynamics simulation to identify potential SARS-CoV-2 3CLpro inhibitors from a natural product compounds library: Acta Virologica, 2023; 67
21. Oh K-K, Gupta H, Min B-H, Elucidation of prebiotics, probiotics, postbiotics, and target from gut microbiota to alleviate obesity via network pharmacology study: Cells, 2022; 11(18); 2903
22. Zhang B, Tian Y, Zhang Z, Network biology in medicine and beyond: Circ Cardiovasc Genet, 2014; 7(4); 536-47
23. Oh K, Adnan M, Cho D: Biology, 2021; 10(8); 703
24. Oh KK, Adnan M, Cho DH, Network pharmacology approach to decipher signaling pathways associated with target proteins of NSAIDs against COVID-19: Sci Rep, 2021; 11(1); 9606
25. Cheng L, Qi C, Yang H, gutMGene: A comprehensive database for target genes of gut microbes and microbial metabolites: Nucleic Acids Res, 2022; 50(D1); D795-800
26. Piñero J, Ramírez-Anguita JM, Saüch-Pitarch J, The DisGeNET knowledge platform for disease genomics: 2019 update: Nucleic Acids Res, 2020; 48(D1); D845-D55
27. Hamosh A, Scott AF, Amberger JS, Online Mendelian Inheritance in Man (OMIM), a knowledgebase of human genes and genetic disorders: Nucleic Acids Res, 2005; 33(Suppl 1); D514-D17
28. Zhou Y, Zhou B, Pache L, Metascape provides a biologist-oriented resource for the analysis of systems-level datasets: Nat Commun, 2019; 10(1); 1523
29. Ge SX, Jung D, Yao R, ShinyGO: A graphical gene-set enrichment tool for animals and plants: Bioinformatics, 2019; 36(8); 2628-29
30. Shi L, Yu L, Zou F, Gene expression profiling and functional analysis reveals that p53 pathway-related gene expression is highly activated in cancer cells treated by cold atmospheric plasma-activated medium: Peer J, 2017; 5; e3751
31. Chen EY, Tan CM, Kou Y, Enrichr: Interactive and collaborative HTML5 gene list enrichment analysis tool: BMC Bioinformatics, 2013; 14(1); 128
32. Šikić M, Tomić S, Vlahoviček K, Prediction of protein–protein interaction sites in sequences and 3D structures by random forests: PLoS Comput Biol, 2009; 5(1); e1000278
33. Rao VS, Srinivas K, Sujini GN, Kumar GNS, Protein–protein interaction detection: Methods and analysis: Int J Proteomics, 2014; 2014; 147648
34. Zhou G, Soufan O, Ewald J, NetworkAnalyst 3.0: A visual analytics platform for comprehensive gene expression profiling and meta-analysis: Nucleic Acids Res, 2019; 47(W1); W234-W41
35. Tang Y, Li M, Wang J, CytoNCA: A cytoscape plugin for centrality analysis and evaluation of protein interaction networks: Biosystems, 2015; 127; 67-72
36. Daina A, Michielin O, Zoete V, SwissADME: A free web tool to evaluate pharmacokinetics, drug-likeness and medicinal chemistry friendliness of small molecules: Sci Rep, 2017; 7(1); 42717
37. Xiong G, Wu Z, Yi J, ADMETlab 2.0: An integrated online platform for accurate and comprehensive predictions of ADMET properties: Nucleic Acids Res, 2021; 49(W1); W5-W14
38. Pires DEV, Blundell TL, Ascher DB, pkCSM: Predicting small-molecule pharmacokinetic and toxicity properties using graph-based signatures: J Med Chem, 2015; 58(9); 4066-72
39. Banerjee P, Eckert AO, Schrey AK, Preissner R, ProTox-II: A webserver for the prediction of toxicity of chemicals: Nucleic Acids Res, 2018; 46(W1); W257-W63
40. Thul PJ, Lindskog C, The human protein atlas: A spatial map of the human proteome: Protein Sci, 2018; 27(1); 233-44
41. Liang X-Z, Liu X-C, Li S, IRF8 and its related molecules as potential diagnostic biomarkers or therapeutic candidates and immune cell infiltration characteristics in steroid-induced osteonecrosis of the femoral head: J Orthop Surgery Res, 2023; 18(1); 27
42. Pallesen J, Wang N, Corbett KS, Immunogenicity and structures of a rationally designed prefusion MERS-CoV spike antigen: Proc Natl Acad Sci, 2017; 114(35); E7348-E57
43. Opo FA, Rahman MM, Ahammad F, Structure based pharmacophore modeling, virtual screening, molecular docking and ADMET approaches for identification of natural anti-cancer agents targeting XIAP protein: Sci Rep, 2021; 11(1); 1-17
44. Zhang J, Liu X, Zhou W, A bioinformatics investigation into molecular mechanism of Yinzhihuang granules for treating hepatitis B by network pharmacology and molecular docking verification: Sci Rep, 2020; 10(1); 11448
45. Dey D, Paul PK, Al Azad S, Molecular optimization, docking, and dynamic simulation profiling of selective aromatic phytochemical ligands in blocking the SARS-CoV-2 S protein attachment to ACE2 receptor: An in silico approach of targeted drug designing: J Adv Vet Anim Res, 2021; 8(1); 24-35
46. Ahammad F, Alam R, Mahmud R: Briefings in Bioinformatics, 2021; 22(5); bbab098
47. Sastry GM, Adzhigirey M, Day T, Annabhimoju R, ligand preparation: Parameters, protocols, and influence on virtual screening enrichments: J Comput Aided Mol Des, 2013; 27(3); 221-34
48. Baral K, Adhikari P, Jawad B, Solvent effect on the structure and properties of RGD peptide (1FUV) at body temperature (310 K) using ab initio molecular dynamics: Polymers, 2021; 13(19); 3434
49. Mahdavi M, Fattahi A, Tajkhorshid E, Nouranian S, Molecular insights into the loading and dynamics of doxorubicin on PEGylated graphene oxide nanocarriers: ACS Appl Bio Mater, 2020; 3(3); 1354-63
50. Genheden S, Ryde U, The MM/PBSA and MM/GBSA methods to estimate ligand-binding affinities: Expert Opin Drug Discov, 2015; 10(5); 449-61
51. Lipinski CA, Lombardo F, Dominy BW, Feeney PJ, Experimental and computational approaches to estimate solubility and permeability in drug discovery and development settings: Adv Drug Deliv Rev, 1997; 23(1–3); 3-25
52. Selma MV, Beltrán D, García-Villalba R: Food Funct, 2014; 5(8); 1779-84
53. Quan LH, Kim YJ, Li GH: World J Microbiol Biotechnol, 2013; 29(6); 1001-7
54. Wang Z, Zhang L, Cui X-D: Annals of Microbiology, 2015; 65(3); 1303-11
55. Samad A, Huq MA, Rahman MS, Bioinformatics approaches identified dasatinib and bortezomib inhibit the activity of MCM7 protein as a potential treatment against human cancer: Sci Rep, 2022; 12(1); 1539
56. Baildya N, Khan AA, Ghosh NN, Screening of potential drug from Azadirachta Indica (Neem) extracts for SARS-CoV-2: An insight from molecular docking and MD-simulation studies: J Mol Struct, 2021; 1227; 129390
57. Mahmud S, Rahman E, Nain Z, Computational discovery of plant-based inhibitors against human carbonic anhydrase IX and molecular dynamics simulation: J Biomol Struct Dyn, 2021; 39(8); 2754-70
58. Velletri T, Xie N, Wang Y, P53 functional abnormality in mesenchymal stem cells promotes osteosarcoma development: Cell Death Dis, 2016; 7(1); e2015
59. Molchadsky A, Ezra O, Amendola P, p53 is required for brown adipogenic differentiation and has a protective role against diet-induced obesity: Cell Death Differ, 2013; 20(5); 774-83
60. Hallenborg P, Fjære E, Liaset B, p53 regulates expression of uncoupling protein 1 through binding and repression of PPARγ coactivator-1α: Am J Physiol Endocrinol Metab, 2016; 310(2); E116-E28
61. Krstic J, Reinisch I, Schupp M, p53 functions in adipose tissue metabolism and homeostasis: Int J Mol Sci, 2018; 19(9); 2622
62. Zhang Y, Tong D, Che D, Ascorbyl palmitate/d-α-tocopheryl polyethylene glycol 1000 succinate monoester mixed micelles for prolonged circulation and targeted delivery of compound K for antilung cancer therapy in vitro and in vivo: Int J Nanomedicine, 2017; 12; 605-14
63. Zhang Z, Du G-J, Wang C-Z, Compound K, a ginsenoside metabolite, inhibits colon cancer growth via multiple pathways including p53–p21 interactions: Int J Mol Sci, 2013; 14(2); 2980-95
64. Kim SE, Lee M-H, Jang H-M, A rare ginsenoside compound K (CK) induces apoptosis for breast cancer cells: Journal of Animal Reproduction and Biotechnology, 2023; 38(3); 167-76
65. Li Y, Zhou T, Ma C, Ginsenoside metabolite compound K enhances the efficacy of cisplatin in lung cancer cells: J Thorac Dis, 2015; 7(3); 400-6
Figures
Figure 1. Graphical abstract.Figure 2. (A) Venn diagram between metabolites and disease-related targets. (B) Tissue and cell-specific distribution of genes. Pa-GenBase dataset via the Metascape web server was used to generate the figure. (C) Chromosomal location of genes. The ShinyGO web tool was used to determine the chromosomal position of genes.Figure 3. (A) The biological processes, cellular components, and molecular function identified in the Gene Ontology enrichment analysis of OP targets. (B) The biological processes, cellular components, and molecular function identified in the Gene Ontology enrichment analysis of Obesity targets. (C) Kyoto Encyclopedia of Genes and Genomes pathways identified in the enrichment analysis of OP targets. (D) Kyoto Encyclopedia of Genes and Genomes pathways identified in the enrichment analysis of Obesity-target. GO and KEGG enrichment analysis was performed using EnrichR.Figure 4. (A) Identification of Hub proteins. (B, C) PPI network of Hub proteins (the nodes represent proteins, and the edges represent protein–protein interactions).Figure 5. RNA tissue specificity in (A) bone marrow and (B) adipocyte using the Human Protein Atlas database.Figure 6. 3D Interactions of Osteoporosis related targets-their related metabolites and control (Estrogen). (A) AKT1-Indole (798), (B) AKT1-Oestrogen (9907745), (C) TP53-Compound K (9852086), (D) TP53-Urolithin A, (5488186) (E) TP53-Oestrogen (9907745), and (F) MAPK8-genipin (442424), (G) MAPK8-Oestrogen (9907745). All the figures were generated using BIOVIA Discovery Studio Visualizer v19.1 (BIOVIA).Figure 7. 3D Interactions of Obesity-related targets-their related metabolites and control (Rosiglitazone). (A) HMOX1-10-Oxo-11-octadecenoic acid (10308378), (B) HMOX1-Rosiglitazone (77999), (C) IL18-Equol (91469), (D) IL18-Indole (798), (E) IL18-Rosiglitazone (77999), (F) TP53-Compound K (9852086), (G) TP53-Urolithin A (5488186), (H) TP53-Rosiglitazone (77999), (I) MAPK8-genipin (442424), and (J) MAPK8-Rosiglitazone (77999), (K) G6PD-Urolithin A (5488186), (L) G6PD-Rosiglitazone (77999). All the figures were generated using BIOVIA Discovery Studio Visualizer v19.1 (BIOVIA).Figure 8. Molecular dynamic simulation of compound K and TP53 protein complex. (A) RMSD, (B) RMSF, (C) ROG, (D) SASA, (E) H-Bond, and (F) MM-GBSA. RMSD – root-mean-square deviation; RMSF – root-mean-square fluctuation; ROG – radius of gyration; SASA – solvent-accessible surface area; MM-GBSA – molecular biomechanics generalized Born surface area. Desmond v6.3 Program in Schrödinger 2023–3 under the Linux platform was used to perform molecular dynamic simulation.Figure 9. The protein–ligand contact was retrieved from the molecular dynamic simulation trajectory. Tables
Table 1. Degree Centrality (DC), Betweenness Centrality (BC), and Closeness Centrality (CC) of (A) OP-related genes and (B) Obesity-related genes.Table 2. OP and Obesity target-related gut microbial metabolites.Table 3. Physiochemical and ADMET properties of 6 selected gut microbial metabolites.Table 4. Interaction of gut microbial metabolites and control drugs with the amino acid residue of targeted proteins.Table 5. Post-molecular dynamic simulation MM-GBSA calculation.Table 6. Disease-related micro-biome, substrates, metabolites, and targets.Table 1. Degree Centrality (DC), Betweenness Centrality (BC), and Closeness Centrality (CC) of (A) OP-related genes and (B) Obesity-related genes.Table 2. OP and Obesity target-related gut microbial metabolites.Table 3. Physiochemical and ADMET properties of 6 selected gut microbial metabolites.Table 4. Interaction of gut microbial metabolites and control drugs with the amino acid residue of targeted proteins.Table 5. Post-molecular dynamic simulation MM-GBSA calculation.Table 6. Disease-related micro-biome, substrates, metabolites, and targets. In Press
Clinical Research
Body Weight and Insulin Resistance Indicators Among ChildrenMed Sci Monit In Press; DOI: 10.12659/MSM.951434
Clinical Research
Comparison of Radiographic Cervical Sagittal Alignment Parameters in Patients With Nonspecific Neck Pain, D...Med Sci Monit In Press; DOI: 10.12659/MSM.952950
Clinical Research
Combined Fibrinogen and Urinary α1-Microglobulin as Predictors of Respiratory Tract Infection in Children w...Med Sci Monit In Press; DOI: 10.12659/MSM.951066
Database Analysis
Evaluation of Salivary Total Oxidant Status (TOS) and Total Antioxidant Status (TAS) in Orthodontic Patient...Med Sci Monit In Press; DOI: 10.12659/MSM.952052
Most Viewed Current Articles
17 Jan 2024 : Review article 14,175,576
Vaccination Guidelines for Pregnant Women: Addressing COVID-19 and the Omicron VariantDOI :10.12659/MSM.942799
Med Sci Monit 2024; 30:e942799
13 Nov 2021 : Clinical Research 3,756,620
Acceptance of COVID-19 Vaccination and Its Associated Factors Among Cancer Patients Attending the Oncology ...DOI :10.12659/MSM.932788
Med Sci Monit 2021; 27:e932788
14 Dec 2022 : Clinical Research 2,465,966
Prevalence and Variability of Allergen-Specific Immunoglobulin E in Patients with Elevated Tryptase LevelsDOI :10.12659/MSM.937990
Med Sci Monit 2022; 28:e937990
16 May 2023 : Clinical Research 708,651
Electrophysiological Testing for an Auditory Processing Disorder and Reading Performance in 54 School Stude...DOI :10.12659/MSM.940387
Med Sci Monit 2023; 29:e940387