20 February 2025: Clinical Research
Predicting Cerebral Small Vessel Disease Burden Based on Thromboelastography in Patients with Acute Ischemic Stroke: A Pilot Study
Min Xia ACE 1*, DaiZong Wu BF 1, NengWei Yu CDF 2, GuoXiang Huang BF 1
DOI: 10.12659/MSM.946303
Med Sci Monit 2025; 31:e946303


Abstract
BACKGROUND: This study aimed to investigate the relationship between the coagulation function measured by thromboelastography (TEG) in patients with acute ischemic stroke (AIS) and total burden of cerebral small vessel disease (CSVD), to further establish a nomogram tool based on regular clinical risk factors and TEG, to conveniently predict the risk of high-grade white matter hyperintensities (WMH) and CSVD burden in AIS patients.
MATERIAL AND METHODS: A cross-sectional study included 143 AIS patients who underwent TEG tests and 3.0T head MRI scans after admission. They were grouped according to total burden CSVD score and WMH Fazekas score. Differences in regular clinical data (RCD), TEG, and conventional coagulation tests (CCT) between groups were compared. Three sets of logistic regression models were established: RCD model, and models combining RCD with TEG and CCT respectively, to evaluate their predictive performance for WMH and SVD in patients with AIS.
RESULTS: Univariate analysis revealed age, hypertension, stroke history, fibrinogen, and TEG indicators maximum amplitude, Angle, K, and coagulation index were risk factors for increased WMH Fazekas score and CSVD burden in patients with AIS (OR>1, P<0.05). Logistic regression model combining RCD and TEG had a higher AUC value in predicting WMH (Fazekas score ≥2) and SVD (SVD burden score ≥3).
CONCLUSIONS: TEG parameters of patients with AIS are related to CSVD burden and its imaging features. Based on regular clinical risk factors, TEG can provide additional predictive information on the severity of WMHs and the burden of CSVD in patients with AIS.
Keywords: Thrombelastography, ischemic stroke, Cerebral Small Vessel Diseases, white matter, Humans, Male, Female, Pilot Projects, Aged, Middle Aged, Cross-Sectional Studies, Risk Factors, Magnetic Resonance Imaging, Stroke, Logistic Models, Brain Ischemia
Introduction
Cerebral small vessel disease (CSVD) is a syndrome caused by various pathological changes in the small blood vessels within the brain and is the second most common cause of dementia, as well as a major factor in mixed dementia. CSVD can cause significant deterioration of cognitive function, gait, and balance [1]. CSVD is a risk factor for stroke, and 20% of strokes are caused by CSVD, including 25% of ischemic strokes [2]. CSVD is also associated with the severity and prognosis of stroke, and the severity of CSVD can effectively predict the neurological [3] and cognitive function [4,5] prognosis of patients with acute ischemic stroke (AIS).
On brain magnetic resonance imaging (MRI), 4 closely related features are biomarkers of CSVD: lacunar infarcts, white matter hyperintensities (WMH), cerebral microbleeds, and enlarged perivascular spaces. The total CSVD burden score may better reflect the overall impact of CSVD on the brain than only 1 or 2 individual features, as WMH and perivascular spaces reflect brain damage occurring at different locations [6].
As research on the risk factors for CSVD has increased, multiple studies have shown that it is associated with endothelial injury and dysfunction. Biomarkers such as C-reactive protein, interleukin-6, and fibrinogen are related to CSVD [7,8]. Kuipers et al found that biomarkers of coagulation-related proteins are associated with the burden of CSVD and its imaging features, especially WMH, in patients with cardiovascular disease [9], suggesting that vascular inflammation and coagulation can be risk factors for cerebral small vessel damage and indicating a possible association between coagulation function and CSVD.
Thromboelastography (TEG) is used to monitor the entire process of venous blood coagulation, from the activation of the intrinsic and extrinsic coagulation pathways to fibrin formation and the dissolution of blood clots. Integrating various parameters can help diagnose coagulation function both qualitatively and quantitatively [10]. Typically, susceptibility-weighted imaging is not a routine test for cerebral infarction. In some medical institutions, MRI for patients with AIS is by appointment rather than being done immediately in emergencies. The purpose of this study is to explore the correlation between coagulation function measured by TEG and the total burden of small vessel disease as well as its imaging markers, and to establish a convenient assessment and prediction tool for high-grade WMH and moderate-to-severe CSVD burden in AIS patients, based on TEG.
Material and Methods
DESIGN AND PATIENTS:
This cross-sectional study was conducted in the Department of Encephalopathy of the Chengdu Pidu District Hospital of Traditional Chinese Medicine from August 2022 to March 2024. It included 143 patients diagnosed with AIS. The inclusion criteria were as follows: (1) patients aged over 18 years old; (2) time from onset to admission was less than 72 h, and TEG testing was completed within 3 h after admission; (3) patient did not receive antiplatelet and anticoagulant therapy within 7 days before admission; (4) MRI examination was completed within 7 days after admission; (5) the 2 main Trial of Org 10172 in Acute Stroke Treatment (TOAST) subtypes of AIS, namely large artery atherosclerosis and small vessel occlusion, were included. The exclusion criteria were as follows: (1) patients who received intravenous thrombolysis or endovascular intervention after admission; (2) patients with blood diseases and coagulation disorders; (3) patients who were too severely ill to complete the MRI examination.
The regular clinical data of patients was collected at the time of admission. TEG and CCT were tested after simultaneous blood collection after admission.
The study protocol was approved by the Ethics Committee of the Chengdu Pidu District Hospital of Traditional Chinese Medicine (approval No. K-2023-018), and all patients signed an informed consent form.
THROMBOELASTOGRAPHY:
Within 3 h of admission and before administering anticoagulant and antiplatelet therapy, 3 mL of venous whole blood was collected and anticoagulated with sodium citrate before being inverted 5 times. A clotting trigger (calcium chloride) in 20 μL was added to the bottom of the reaction cup, and 1 mL of sodium citrate anticoagulant was added to the kaolin reagent container before being mixed by inversion 5 times. Then, 340 μL of the mixed solution (blood and kaolin) was transferred to the reaction cup, and the test was started immediately. TEG was performed using a Haema T4 TEG testing instrument (Medtronic).
The following parameters of TEG were collected: (1) reaction time of coagulation factors (R), which reflects the activity level of coagulation factors and represents the time from the beginning of clotting to the beginning of fibrin formation; reference value 4 to 8 min; (2) fibrin reaction time (K), which reflects the joint/synergistic action of fibrinogen and platelets in the formation of blood clots, ie, the rate of blood clot formation, reference value 1 to 3 min; (3) maximum amplitude (MA), which represents the maximum size of the clot and mainly reflects platelet aggregation; reference value 50 to 70 mm; (4) Angle, which decreases due to the lack of fibrinogen and reflects the speed of blood clot formation; (5) fibrinolysis rate (LY30), which reflects fibrinolysis activity; reference value 0% to 8%; and (6) coagulation index (CI), which comprehensively evaluates coagulation status; reference value −3 to +3.
SVD AND WMH SCORED:
All patients underwent examination using a 3.0 T MRI scanner (Siemens, Germany) within 7 days after admission. The MRI protocol obtained along the anterior-posterior commissure line included T2-weighted images: time repetition (TR) 4150 ms; time echo (TE) 95 ms; slice thickness 5 mm; fluid-attenuated inversion recovery (TR 6500 ms; TE 97 ms; FOV; slice thickness 5 mm); diffusion-weighted imaging sequences (TR 4240ms; TE 64 ms; slice thickness 5 mm) and susceptibility-weighted imaging (TR, 27ms; TE, 20 ms; slice thickness 1.5 mm).
The criteria for the total burden score of CSVD were as follows: (1) asymptomatic LI (lacunar infarction) ≥1, scored as 1 point; (2) cerebral microbleeds ≥1, scored as 1 point; (3) enlarged perivascular spaces, counted as the larger number of sides of ≥10 basal ganglia-perivascular spaces, and scored 1 point for moderate to severe; (4) high-grade WMH, scored as 1 point for extending from periventricular to deep white matter and/or patchy or confluent widespread WMHs according to the Fazekas scale.
The Fazekas score is used to assess the degree of overall WMH in the brain by a visual scale. The modified Fazekas scale ranges from 0 to 3 points: (1) 0 point: no lesion; (2) 1 point: punctate lesion; (3) 2 points: patchy lesion (partial aggregation of punctates); (4) 3 points: confluent lesion (lesions integrated into patches).
LOGISTIC REGRESSION PREDICTION MODEL:
The logistic regression model was established to evaluate and predict the CSVD (SVD burden score ≥3) and WMH (Fazekas score ≥2) in patients with AIS. After screening out predictors with severe collinearity (correlation coefficient >0.9), the bidirectional stepwise regression method was used to screen predictors to avoid strong collinearity among the predictors of the constructed model. The following predictor indices were included: in model A, regular clinical data, including variables such as sex, age, National Institute of Health Stroke Scale score (NIHSS), hypertension, hyperlipidemia, hyperglycemia, and stroke history; in model B, regular clinical data combined with CCT, including fibrinogen (FIB), activated partial thromboplastin time (aPTT), prothrombin time (PT), and international normalized ratio (INR); and in model C, regular clinical data combined with TEG indicators, including MA, Angle, R, K, Ly30, and CI. The predictive ability of different models for patients was assessed by inputting different models of predictor indices.
The performances of different models were compared by receiver operating characteristic (ROC) analysis and using the DeLong test. In addition, the performance of the different models was evaluated through calibration curves and the Hosmer-Lemeshow test.
We particularly note that in building the prediction model, for regular clinical data, we excluded TOAST, as it needs subsequent MRI for confirmation.
STATISTICAL ANALYSIS:
Statistical analyses were conducted using R software (version 4.2.1). Continuous and categorical variables were represented using normality and homogeneity of variance tests. One-way ANOVA and
Risk factors for high CSVD burden scores were analyzed using univariate and stepwise bidirectional regressions. The correlation between the predictors of the models was analyzed by the Spearman method. ROC analysis was used to analyze the AUC and corresponding confidence intervals of the model’s ROC curves. The Delong test was used to test the significance of the difference in AUC values. The Hosmer-Lemeshow test was used to calibrate the model. Statistical significance was set at
Results
DEMOGRAPHIC INFORMATION:
A total of 143 patients were included in this study. Among them, 89 (62.24%) were men, and the median age was 66.0 (57.5, 74.0) years. According to the total burden score of CSVD, the patients were divided into 2 groups: 105 (73.43%) patients in group 1 (score ≤2), and 38 (26.57%) patients in group 2 (score ≥3). According to the Fazekas score of WMH, the patients were divided into 2 groups: 88 (61.54%) patients in group 1 (score ≤1), and 55 (38.46%) patients in group 2 (score ≥2). According to the grouping by total SVD burden and Fazekas score of WMH, the inter-group differences in age, hypertension, stroke history, FIB, and TEG indicators MA, Angle, K, and CI were statistically significant (P<0.05; Table 1).
TEG PARAMETERS IDENTIFIED AS RISK FACTORS FOR CSVD MRI MANIFESTATIONS:
The relationships between TEG indices (MA, Angle, K, CI) and the 4 CSVD MRI manifestations were analyzed using the Kruskal-Wallis test. The results showed that TEG indicator MA was significantly related to all CSVD MRI features (P<0.05), and that the MRI presentation of WMH and enlarged perivascular spaces was significantly related to MA, Angle, K, and CI (P<0.05; Figure 1). These findings confirm that there is a general correlation between coagulation function represented by the TEG indices MA, Angle, and K and various MRI features of CSVD.
SPEARMAN CORRELATION ANALYSIS FOR PREDICTOR INDICES:
A correlation test was conducted for the predictor index of models. The results showed that there was severe collinearity (correlation coefficient >0.9, P<0.001) between the TEG indicators Angle and K, and between the CCT indicators INR and PT. At the same time, the results of correlation analysis showed that female patients were older and had stronger coagulation function (Figure 2).
RISK FACTORS AND PREDICTORS OF SVD AND WMH:
Results from the univariate ordinal regression analysis indicated that the risk factors for increased CSVD burden and aggravated WMH were age, hypertension, stroke history, FIB, and the TEG indicators MA, Angle, K, and CI (all OR>1, P<0.05; Table 2). The results of 2-way stepwise ordinal regression analysis showed that the independent risk factors for increased burden of CSVD were male sex, age, hypertension, stroke history, and TEG indicator MA. The independent risk factors for aggravated WMH were also male sex, age, hypertension, stroke history, and TEG indicator MA (Table 3).
After excluding Angle and PT, which have severe collinearity with K and INR, respectively, the bidirectional stepwise logistic regression scheme was adopted to screen out the predictors for evaluating SVD (score ≥3) and WMH (Fazekas score ≥2). For the predictor search of model A, the predictors for evaluating SVD were age, hypertension, and stroke history. The predictors for evaluating WMH were the same. For the predictor search of model B, the predictors for evaluating SVD were age, hypertension, stroke history, and FIB. The predictors for evaluating WMH were sex, age, hypertension, stroke history, FIB, and aPTT. For the predictor search of model C, the predictors for evaluating SVD were sex, age, hypertension, stroke history, and MA. The predictors for evaluating WMH were the same (Table 3).
In addition, the correlation test indicated that the correlation coefficients between the predictors of each model screened through 2-way stepwise regression were all less than 0.4 (Figure 2), suggesting that there was no strong collinearity among the models’ predictor indices.
COMPARISON OF PREDICTIVE PERFORMANCE BETWEEN CCT AND TEG:
The 4 TEG indices with the highest prediction performance and the 4 indices of CCT were selected for a comparison of prediction performance. For predicting WMH, the AUC values of the ROC of the 4 TEG indices were all higher than those of the 4 CCT indices. Among them, MA had the highest prediction efficacy, and the AUC value of MA was significantly higher than that of aPTT, PT, and INR (0.702 [0.617–0.787] v 0.567 [0.469–0.665], 0.488 [0.391–0.585], 0.512 [0.414–0.611]), and the same situation occurred when predicting a high burden of SVD. MA had the highest prediction efficacy and was significantly higher than aPTT, PT, and INR (0.724 [0.638–0.809] v 0.559 [0.447–0.671], 0.522 [0.421–0.624], 0.504 [0.400–0.609]; Figure 3).
PREDICTION NOMOGRAM PERFORMANCE:
After constructing the logistic regression models, we created the corresponding nomograms. These logistic regression models based on model C were integrated into a column chart (Figure 4). Based on the Delong test, the prediction nomogram based on model C had a significantly higher AUC value (0.808 [0.731–0.884]) than that based on model A (0.716 [0.621–0.810]) and model B (0.733 [0.640~0.827]) in predicting SVD burden (score ≥3) in patients with AIS, and model C had a significantly higher AUC value (0.813 [0.744–0.882]) than that based on model A (0.748 [0.667–0.828]) in predicting high-grade WMH (score ≥2; Table 4).
ROC curves based on prediction nomograms constructed from different predictors indices were analyzed using the Delong method (Figure 5). When predicting patients’ SVD (score ≥3), the Youden index of the prediction nomograms based on model C was higher than that of model A and model B (0.489 v 0.368, 0.370). When predicting patients’ WMH (score ≥2), the Youden index of the prediction nomogram based on model C (0.464) was higher than that of model A (0.380) but lower than model B (0.503;Table 5).
The results of the Hosmer-Lemeshow test indicated that different prediction nomograms for predicting SVD and WMH had good goodness-of-fit with actual observed probabilities (P>0.05; Table 5). Calibration curves of the risk-prediction models were bias-corrected using bootstrapping (Figure 6).
Discussion
CSVD is a risk factor for stroke and affects patient prognosis. The total burden of CSVD in patients with AIS is not only related to their stroke recurrence probability and neurofunction prognosis, but also predicts their cognitive function outcomes; some studies have shown that it is related to post-stroke depression. TEG is a commonly used examination for AIS and is faster and more convenient than MRI. Additionally, some healthcare facilities cannot offer some MRI sequences, especially susceptibility-weighted imaging, for imaging examinations of patients with AIS. Therefore, this study analyzed the correlations between TEG indices and clinical data, and the results showed that TEG indicators can provide additional information for evaluating and diagnosing the total burden of CSVD and the main imaging feature WMH in AIS patients based on regular clinical data, which is of great significance for the evaluation of CSVD in patients with AIS.
Age and hypertension are the most well-established risk factors for CSVD, and a history of stroke is an independent risk factor for WMH in patients [11]. Diabetes is commonly regarded as a risk factor for CSVD. However, some studies have found no association between diabetes and any of CSVD’s MRI features [6]. Hyperuricemia is associated with endothelial dysfunction and atherosclerosis. Studies have shown that uric acid levels in patients with small-vessel stroke are an independent risk factor for CSVD, and hyperuricemia in older men is associated with WMH [12,13]. Research on the effect of sex has varied, with some studies reporting that male sex is a risk factor for CSVD [6], while estrogen in women may be a protective factor against cerebrovascular disease. Other studies have reported that women have more significant CSVD imaging findings, whereas others have found no association.
The potential mechanisms underlying CSVD are not yet fully understood; however, research suggests that endothelial dysfunction, arteriolosclerosis, blood-brain barrier changes, and low blood flow play crucial roles [1]. Endothelial dysfunction may serve as a fundamental factor [14], and the interaction between coagulation and inflammation during the process of cerebrovascular endothelial cell dysfunction and damage promotes the development of CSVD [8,15,16]. Stimulation of damaged endothelial cells and inflammatory mediators leads to the excessive expression of tissue factors that activate the coagulation cascade after binding to serine proteins [17]. Fibrinogen [18], which plays a critical role in the coagulation cascade, is associated with the total burden of CSVD. It can produce inflammatory reactions and cause demyelinating changes by disrupting the blood-brain barrier [19,20]. Platelet activity is associated with CSVD. Research has shown that the levels of platelet CD40L and CD62P expression, which reflect platelet degranulation activation protein markers, are related to the overall burden of CSVD and WMH [9,21], and platelet activation and aggregation participate in the whole process from initial formation of atherosclerosis to stroke events [22]. Platelet activity, as evaluated by TEG, is related to large-artery atherosclerosis in patients [23]. Atherosclerosis is closely related to CSVD [24]. CSVD can be the result of intracranial atherosclerosis, and is often associated with large artery atherosclerosis [25]. Turbulent blood flow caused by changes in the arterial structure can generate wall shear stress that can damage the vascular endothelial cells and increase the risk of CSVD [26]. Turbulent flow can also activate platelet activity and aggregation [27], leading to formation of microthrombi, causing small perforating artery embolisms, and producing lacunar infarctions [28]. Additionally, atherosclerosis develops into plaques that can rupture and expose collagen, increase platelet adhesion, and activate platelets to form thrombi, causing cerebral infarction [15], and can also act as a source of microembolism [29], reducing white matter blood supply and aggravating WMHs. Severe atherosclerosis can also open tight junctions between endothelial cells, increase blood-brain barrier permeability, and allow cells, proteins, and bioactive substances from the blood to enter the brain parenchyma around the vessel walls, exacerbating brain tissue damage and CSVD [30]. Increased platelet activity and high fibrinogen levels are likely to form microthrombi, resulting in lacunar infarction.
Compared with traditional coagulation tests, TEG has advantages in evaluating platelet function and activity [31]. The TEG parameter MA mainly reflects platelet function and activity, while Angle mainly reflects fibrinogen levels and partial platelet function. The results of this study showed that fibrinogen levels were significantly and positively correlated with MA and Angle. Single-factor ordinal regression results showed that age, hypertension, history of stroke, MA, Angle, K, and CI were risk factors for the aggravation of CSVD in patients with AIS (all OR>1,
However, this study had certain limitations. First, this was a single-center study; therefore, our results can be influenced by selection bias. Further large-sample multicenter studies are needed. Second, cognitive ability during hospitalization was not evaluated, and the relationship between TEG and cognitive function in patients with AIS was not analyzed further. Finally, there was no quantitative analysis of MRI features for CSVD burden.
Conclusions
The coagulation function of patients with AIS detected by TEG is related to the burden of CSVD and its imaging features. It has good predictive value in assessing the severity of white matter lesions and the burden of CSVD. On the basis of general clinical data, it can provide additional predictive assessment information. TEG detection may provide a rapid and convenient means to assess the burden of cerebral small vessels in patients with AIS.
Figures
 Figure 1. The thromboelastography (TEG) parameters and cerebral small vessel disease MRI manifestations. Boxplots of the TEG parameters according to presence of white matter hyperintensities (WMH), enlarged perivascular spaces (EPVS), LI, and cerebral microbleeds (CMBs). P values were obtained from the Kruskal-Wallis test. (A) Boxplot of the relationship between MRI manifestations and maximum amplitude (MA). (B) Boxplot of the relationship between MRI manifestations and K. (C) Boxplot of the relationship between MRI manifestations and Angle. (D) Boxplot of the relationship between MRI manifestations and coagulation index (CI).
  Figure 2. Correlation heat map. We performed a spearman correlation test to evaluate the relation between predictors index of models.”*” indicates a significant correlation between parameters when P<0.05. “**” indicates a significant correlation when P<0.01. “***” indicates a significant correlation when P<0.001.
 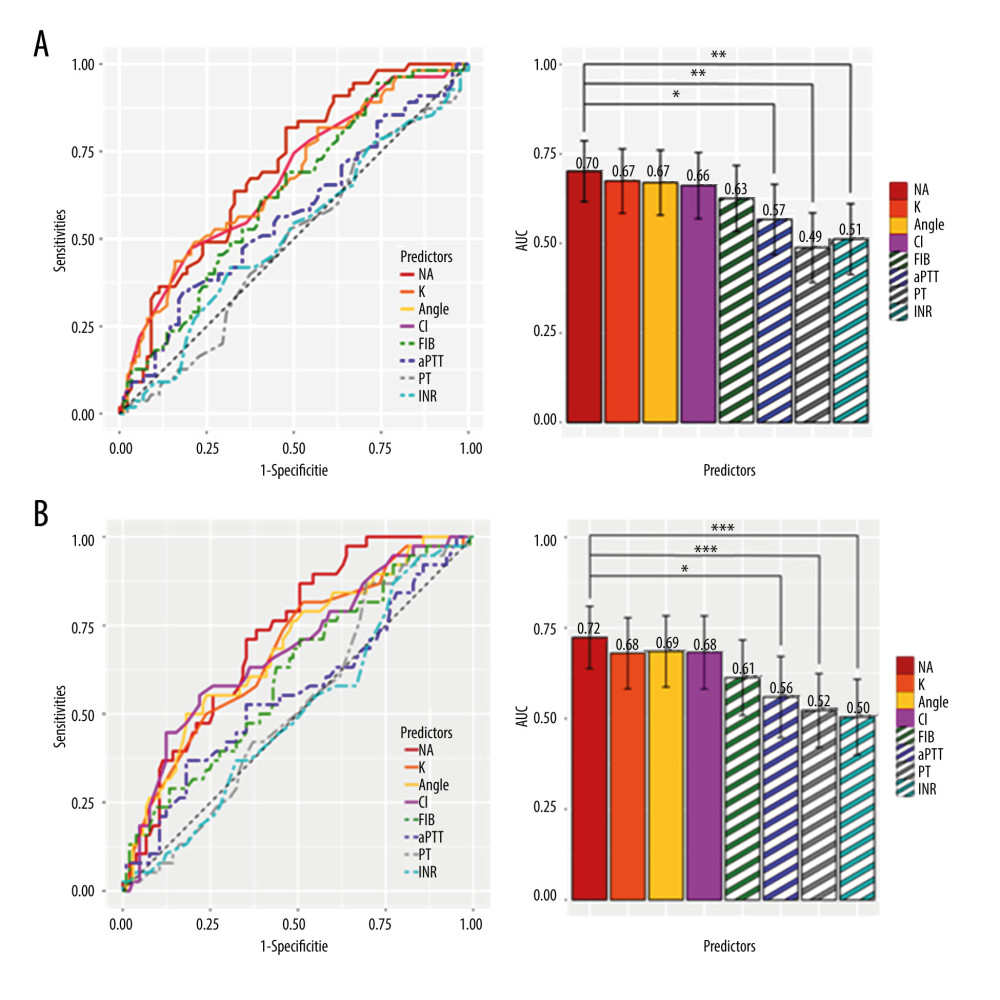 Figure 3. Comparison of predictive performance between thromboelastography (TEG) and conventional coagulation tests (CCTs). (A) The ROC and AUC comparison for predicting white matter hyperintensities (WMH) (Fazekas score ≥2); (B) The ROC and AUC comparison for predicting small vessel disease (SVD; burden score ≥3). “*” indicates a significant correlation between parameters when P<0.05. “**” indicates a significant correlation when P<0.01. “***” indicates a significant correlation when P<0.001.
  Figure 4. Development of the risk prediction nomogram regression analysis. (A) Nomogram for the prediction of the risk of white matter hyperintensities (WMH) (Fazekas score ≥2). (B) Nomogram for the prediction of the risk of small vessel disease (SVD; burden score ≥3).
  Figure 5. The ROC curve comparison of prediction models. (A) ROC curve comparison for predicting white matter hyperintensities (WMH; Fazekas score ≥2). (B) ROC curve comparison for predicting small vessel disease (SVD); burden score ≥3).
  Figure 6. The bias-corrected calibration curves obtained by bootstrapping of prediction models. (A) Calibration curves for predicting white matter hyperintensities (WMH; Fazekas score ≥2). (B) Calibration curves for predicting small vessel disease (SVD; burden score ≥3).
 Tables
Table 1. Comparison of clinical data in acute ischemic stroke patients grouped according to small vessel disease (SVD) burden scored and Fazekas score. Table 2. Univariable logistic and ordinal regression analysis based on small vessel disease (SVD) burden scores and Fazekas scores.
 Table 3. Bidirectional stepwise logistic and ordinal regression analysis based on small vessel disease (SVD) burden scores and Fazekas scores.
 Table 4. Comparison of the AUC values for models base on different predictor indexes for predicting small vessel disease (SVD) burden score (≥3) and Fazekas score (≥2).
 Table 5. Comparison between the 2 models base on different predictor indexes for predicting small vessel disease (SVD) burden score (≥3) and Fazekas score (≥2). H-L.test.p is the P value for the Hosmer-Lemeshow test.
References
1. Pantoni L, Cerebral small vessel disease: From pathogenesis and clinical characteristics to therapeutic challenges: Lancet Neurol, 2010; 9(7); 689-701
2. Chojdak-Łukasiewicz J, Dziadkowiak E, Zimny A, Paradowski B, Cerebral small vessel disease: A review: Adv Clin Exp Med, 2021; 30(3); 349-56
3. Huo YC, Li Q, Zhang WY, Total small vessel disease burden predicts functional outcome in patients with acute ischemic stroke: Front Neurol, 2019; 10; 808
4. Teng Z, Dong Y, Zhang D, Cerebral small vessel disease and post-stroke cognitive impairment: Int J Neurosci, 2017; 127(9); 824-30
5. de Kort FAS, Coenen M, Weaver NA, White matter hyperintensity volume and poststroke cognition: An individual patient data pooled analysis of 9 ischemic stroke cohort studies: Stroke, 2023; 54(12); 3021-29
6. Staals J, Makin SD, Doubal FN, Stroke subtype, vascular risk factors, and total MRI brain small-vessel disease burden: Neurology Sep 30, 2014; 83(14); 1228-34
7. Satizabal CL, Zhu YC, Mazoyer B, Circulating IL-6 and CRP are associated with MRI findings in the elderly: The 3C-Dijon Study: Neurology, 2012; 78(10); 720-27
8. Low A, Mak E, Rowe JB, Inflammation and cerebral small vessel disease: A systematic review: Ageing Res Rev, 2019; 53; 100916
9. Kuipers S, Overmars LM, van Es B, A cluster of blood-based protein biomarkers reflecting coagulation relates to the burden of cerebral small vessel disease: J Cereb Blood Flow Metab, 2022; 42(7); 1282-93
10. Reikvam H, Steien E, Hauge B, Thrombelastography: Transfus Apher Sci, 2009; 40(2); 119-23
11. Giese AK, Schirmer MD, Dalca AVInternational Stroke Genetics Consortium and the MRI-GENIE Investigators, White matter hyperintensity burden in acute stroke patients differs by ischemic stroke subtype: Neurology, 2020; 95(1); e79-e88
12. Han SW, Song TJ, Bushnell CD, Serum uric acid is associated with cerebral white matter hyperintensities in patients with acute lacunar infarction: J Neuroimaging, 2016; 26(3); 351-54
13. Guo Q, He Y, Liu X, Features of hyperintense white matter lesions and clinical relevance in systemic lupus erythematosus: Chin Med J (Engl), 2022; 135(8); 962-70
14. Wardlaw JM, Smith C, Dichgans M, Small vessel disease: Mechanisms and clinical implications: Lancet Neurol, 2019; 18(7); 684-96
15. Björkegren JLM, Lusis AJ, Atherosclerosis: Recent developments: Cell, 2022; 185(10); 1630-45
16. Sreeramkumar V, Adrover JM, Ballesteros I, Neutrophils scan for activated platelets to initiate inflammation: Science, 2014; 346(6214); 1234-38
17. Opal SM, Phylogenetic and functional relationships between coagulation and the innate immune response: Crit Care Med, 2000; 28(9 Suppl); S77-80
18. Martiskainen M, Pohjasvaara T, Mikkelsson J, Fibrinogen gene promoter-455 A allele as a risk factor for lacunar stroke: Stroke, 2003; 34(4); 886-91
19. Davalos D, Ryu JK, Merlini M, Fibrinogen-induced perivascular microglial clustering is required for the development of axonal damage in neuroinflammation: Nat Comm, 2012; 3; 1227
20. Iadecola C, The neurovascular unit coming of age: A journey through neurovascular coupling in health and disease: Neuron, 2017; 96(1); 17-42
21. Oberheiden T, Blahak C, Nguyen XD, Activation of platelets and cellular coagulation in cerebral small-vessel disease: Blood Coagul Fibrinolysis, 2010; 21(8); 729-35
22. Lordan R, Tsoupras A, Zabetakis I, Investigation of platelet aggregation in atherosclerosis: Methods Mol Biol, 2022; 2419; 333-47
23. Li J, Wu H, Hao Y, Yao X, Unstable carotid plaque is associated with coagulation function and platelet activity evaluated by thrombelastography: J Stroke Cerebrovasc Dis, 2019; 28(11); 104336
24. Zwartbol MH, van der Kolk AG, Kuijf HJUCC-SMART Study Group, Intracranial vessel wall lesions on 7T MRI and MRI features of cerebral small vessel disease: The SMART-MR study: J Cereb Blood Flow Metab, 2021; 41(6); 1219-28
25. Nam KW, Kwon HM, Lim JS, The presence and severity of cerebral small vessel disease increases the frequency of stroke in a cohort of patients with large artery occlusive disease: PLoS One, 2017; 12(10); e0184944
26. Bai T, Yu S, Feng J, Advances in the role of endothelial cells in cerebral small vessel disease: Front Neurol, 2022; 13; 861714
27. Liebeskind DS, Hinman JD, Kaneko N, Endothelial shear stress and platelet FcγRIIa expression in intracranial atherosclerotic disease: Front Neurol, 2021; 12; 646309
28. Jiang S, Wu S, Zhang S, Wu B, Advances in understanding the pathogenesis of lacunar stroke: From pathology and pathophysiology to neuroimaging: Cerebrovasc Dis, 2021; 50(5); 588-96
29. Madani A, Beletsky V, Tamayo A, High-risk asymptomatic carotid stenosis: Ulceration on 3D ultrasound vs TCD microemboli: Neurology, 2011; 77(8); 744-50
30. Corbin ZA, Rost NS, Lorenzano S, White matter hyperintensity volume correlates with matrix metalloproteinase-2 in acute ischemic stroke: J Stroke Cerebrovasc Dis, 2014; 23(6); 1300-6
31. Mao C, Xiong Y, Fan C, Comparison between thromboelastography and conventional coagulation assays in patients with deep vein thrombosis: Clin Chim Acta, 2021; 520; 208-13
Figures
Figure 1. The thromboelastography (TEG) parameters and cerebral small vessel disease MRI manifestations. Boxplots of the TEG parameters according to presence of white matter hyperintensities (WMH), enlarged perivascular spaces (EPVS), LI, and cerebral microbleeds (CMBs). P values were obtained from the Kruskal-Wallis test. (A) Boxplot of the relationship between MRI manifestations and maximum amplitude (MA). (B) Boxplot of the relationship between MRI manifestations and K. (C) Boxplot of the relationship between MRI manifestations and Angle. (D) Boxplot of the relationship between MRI manifestations and coagulation index (CI).Figure 2. Correlation heat map. We performed a spearman correlation test to evaluate the relation between predictors index of models.”*” indicates a significant correlation between parameters when P<0.05. “**” indicates a significant correlation when P<0.01. “***” indicates a significant correlation when P<0.001.Figure 3. Comparison of predictive performance between thromboelastography (TEG) and conventional coagulation tests (CCTs). (A) The ROC and AUC comparison for predicting white matter hyperintensities (WMH) (Fazekas score ≥2); (B) The ROC and AUC comparison for predicting small vessel disease (SVD; burden score ≥3). “*” indicates a significant correlation between parameters when P<0.05. “**” indicates a significant correlation when P<0.01. “***” indicates a significant correlation when P<0.001.Figure 4. Development of the risk prediction nomogram regression analysis. (A) Nomogram for the prediction of the risk of white matter hyperintensities (WMH) (Fazekas score ≥2). (B) Nomogram for the prediction of the risk of small vessel disease (SVD; burden score ≥3).Figure 5. The ROC curve comparison of prediction models. (A) ROC curve comparison for predicting white matter hyperintensities (WMH; Fazekas score ≥2). (B) ROC curve comparison for predicting small vessel disease (SVD); burden score ≥3).Figure 6. The bias-corrected calibration curves obtained by bootstrapping of prediction models. (A) Calibration curves for predicting white matter hyperintensities (WMH; Fazekas score ≥2). (B) Calibration curves for predicting small vessel disease (SVD; burden score ≥3). Tables
Table 1. Comparison of clinical data in acute ischemic stroke patients grouped according to small vessel disease (SVD) burden scored and Fazekas score.Table 2. Univariable logistic and ordinal regression analysis based on small vessel disease (SVD) burden scores and Fazekas scores.Table 3. Bidirectional stepwise logistic and ordinal regression analysis based on small vessel disease (SVD) burden scores and Fazekas scores.Table 4. Comparison of the AUC values for models base on different predictor indexes for predicting small vessel disease (SVD) burden score (≥3) and Fazekas score (≥2).Table 5. Comparison between the 2 models base on different predictor indexes for predicting small vessel disease (SVD) burden score (≥3) and Fazekas score (≥2). H-L.test.p is the P value for the Hosmer-Lemeshow test.Table 1. Comparison of clinical data in acute ischemic stroke patients grouped according to small vessel disease (SVD) burden scored and Fazekas score.Table 2. Univariable logistic and ordinal regression analysis based on small vessel disease (SVD) burden scores and Fazekas scores.Table 3. Bidirectional stepwise logistic and ordinal regression analysis based on small vessel disease (SVD) burden scores and Fazekas scores.Table 4. Comparison of the AUC values for models base on different predictor indexes for predicting small vessel disease (SVD) burden score (≥3) and Fazekas score (≥2).Table 5. Comparison between the 2 models base on different predictor indexes for predicting small vessel disease (SVD) burden score (≥3) and Fazekas score (≥2). H-L.test.p is the P value for the Hosmer-Lemeshow test. In Press
Clinical Research
Analysis of the Clinical Characteristics and Endoscopic Features of Phytobezoar-Induced Ulcers and Gastric ...Med Sci Monit In Press; DOI: 10.12659/MSM.952191
Clinical Research
Effect of Indirect Co-Culture With Gingival Mesenchymal Stem Cells on Cytokine Secretion in Primary Oral Sq...Med Sci Monit In Press; DOI: 10.12659/MSM.952439
Clinical Research
Comparison of Sleep Architecture in Individuals Aged 65 to 80 Years With and Without Mild Cognitive Impairm...Med Sci Monit In Press; DOI: 10.12659/MSM.952493
Clinical Research
Effects of Single-Bout Endurance Exercise Intensity on Peripheral Neurotrophic Factors in Patients With Isc...Med Sci Monit In Press; DOI: 10.12659/MSM.952089
Most Viewed Current Articles
17 Jan 2024 : Review article 14,176,514
Vaccination Guidelines for Pregnant Women: Addressing COVID-19 and the Omicron VariantDOI :10.12659/MSM.942799
Med Sci Monit 2024; 30:e942799
13 Nov 2021 : Clinical Research 3,760,677
Acceptance of COVID-19 Vaccination and Its Associated Factors Among Cancer Patients Attending the Oncology ...DOI :10.12659/MSM.932788
Med Sci Monit 2021; 27:e932788
14 Dec 2022 : Clinical Research 2,466,264
Prevalence and Variability of Allergen-Specific Immunoglobulin E in Patients with Elevated Tryptase LevelsDOI :10.12659/MSM.937990
Med Sci Monit 2022; 28:e937990
16 May 2023 : Clinical Research 708,906
Electrophysiological Testing for an Auditory Processing Disorder and Reading Performance in 54 School Stude...DOI :10.12659/MSM.940387
Med Sci Monit 2023; 29:e940387