27 July 2020: Database Analysis
Fibrinogen-Like Protein 2 (FGL2) is a Novel Biomarker for Clinical Prediction of Human Breast Cancer
Yanyan Feng1AC, Chunguang Guo2BC, Hesong Wang1B, Lu Zhao1CF, Wei Wang1C, Ting Wang1BC, Yuyin Feng3C, Kai Yuan1BCDF, Guangrui Huang3AEG*DOI: 10.12659/MSM.923531
Med Sci Monit 2020; 26:e923531


Abstract
BACKGROUND: Fibrinogen-like protein 2 (FGL2) is a member of the fibrinogen-like protein family and possesses important regulatory functions in both innate and adaptive immune responses. FGL2 is overexpressed in glioma, and its expression level is negatively associated with the prognosis of glioma patients. However, the diagnostic value of FGL2 is unknown in breast carcinoma.
MATERIAL AND METHODS: We comprehensively analyzed the expression pattern of FGL2 in breast cancer. Several online databases – TCGA, Oncomine, GEPIA, Kaplan-Meier plotter, and PrognoScan – were used in this study.
RESULTS: Based on the TCGA dataset and Oncomine database, we found that the expression level of FGL2 was remarkably lower in breast cancer compared with adjacent normal tissues. Clinical data showed that the expression level of FGL2 was significantly associated with radiation therapy, PR status, and tumor stage. Bioinformatics analysis of the GEPIA, Kaplan-Meier plotter, and PrognoScan databases showed that lower FGL2 expression levels were associated with a worse prognosis in breast cancer patients. Furthermore, the expression level of FGL2 was positively correlated with the immune cell infiltrations in breast cancer, especially those cells with high antitumor activities. GO, KEGG, and GSEA analyses also validated that FGL2 was closely related to genes involved in the immune response, signal transduction, and T cell receptor signaling pathway in breast cancer.
CONCLUSIONS: The results demonstrated that high expression of FGL2 is a useful marker for breast cancer treatment and appears to be correlated with enhanced antitumor activities in breast cancer patients.
Keywords: Fibrinogen, Lymphocytes, Tumor-Infiltrating, Aged, 80 and over, Biomarkers, Tumor, Breast Neoplasms, Databases, Genetic, Protein Interaction Maps
Background
Breast cancer is a common invasive cancer that is the second leading cause of cancer-related deaths in women [1]. It is estimated that more than 268 600 women were diagnosed with breast carcinoma in the USA in 2019 [2]. In women, breast cancer is responsible for 30% of all new cancer diagnoses in the USA. In East Asia, the morbidity rate of breast cancer rapidly increased in the last decade (3). In contrast to Western countries, more than 40% of cases occur in women under 50 years old in East Asia. Thus, breast cancer has become a heavy economic and social burden worldwide. Risk factors of breast cancer include genetic factors, environmental exposure, dietary factors, and increasing age [4].
Fibrinogen-like protein 2 (FGL2) belongs to the fibrinogen-like protein family [10], which is mainly expressed in macrophages, T cells, endothelial cells, and tumor cells. FGL2 is a vital immune regulator of both innate and adaptive responses, with pleiotropic effects [11]. It is usually confirmed to possess multifunctional activities and immune regulatory functions in inflammation, allograft rejection, and abortion. Furthermore, low levels of FGL2 can lead ti impaired Treg cell activities [12]. Alterations in FGL2 structure or expression level are correlated with deadly viral infections such as HIV and coronavirus [13,14]. Previous studies have demonstrated that upregulated FGL2 levels were associated with shorter overall survival in glioblastoma (GBM) patients [15]. However, the relationship between breast cancer and FGL2 has not been thoroughly explored.
In our study, we utilized bioinformatics methods to analyze the FGL2 expression pattern in breast cancer. TCGA datasets and the Oncomine database were employed to contrast FGL2 expression in breast cancer and normal adjacent tissues. The TCGA dataset was analyzed to assess the relationship between FGL2 and clinical characteristics of breast cancer patients. We used the online datasets PrognoScan, GEPIA, and Kaplan-Meier plotter to evaluate the prognostic potential of FGL2 in breast cancer, and the TIMER dataset was used to analyze the relationship between FGL2 and immune marker sets and tumor-infiltrating lymphocytes. The STRING website was utilized for FGL2 protein–protein interaction network screening. GO and KEGG calculates on the DAVID website were used to identify the main biological signatures of FGL2-correlated genes in breast cancer, and the GSEA dataset was used to analyze the biological functions of FGL2. The framework and concise content of this study are shown in Figure 1.
Material and Methods
PATIENTS AND SAMPLES:
The transcriptome profiles were downloaded from TCGA dataset. Multiple samples were used to avoid clinical and race bias in different studies. The expression level of the desired mRNA was normalized by R language for further analysis.
ONCOMINE DATABASE ANALYSIS:
In this study, the mRNA expression differences of FGL2 between cancers and adjacent normal tissues were investigated with the Oncomine databases. The threshold
GEPIA DATABASE ANALYSIS:
The prognostic potential of FGL2 in breast cancer was evaluated in the GEPIA database (
PROGNOSCAN DATABASE ANALYSIS:
The prognostic potential of FGL2 was validated in the PrognoScan dataset. Cox
KAPLAN-MEIER PLOTTER DATASET:
In this study, the association between FGL2 expression and prognosis of breast cancer was tested by Kaplan-Meier plotter. The log-rank
TIMER DATABASE ANALYSIS:
The TIMER database was utilized to visualize the correlation of FGL2 expression with immune cell infiltration in breast cancer. The infiltrated immune cells included CD8+ T cells, macrophages, B cells, CD4+ T cells, neutrophils, and dendritic cells. Furthermore, the associations between FGL2 and gene markers of tumor-infiltration immune cells were investigated with correlation modules.
PROTEIN–PROTEIN INTERACTION NETWORK CONSTRUCTION:
The STRING database was used to identify the protein–protein interactions of FGL2. The number of edges, number of nodes, average node degree, and PPI enrichment value can be evaluated by the STRING database. Nodes in the network were classified by their corresponding role in biological processes. Edges were classified based on the molecular function of FGL2. The connectivity degree of each protein node was calculated, and the top hub nodes were determined in the PPI network.
FUNCTIONAL ENRICHMENT ANALYSES:
Biological process (BP) of GO and KEGG analysis were performed in the DAVID website (
GENE SET ENRICHMENT ANALYSIS (GSEA):
GSEA is a statistical approach to assess whether the genes from particular pathways or other predefined gene sets show concordant differences or statistical significance between biological states. We used the hallmark gene set download from the GSEA website and 28 immune gene sets as the annotate data to analyze the different expression levels of FGL2 enrichment score in different pathways or immune cells. Gene sets with an FDR <10% and a nominal
STATISTICAL ANALYSIS:
The discrepancies in FGL2 expression were evaluated by
Results
:
Bioinformatics databases were utilized to evaluate the differential expression of FGL2 between breast cancer and adjacent normal tissues. TCGA database indicated that FGL2 was prominently lower in breast invasive carcinoma (BRCA) compared with that in matched normal tissue (Figure 2). The Oncomine database (Study Accession: EGAS00000000083) also showed that FGL2 expression was lower in breast cancer compared with adjacent normal tissue (P-value <1.01E-12, fold change=−2.578, Gene rank in top 1%). These results indicate that decreased FGL2 expression may be conducive to the tumorigenesis of breast cancer.
:
The TCGA database was used to assess the correlation between FGL2 expression and the clinical characteristics in breast cancer. Data of 1104 patients were collected from the TCGA dataset. As shown in Table 1, FGL2 expression was found to be significantly correlated with sex (P=0.004), radiation therapy (P=0.004), and PR status (P=0.013). Furthermore, FGL2 expression was also significantly different among tumor stages (P=0.038).
:
Three datasets (the GEPIA dataset, PrognoScan dataset, and KM plotter dataset) were utilized to explore the association between FGL2 level and breast carcinoma survival rate (Figure 3). In the GEPIA dataset, a lower FGL2 expression was correlated with a worse prognosis of disease-free survival (DFS) in breast cancer (DFS HR=0.53, log-rank P=0.015, cutoff-high=75%). In the PrognoScan database, 5 cohorts were analyzed, and the results showed that lower FGL2 was associated with poor prognosis of breast cancer patients (OS HR=0.59, 95% CI=0.35 to 0.99, Cox P=0.045139; DSS HR=0.60, 95% CI=0.37 to 0.99, Cox P=0.043958; DFS HR=0.73, 95% CI=0.58 to 0.94, Cox P=0.012526; DMFS HR=0.67, 95% CI=0.49 to 0.92, Cox P=0.013025; DMFS HR=0.29, 95% CI=0.14 to 0.60, Cox P=0.000852). Furthermore, the prognostic potential of FGL2 in breast cancer was also confirmed in the KM plotter dataset. Lower FGL2 was related to a unfavorable prognosis of breast cancer (OS HR=0.49, 95% CI=0.35 to 0.68, Cox P=1.3e-05; RFS HR=0.7, 95% CI=0.60 to 0.81, Cox P=4.9e-06; DMFS HR=0.68, 95% CI=0.49 to 0.94, Cox P=0.02).
:
A higher density of tumor-infiltrating lymphocytes (TILs) is an important parameter leading to better prognoses and therapeutic effects in the treatment of cancer. In this study, the TIMER dataset was utilized to investigate the relationship between FGL2 and TILs. The results showed that FGL2 was positively correlated with infiltrating levels of B cells (r=0.456, P=2.62e-51), CD8+ T cells (r=0.663, P=1.10e-124), CD4+ T cells (r=0.584, P=5.43e–89), macrophages (r=0.461, P=7.04e-53), and DCs (r=0.757, P=6.44e-178) in BRCA (Figure 4A). These results suggest that FGL2 has critical roles in immune cell infiltration in breast cancer.
Further analyses using the GSEA tool demonstrated that FGL2 was positively correlated with infiltrating levels of antitumor immune cells, such as activated CD8+ T cells (P=0), effector memory CD8+ T cells (P=0), type 1 T helper (Th1) cells (P=0), natural killer (NK) cells (P=0), activated CD4+ T cells (P=0), effector memory CD4+ T cells (P=0), natural killer T (NKT) cells (P=0.003), and central memory CD4+ T cells (P=0.014) (Figure 4B). These results show that higher FGL2 expression level is correlated with strong antitumor activities in breast cancer.
Apart from TILs, we also investigated the relationship between FGL2 expression and immune marker sets of diverse immune infiltrating cells. Detailed correlations between FGL2 and immune marker genes in breast cancer are listed in the Supplementary Tables 1 and 2. Generally speaking, FGL2 was positively correlated with immune marker sets in the TIMER database (Supplementary Table 1) and GEPIA database (Supplementary Table 2). HLA class II histocompatibility antigens are important factors in the antitumor immune response by presenting tumor-specific antigens to CD4+ T cells after phagocytosis of tumors by antigen-presenting cells (APCs). We found that 4 HLA class II genes (HLA-DPA1, HLA-DRA, HLA-DPB1, and HLA-DQB1) were positively correlated with FGL2 expression levels. Class II transcription activator (CIITA), which is responsible for HLA class II gene transcription, is also positively correlated with FGL2. Thus, these results showed that FGL2 can participate in the activities of antigen processing against tumors.
PROTEIN–PROTEIN INTERACTIONS RELATED TO FGL2 IN THE STRING DATABASE:
The STRING website was utilized to screen the protein–protein interactions related to FGL2. As shown in Figure 5, 21 nodes and 108 edges were filtered in the PPI network complex. Network nodes indicated proteins, and edges indicated the associations between protein and protein. The 10 most significant nodes were: MS4A6A, FGB, FGG, FGA, FGL1, F2, TYROBP, THBS1, FN1, and SERPINF2. In the network nodes, MS4A6A was correlated with FGL2 (score: 0.801). As a multimeric receptor complex, MS4A6A is involved in signal transduction. The results indicated that FGL2 contributes to signal transduction in the immune response correlated with MS4A6A.
FUNCTIONAL AND PATHWAY ENRICHMENT ANALYSIS:
Functional and pathway enrichment analyses were performed to investigate the main biological signatures of FGL2 in breast cancer. We analyzed the related genes by Spearman correlation analysis (|r| >0.6 and P<0.01). In total, 479 genes were identified in the TCGA dataset. Then, we performed GO and KEGG analysis in the DAVID website. GO analysis showed that FGL2-corralated genes were mainly enriched in immune response, signal transduction, leukocyte migration, T cell costimulation/differentiation/proliferation/activation, B cell receptor signaling pathway, and B cell proliferation (Figure 6A). KEGG pathway analysis showed that FGL2-corralated genes were mostly associated with cell adhesion molecules in breast cancer. Additionally, KEGG pathway analysis suggested that FGL2-correlated genes were also associated with other canonical immune pathways, including cytokine-cytokine receptor interaction, chemokine signaling pathway, and T cell receptor signaling pathway (Figure 6B).
To validate the results calculated in the DAVID website, we used a microarray dataset to investigate the biological signatures of FGL2 in breast cancer on the website of the European Bioinformatics Institute (EMBL-EBI). In total, 185 genes were found in the microarray meta-dataset of breast cancer (E-MTAB-6703). GO analysis and KEGG pathway analysis showed similar results to TCGA dataset analyses (Figure 6C, 6D). These results demonstrated that FGL2 was positively correlated with immune signaling pathways.
GENE SET ENRICHMENT ANALYSIS (GSEA):
For validation, we used GSEA analysis to predict the biological function of FGL2 in breast cancer. As shown in Figure 7, GSEA suggested that increased FGL2 expression was positively associated with the inflammatory response in breast cancer. The results also indicated that FGL2 was positively correlated with inflammatory signaling pathways, including the IFN-γ response, IFN-α response, and apoptosis. FGL2 was negatively correlated with MYC targets V2, oxidative phosphorylation, DNA repair, and unfolded protein response.
Discussion
FGL2 is a member of the fibrinogen superfamily of proteins, which are mainly expressed by inflammatory cells, including macrophages, CD4+ T, CD8+ T, and endothelial cells [10]. FGL2 can oligomerize into a tetramer by forming interchain disulfide bonds. Previous studies have demonstrated that FGL2 exhibits pleiotropic effects in the immune system. Liu et al. found that FGL2 contributes to complement activation and coagulation in virus-induced fulminant hepatitis [16]. Sun et al. showed that FGL2 regulates the functions of T cells in cirrhotic patients with hepatocellular carcinoma [17]. Khattar et al. reported that mice deficient in FGL2 have increased early viral replication of acute viral hepatitis [18]. Owing to the important role of FGL2 in immune regulation, this protein has attracted increasing attention in recent years.
Cancer is a type of disease involving abnormal cell growth correlated with abnormal immune system function. Researchers have focused on the relationship between FGL2 and several types of cancers. Birkhauser et al. found that a mouse renal carcinoma model had elevated expression levels of
In our study, we examined
Another aspect in our study is the relationship between
Furthermore, we evaluated the protein–protein interaction related to FGL2 in the STRING database. The PPI network complex showed that FGL2 was correlated with MS4A6A, FGB, FGG, FGA, FGL1, F2, TYROBP, THBS1, FN1, and SERPINF2. MS4A6A is a member of the membrane-spanning 4A gene family and participates in signal transduction as a factor in a multimeric receptor complex [21]. FGB together with FGG and FGA polymerizes to form an insoluble fibrin matrix, which participates in cell migration [22]. FGL1 is a member of the fibrinogen family of proteins, which also includes FGL2 [23]. F2 functions include inflammation and wound healing. TYROBP is a transmembrane signaling polypeptide involved in signal transduction [24]. THBS1 mediates cell-to-matrix and cell-to-cell interactions [25]. FN1 is involved in cell adhesion and migration processes [26]. SERPINF2 is a member of the serpin family of serine protease inhibitors. FGL2 is correlated with signal transduction, cell adhesion, cell-to-cell interactions, and inflammation by interacting with other proteins. We also used GO and KEGG analysis to analyze biological functions and related pathways of
Finally, we performed GSEA analysis to investigate the biological functions of FGL2 associated with breast cancer. FGL2 was positively correlated with the inflammatory response. Increased
Conclusions
In summary, we showed that
Figures
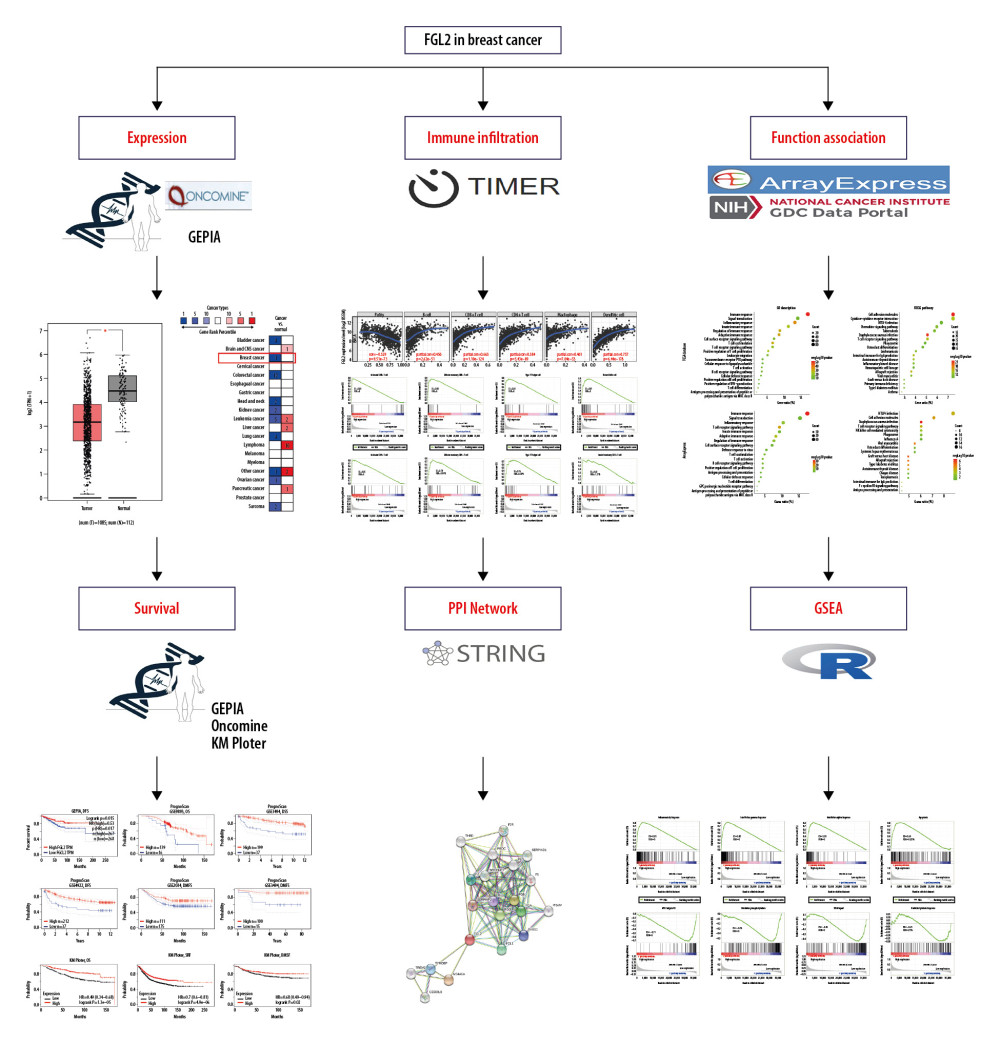 Figure 1. Schematic diagram of the study.
 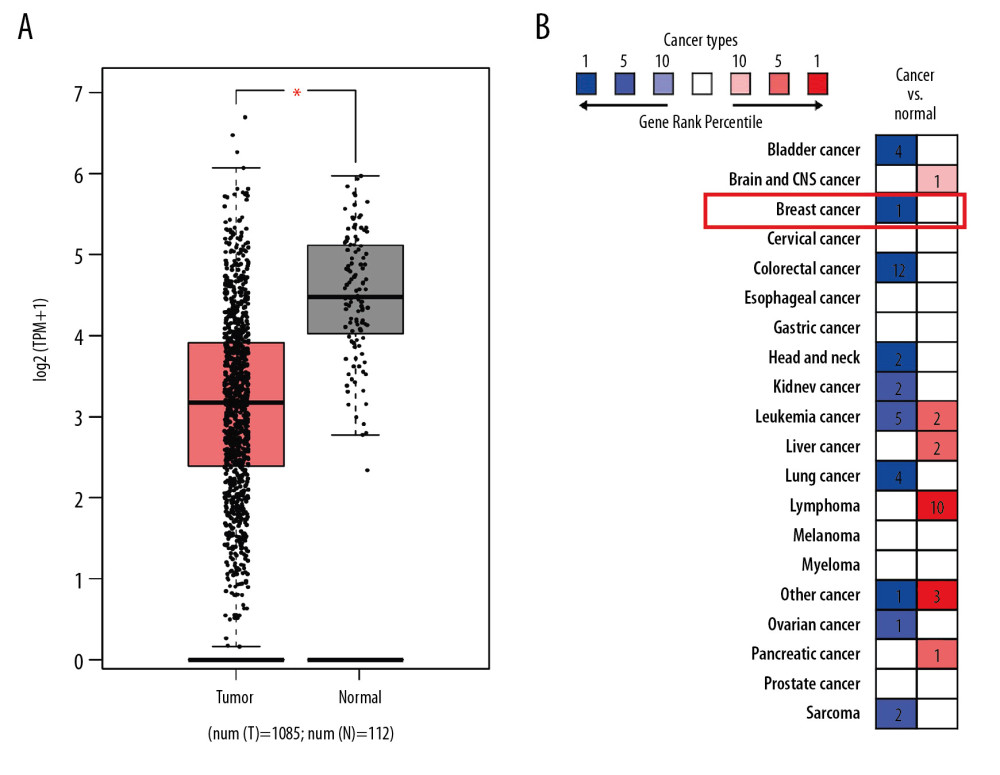 Figure 2. FGL2 expression levels in breast cancer. (A) FGL2 expression levels are significantly lower in breast cancer tissue than levels in adjacent normal tissues in the TCGA database. The left bar represents FGL2 levels in breast cancer tissue. The right bar represents FGL2 levels in matched normal data. (* P<0.05). (B) FGL2 expression in different cancers compared with adjacent normal tissues in the Oncomine database. Threshold (P-value): 1E-4. Threshold (fold change): 2. Threshold (gene rank): top 10%.
 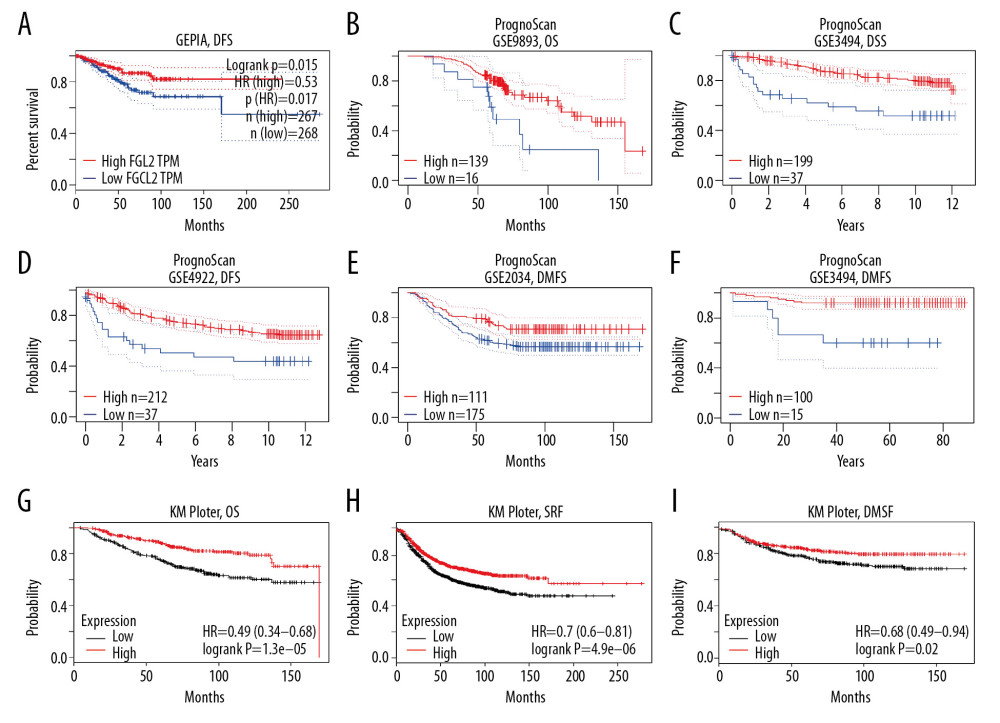 Figure 3. Survival rates for FGL2 in breast cancer. The GEPIA database, PrognoScan database, and Kaplan-Meier plotter database were used to analyze the prognostic potential of FGL2 in breast cancer. (A) In the GEPIA database, a lower expression level of FGL2 was associated with a poor prognosis of disease-free survival (DFS) in breast cancer. (B–F) In the PrognoScan database, GSE9893, GSE3494, GSE4922, GSE2034, and GSE19615 were used to evaluate overall survival (OS), disease-specific survival (DSS), disease-free survival (DFS), and distant metastasis-free survival (DMFS), respectively. (G–I) The Kaplan-Meier plotter database was used to measure OS, relapse-free survival (RFS), and DMFS related to FGL2 in breast cancer.
 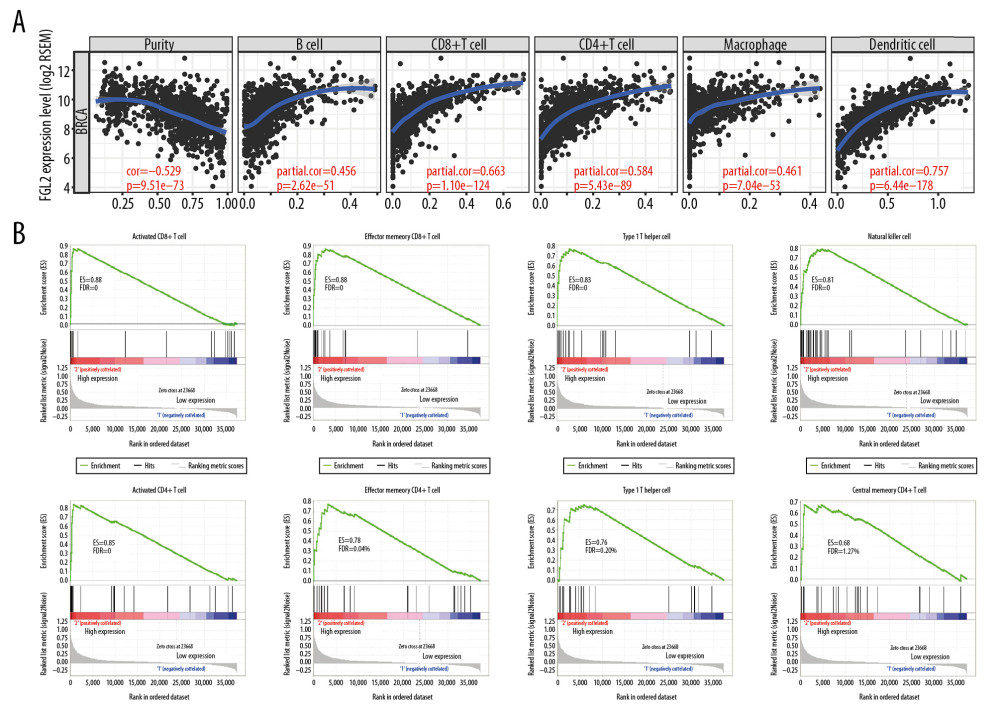 Figure 4. The correlation between FGL2 expression and immune status in the tumor microenvironment. (A) The FGL2 expression level was positively correlated with infiltrating levels of B cells, CD8+ T cells, CD4+ T cells, macrophages, neutrophils, and DCs in BRCA. (B) The FGL2 expression level was positively correlated with infiltrating levels of antitumor immune cells, such as activated CD8+ T cells, effector memory CD8+ T cells, Th1 cells, NK cells, activated CD4+ T cells, effector memory CD4+ T cells, NKT cells, and central memory CD4+ T cells. (ES – enrichment score; FDR – false discovery rate).
 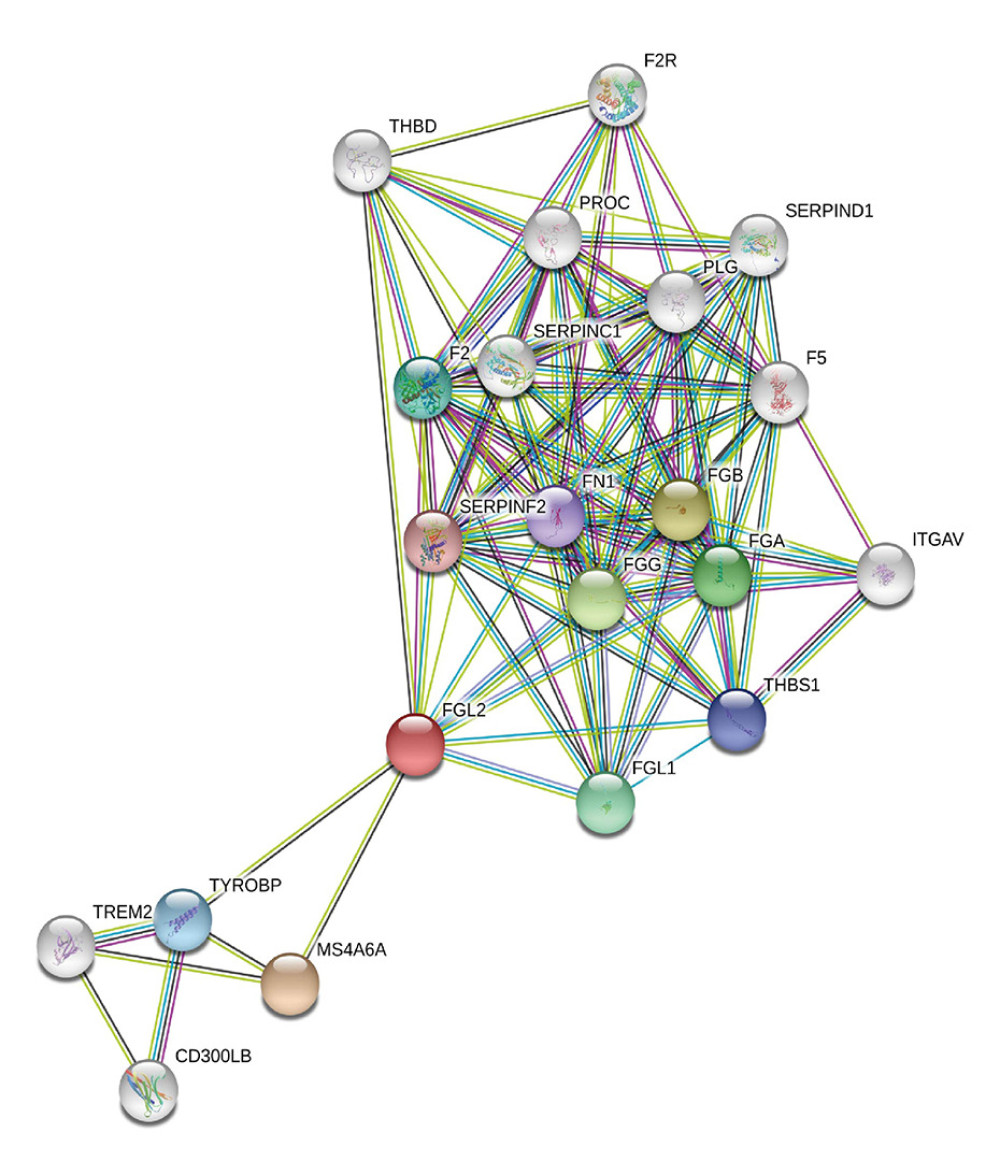 Figure 5. Modular analysis of the protein–protein interaction (PPI) network complex. In the STRING database, 21 proteins were filtered in the network complex. The PPI module consisted of 21 nodes and 108 edges. The average local clustering coefficient was 0.78. The PPI enrichment P-value was less than 1.0e-16. The top 5 predicted functional partners were MS4A6A (score: 0.801), FGB (score: 0.781), FGG (score: 0.776), FGA (score: 0.768), and FGL1 (score: 0.748). The blue and purple edges are considered known interactions. Green, red, and deep blue edges are predicted interactions. Orange, black, and light blue represent text mining, coexpression, and protein homology, respectively.
 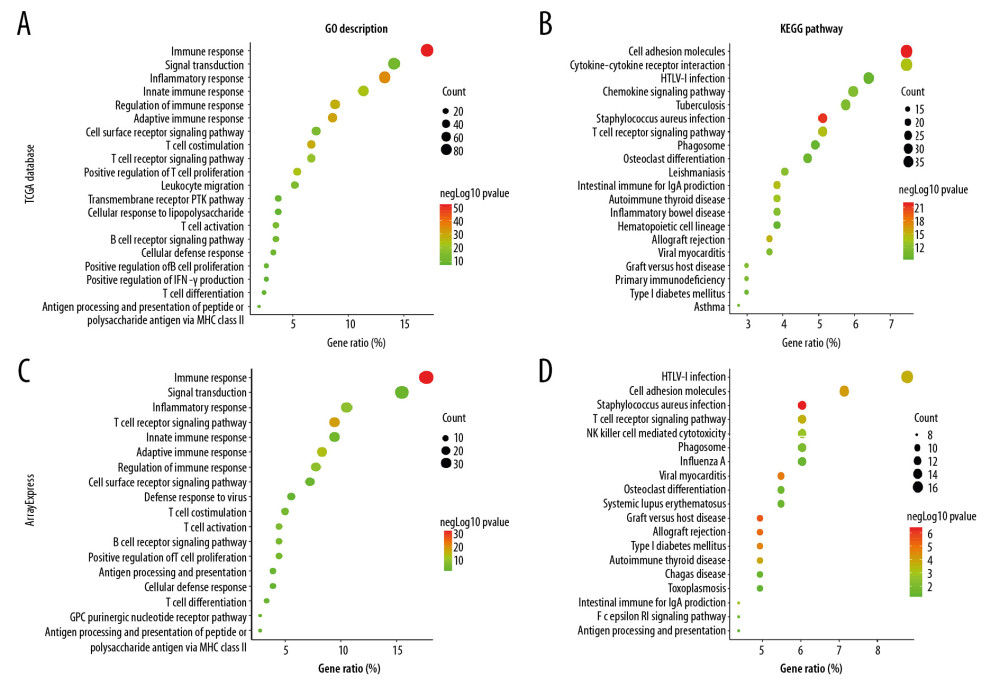 Figure 6. GO analysis and KEGG pathway analysis of FGL2-related genes in breast cancer. (A) GO analysis of FGL2 in breast cancer with the TCGA database. FGL2 was correlated with the immune response, signal transduction, and inflammatory response. (B) KEGG pathway analysis of FGL2 in breast cancer with the TCGA database. FGL2 was correlated with cell adhesion molecules and cytokine-cytokine receptor interactions. (C) GO analysis of FGL2 in breast cancer with the ArrayExpress dataset. FGL2 was correlated with the immune response, signal transduction, and inflammatory response. (D) KEGG pathway analysis of FGL2 in breast cancer with the ArrayExpress dataset. FGL2 was correlated with HTLV-1 infection and cell adhesion molecules.
 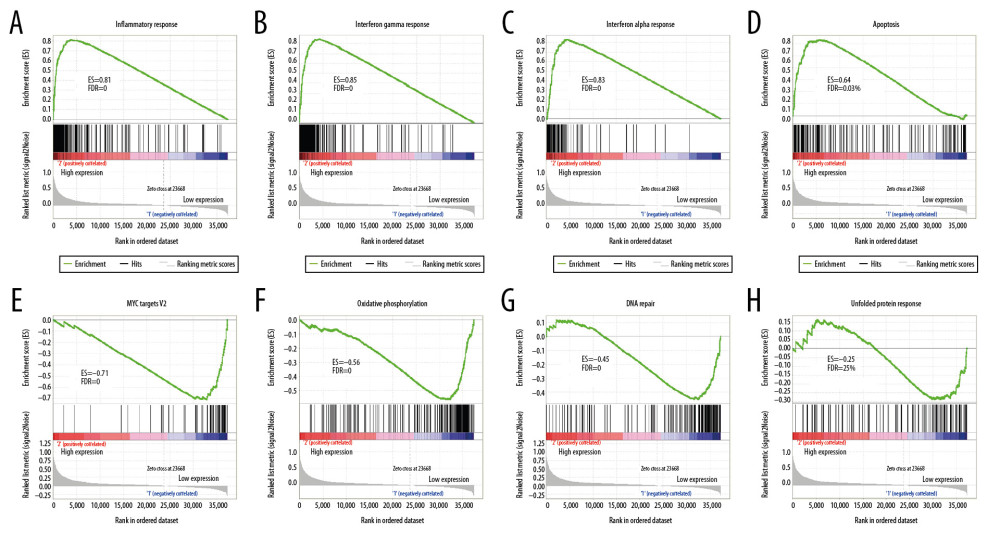 Figure 7. GSEA was used to predict the biological functions of FGL2 in breast cancer. (A) Inflammatory response, (B) Interferon-gamma response, (C) Interferon-alpha response, (D) Apoptosis, (E) MYC targets V2, (F) Oxidative phosphorylation (G) DNA repair, (H) Unfolded protein response. (ES – enrichment score; FDR – false discovery rate).
 Tables
Table 1. Association of FGL2 with the clinical pathological characteristics of breast cancer patients derived from the TCGA database.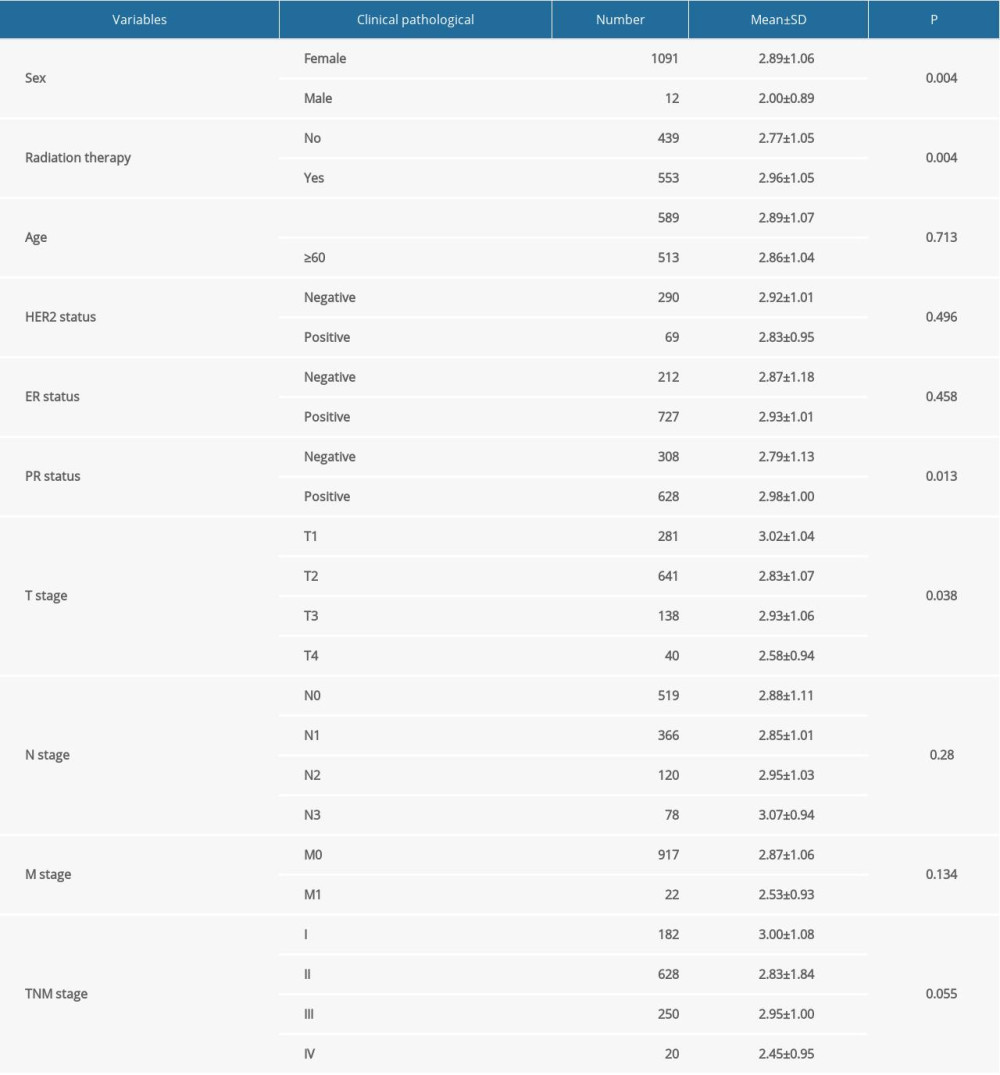 Supplementary Table 1. FGL2 was positively correlated with most immune marker sets in the TIMER database.
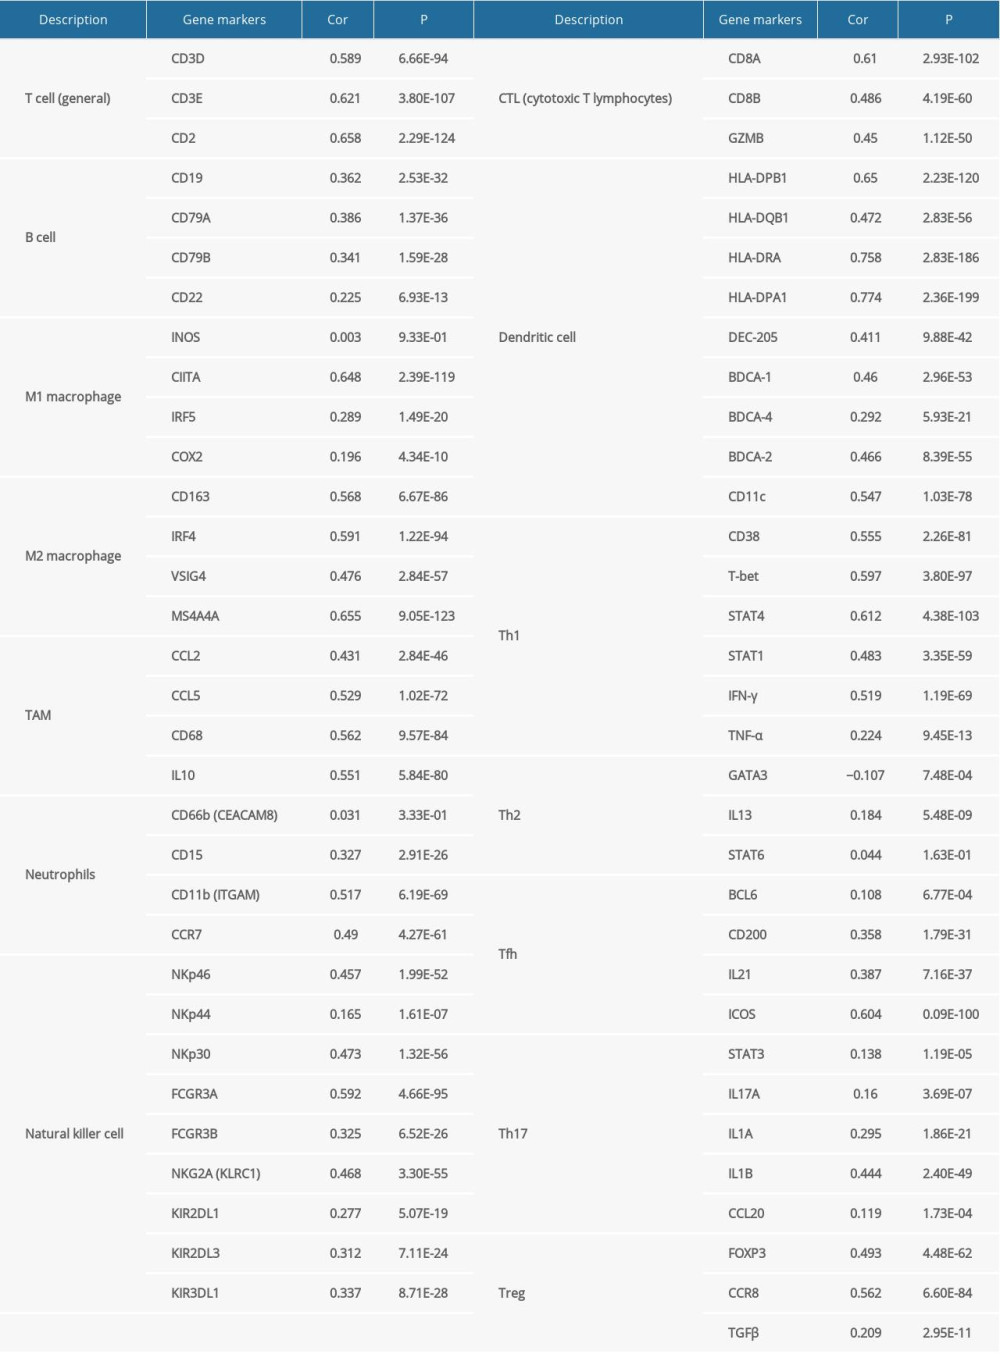 Supplementary Table 2. FGL2 was positively correlated with most immune marker sets in the GEPIA database.
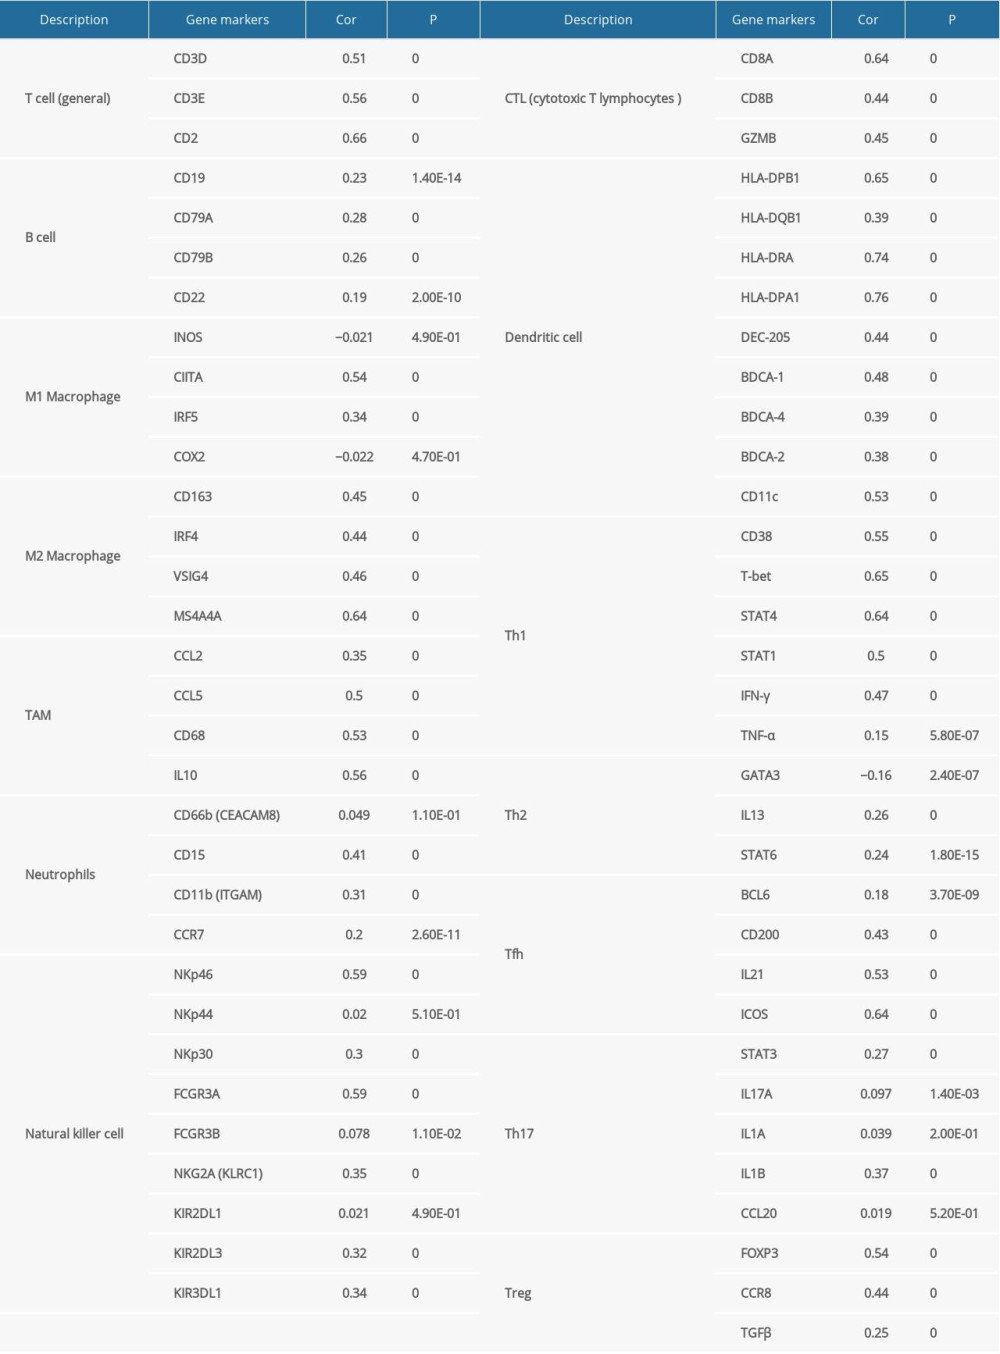
References
1. Elmore JG, Screening for breast cancer: JAMA, 2005; 293; 1245-56
2. Siegel RL, Miller KD, Jemal A, Cancer statistics, 2019: A Cancer J Clin, 2019; 69; 7-34
3. Fan L, Strasser-Weippl K, Li J-L, Breast cancer in China: Lancet Oncol, 2014; 15(7); 279-89
4. Winters S, Martin C, Breast cancer epidemiology, prevention, and screening: Prog Mol Biol Transl Sci, 2017; 151; 1-32
5. Afghahi A, Kurian AW, The changing landscape of genetic testing for inherited breast cancer predisposition: Curr Treat Options Oncol, 2017; 18(5); 27
6. Harbeck N, Gnant M, Breast cancer: Lancet, 2017; 389; 1134-50
7. Matsen CB, Neumayer LA, Breast cancer: A review for the general surgeon: JAMA Surg, 2013; 148; 971-79
8. Pernas S, Barroso Sousa R, Tolaney SM, Optimal treatment of early stage HER2-positive breast cancer: Cancer, 2018; 124; 4455-66
9. Rossing M, Sørensen CS, Ejlertsen B, Nielsen FC, Whole genome sequencing of breast cancer: APMIS, 2019; 127; 303-15
10. Liu X, Liu Y, Chen F, Soluble fibrinogen like protein 2 (sFGL2), the novel effector molecule for immunoregulation: Oncotarget, 2017; 8; 3711-23
11. Yang G, Physiological functions and clinical implications of fibrinogen-like 2: A review: World J Clin Infect Dis, 2013; 3; 37-46
12. Shalev I, Targeted deletion of fgl2 leads to impaired regulatory T cell activity and development of autoimmune glomerulonephritis: J Immunol, 2008; 180; 249-60
13. Hsieh Y, Chen CWS, Schmitz SH, Candidate genes associated with susceptibility for SARS-coronavirus: Bull Math Biol, 2010; 72; 122-32
14. Li Q, Smith AJ, Schacker TW, Microarray analysis of lymphatic tissue reveals stage-specific, gene expression signatures in HIV-1 infection: J Immunol, 2009; 183; 1975-82
15. Yan J, Kong L, Hu J, FGL2 as a multimodality regulator of tumor-mediated immune suppression and therapeutic target in gliomas: J Natl Cancer Inst, 2015; 107(8) djv137
16. Liu J, Tan Y, Zhang J, C5aR, TNF-a, and FGL2 contribute to coagulation and complement activation in virus-induced fulminant hepatitis: J Hepatol, 2015; 62; 354-62
17. Sun Y, Xi D, Ding W, Soluble FGL2, a novel effector molecule of activated hepatic stellate cells, regulates T-cell function in cirrhotic patients with hepatocellular carcinoma: Hepatol Int, 2014; 8; 567-75
18. Khattar R, Luft O, Yavorska N, Targeted deletion of FGL2 leads to increased early viral replication and enhanced adaptive immunity in a murine model of acute viral hepatitis caused by LCMV WE: PLoS One, 2013; 8; e72309
19. Birkhäuser FD, Koya RC, Neufeld C, Dendritic cell-based immunotherapy in prevention and treatment of renal cell carcinoma: J Immunother, 2013; 36; 102-11
20. Yan J, Zhao Q, Gabrusiewicz K, FGL2 promotes tumor progression in the CNS by suppressing CD103+ dendritic cell differentiation: Nat Commun, 2019; 10; 488
21. Liang Y, Buckley TR, Tu L, Structural organization of the human MS4A gene cluster on chromosome 11q12: Immunogenetics, 2001; 53; 357-68
22. Espitia Jaimes C, Fish RJ, Neerman-Arbez M, Local chromatin interactions contribute to expression of the fibrinogen gene cluster: J Thromb Haemost, 2018; 16; 2070-82
23. Nagdas SK, Winfrey VP, Olson GE, Two fibrinogen-like proteins, FGL1 and FGL2, are disulfide-linked subunits of oligomers that specifically bind nonviable spermatozoa: Int J Biochem Cell Biol, 2016; 80; 163-72
24. Tomasello E, Vivier E, KARAP/DAP12/TYROBP: Three names and a multiplicity of biological functions: Eur J Immunol, 2005; 35; 1670-77
25. Polymeropoulos MH, XHRD: Dinucleotide repeat polymorphism at the human thrombospondin gene (THBS1): Nucleic Acids Res, 1990; 18; 7467
26. Staunton D, MCAA: Preparation of recombinant fibronectin fragments for functional and structural studies: Methods Mol Biol, 2009; 522; 73-99
27. Unanue ER, Turk V, Neefjes J, Variations in MHC class II antigen processing and presentation in health and disease: Annu Rev Immunol, 2016; 34; 265-97
Figures
Figure 1. Schematic diagram of the study.Figure 2. FGL2 expression levels in breast cancer. (A) FGL2 expression levels are significantly lower in breast cancer tissue than levels in adjacent normal tissues in the TCGA database. The left bar represents FGL2 levels in breast cancer tissue. The right bar represents FGL2 levels in matched normal data. (* P<0.05). (B) FGL2 expression in different cancers compared with adjacent normal tissues in the Oncomine database. Threshold (P-value): 1E-4. Threshold (fold change): 2. Threshold (gene rank): top 10%.Figure 3. Survival rates for FGL2 in breast cancer. The GEPIA database, PrognoScan database, and Kaplan-Meier plotter database were used to analyze the prognostic potential of FGL2 in breast cancer. (A) In the GEPIA database, a lower expression level of FGL2 was associated with a poor prognosis of disease-free survival (DFS) in breast cancer. (B–F) In the PrognoScan database, GSE9893, GSE3494, GSE4922, GSE2034, and GSE19615 were used to evaluate overall survival (OS), disease-specific survival (DSS), disease-free survival (DFS), and distant metastasis-free survival (DMFS), respectively. (G–I) The Kaplan-Meier plotter database was used to measure OS, relapse-free survival (RFS), and DMFS related to FGL2 in breast cancer.Figure 4. The correlation between FGL2 expression and immune status in the tumor microenvironment. (A) The FGL2 expression level was positively correlated with infiltrating levels of B cells, CD8+ T cells, CD4+ T cells, macrophages, neutrophils, and DCs in BRCA. (B) The FGL2 expression level was positively correlated with infiltrating levels of antitumor immune cells, such as activated CD8+ T cells, effector memory CD8+ T cells, Th1 cells, NK cells, activated CD4+ T cells, effector memory CD4+ T cells, NKT cells, and central memory CD4+ T cells. (ES – enrichment score; FDR – false discovery rate).Figure 5. Modular analysis of the protein–protein interaction (PPI) network complex. In the STRING database, 21 proteins were filtered in the network complex. The PPI module consisted of 21 nodes and 108 edges. The average local clustering coefficient was 0.78. The PPI enrichment P-value was less than 1.0e-16. The top 5 predicted functional partners were MS4A6A (score: 0.801), FGB (score: 0.781), FGG (score: 0.776), FGA (score: 0.768), and FGL1 (score: 0.748). The blue and purple edges are considered known interactions. Green, red, and deep blue edges are predicted interactions. Orange, black, and light blue represent text mining, coexpression, and protein homology, respectively.Figure 6. GO analysis and KEGG pathway analysis of FGL2-related genes in breast cancer. (A) GO analysis of FGL2 in breast cancer with the TCGA database. FGL2 was correlated with the immune response, signal transduction, and inflammatory response. (B) KEGG pathway analysis of FGL2 in breast cancer with the TCGA database. FGL2 was correlated with cell adhesion molecules and cytokine-cytokine receptor interactions. (C) GO analysis of FGL2 in breast cancer with the ArrayExpress dataset. FGL2 was correlated with the immune response, signal transduction, and inflammatory response. (D) KEGG pathway analysis of FGL2 in breast cancer with the ArrayExpress dataset. FGL2 was correlated with HTLV-1 infection and cell adhesion molecules.Figure 7. GSEA was used to predict the biological functions of FGL2 in breast cancer. (A) Inflammatory response, (B) Interferon-gamma response, (C) Interferon-alpha response, (D) Apoptosis, (E) MYC targets V2, (F) Oxidative phosphorylation (G) DNA repair, (H) Unfolded protein response. (ES – enrichment score; FDR – false discovery rate). Tables
Table 1. Association of FGL2 with the clinical pathological characteristics of breast cancer patients derived from the TCGA database.Table 1. Association of FGL2 with the clinical pathological characteristics of breast cancer patients derived from the TCGA database.Supplementary Table 1. FGL2 was positively correlated with most immune marker sets in the TIMER database.Supplementary Table 2. FGL2 was positively correlated with most immune marker sets in the GEPIA database. In Press
Clinical Research
Body Weight and Insulin Resistance Indicators Among ChildrenMed Sci Monit In Press; DOI: 10.12659/MSM.951434
Clinical Research
Comparison of Radiographic Cervical Sagittal Alignment Parameters in Patients With Nonspecific Neck Pain, D...Med Sci Monit In Press; DOI: 10.12659/MSM.952950
Clinical Research
Combined Fibrinogen and Urinary α1-Microglobulin as Predictors of Respiratory Tract Infection in Children w...Med Sci Monit In Press; DOI: 10.12659/MSM.951066
Database Analysis
Evaluation of Salivary Total Oxidant Status (TOS) and Total Antioxidant Status (TAS) in Orthodontic Patient...Med Sci Monit In Press; DOI: 10.12659/MSM.952052
Most Viewed Current Articles
17 Jan 2024 : Review article 14,175,576
Vaccination Guidelines for Pregnant Women: Addressing COVID-19 and the Omicron VariantDOI :10.12659/MSM.942799
Med Sci Monit 2024; 30:e942799
13 Nov 2021 : Clinical Research 3,756,620
Acceptance of COVID-19 Vaccination and Its Associated Factors Among Cancer Patients Attending the Oncology ...DOI :10.12659/MSM.932788
Med Sci Monit 2021; 27:e932788
14 Dec 2022 : Clinical Research 2,465,966
Prevalence and Variability of Allergen-Specific Immunoglobulin E in Patients with Elevated Tryptase LevelsDOI :10.12659/MSM.937990
Med Sci Monit 2022; 28:e937990
16 May 2023 : Clinical Research 708,651
Electrophysiological Testing for an Auditory Processing Disorder and Reading Performance in 54 School Stude...DOI :10.12659/MSM.940387
Med Sci Monit 2023; 29:e940387