25 October 2020: Database Analysis
Expression and Prognostic Analyses of ITGA3, ITGA5, and ITGA6 in Head and Neck Squamous Cell Carcinoma
Chen Feng12ABCDEF, Xiaoxue Jin12ABCD, Yingying Han12ABCD, Ruixiang Guo12ABC, Juanjuan Zou12CDE, Yanzhong Li12DEFG, Yan Wang12DEFG*DOI: 10.12659/MSM.926800
Med Sci Monit 2020; 26:e926800


Abstract
BACKGROUND: The landscape of head and neck cancers has changed with improvements in standard therapy; however, it is necessary to exploit advanced genomic approaches to identify novel diagnostic and prognostic biomarkers for head and neck squamous cell carcinoma (HNSC). ITGA3, ITGA5, and ITGA6, members of the integrin family of proteins, play active roles in cytoskeletal organization and cell migration, proliferation, and survival. However, the expression patterns and prognostic values of ITGA3, ITGA5, and ITGA6 in head and neck squamous cell carcinoma remain unclear.
MATERIAL AND METHODS: Different expression patterns and prognostic values of ITGA3, ITGA5, and ITGA6 were analyzed in patients with HNSC using various databases, including ONCOMINE, GEPIA, TIMER, HPA, Kaplan-Meier Plotter, GEO, and TCGA.
RESULTS: Expression levels of ITGA3, ITGA5, and ITGA6 were substantially increased in patients with HNSC. Additionally, higher expression levels of ITGA3, ITGA5, and ITGA6 were associated with worse overall survival in patients with HNSC, and higher levels of ITGA3 correlated with a worse relapse-free survival.
CONCLUSIONS: ITGA3, ITGA5, and ITGA6 are potential diagnostic and prognostic biomarkers for HNSC. In particular, IGTA5 might be used as a significant independent prognostic factor in this cancer.
Keywords: Medical Oncology, Biomarkers, Tumor, Databases, Genetic, Integrin alpha3, Integrin alpha6, Integrins, Squamous Cell Carcinoma of Head and Neck
Background
Each year approximately 600 000 people worldwide are diagnosed with head and neck squamous cell carcinoma (HNSC), which has a 40% to 50% mortality rate [1]. HNSC occurs in the mucous membranes of the oropharynx, nasopharynx, larynx, oral cavity, and hypopharynx [2]. In addition, there has been no change in the 5-year survival of patients with HNSC for more than 20 years because of the occurrence of distant metastasis and local recurrence [3]. More than 60% of patients with HNSC are diagnosed at an advanced stage (phase III or IV) due to difficulties in early diagnosis, large tumors with major local invasion, and metastases in regional nodes. The landscape of head and neck cancers has changed with improvements in standard therapy, such as minimally invasive, organ-sparing surgical techniques, advances in radiotherapy, and curative multimodal approaches [4]. Although the development of programmed death 1 immune checkpoint inhibitors has an important role in HNSC treatment, these targeted molecular therapies do not considerably benefit patients with HNSC [4,5]. Thus, it is necessary to exploit advanced genomic approaches to find novel diagnostic and prognostic biomarkers for HNSC.
Integrins are heterodimeric transmembrane receptors consisting of α and β subunits, constituting a well-established family of approximately 24 α and β subtypes [6]. As cell adhesion receptors, integrins mediate cell-to-cell and cell-to-extracellular matrix interactions; however, they also play significant roles in cytoskeletal organization and cell migration, proliferation, and survival through their roles in signal transduction [7]. ITGA3 functions as a surface adhesion molecule on the cell membrane [8], contacting extracellular matrix proteins of the laminin family, which are associated with tumors [9]. ITGA5, together with β1, forms a receptor for extracellular fibronectin, which is active in malignant tumor cells and tumor vasculature [6]. ITGA5 has been reported to act as an oncogene in hepatocellular carcinoma [10] and ovarian cancer [11]. Moreover, ITGA6 encodes integrin subunit α6, also known as CD49f, vla-6, or ITGA6B [12], and expression of ITGA6 in breast cancer is considerably decreased after the knockdown of thrombospondin-1, inducing a reduction in adhesion between cancer cells and the extracellular matrix and decreasing cancer angiogenesis [13]. Thus, ITGA3, ITGA5, and ITGA6 are strong biomarker candidates and therapeutic targets for HNSC.
Microarray analysis of gene expression is important in genetic and biomedical research [14]. In this study, we assessed data relating to HNSC using various well-constructed databases and platforms to examine HNSC expression and prognostic analyses based on ITGA3, ITGA5, and ITGA6.
Material and Methods
ONCOMINE ANALYSIS:
ONCOMINE was used as a test for ITGA3, ITGA5, and ITGA6 transcription levels in patients with HNSC [15,16]. The mRNA expression levels of ITGA3, ITGA5, and ITGA6 were compared between patients with different types of cancer and normal controls [17].
GENE EXPRESSION OMNIBUS ANALYSIS:
To confirm the expression profiles of ITGA3, ITGA5, and ITGA6 in HNSC, 6 microarray series, GSE2379, GSE6631, GSE29330, GSE53819, GSE58911, and GSE107591, containing tumor and nontumor samples were collected from the Gene Expression Omnibus (GEO) database.
GENE EXPRESSION PROFILING INTERACTIVE ANALYSIS:
The Gene Expression Profiling Interactive Analysis (GEPIA) database is an interactive service used between The Cancer Genome Atlas (TCGA) and the Genotype-Tissue Expression data system to examine mRNA levels of ITGA3, ITGA5, and ITGA6 [18]. GEPIA provided associations of ITGA3, ITGA5, and ITGA6 in HNSC.
HUMAN PROTEIN ATLAS ANALYSIS:
The Human Protein Atlas (HPA) was used to compare the protein expressions of ITGA3, ITGA5, and ITGA6 in patients with different kinds of human cancer with those of normal controls [19].
TUMOR IMMUNE ESTIMATION RESOURCE ANALYSIS (TIMER):
The Tumor IMmune Estimation Resource (TIMER) provides a detailed analysis of immune infiltration for specific cancers [20]. The TIMER database includes 32 cancers and 10 897 samples from TCGA [21]. TIMER was used to evaluate the expression levels of ITGA3, ITGA5, and ITGA6 in different cancers and the correlation of ITGA3, ITGA5, and ITGA6 expression with levels of immune infiltrates [22]. The somatic copy number alterations (SCNA) module in the TIMER database can relate the rate of tumor infiltration of a particular gene to various changes in somatic copy number. SCNA incorporate high amplification (2), arm-level gain (1), normal diploid (0), arm-level deletion (−1), and deep deletion (−2). For each SCNA group, the degree of infiltration was compared to the average using a 2-sided Wilcoxon test.
FUNCTIONAL ENRICHMENT ANALYSIS:
METASCAPE was applied for pathway and process enrichment analysis of ITGA3, ITGA5, and ITGA6 and adjacent genes significantly related to ITGA3, ITGA5, and ITGA6 alterations. The online METASCAPE resource enriched Gene Ontology (GO) terminology for biological process, cellular component, and molecular function categories as well as the Kyoto Genes and Genome Encyclopedia (KEGG). The molecular complex detection (MCODE) algorithm was used to classify strongly connected network components [23].
KAPLAN-MEIER PLOTTER ANALYSIS:
The Kaplan-Meier plotter is an interactive service containing microarray gene expression information and survival data from TCGA, GEO, and Cancer Biomedical Informatics Grid [23]. The OS and relapse-free survival (RFS) of patients with HNSC with high and low expressions of ITGA3, ITGA5, and ITGA6 were investigated [24].
TCGA ANALYSIS:
Level 3 TCGA-HNSC data points were obtained from the UCSC Xena platform [25] and RTCGA package. The RNA-seq gene expression data for HNSC involved 500 cancer samples, of which 483 patients had complete survival data. Univariate and multivariate Cox regression analyses of clinicopathological characteristics, including age, sex, clinical stage, histological grade, and OS time, were performed [17].
STATISTICAL ANALYSIS:
The mRNA expression of ITGA3, ITGA5, and ITGA6 between HNSC tissues and normal controls was compared using the t test. R software (3.6.1) (https:/www.r-Project.org/) was used for statistical analyses. Data visualization was carried out using the “ggstatsplot” package in R (https://CRAN.R-project.org/package=ggstatsplot). For TCGA-HNSC raw data, Kaplan-Meier curves of OS were drawn by selecting the median expression levels of ITGA3, ITGA5, and ITGA6 as the cut-offs. Significant differences were examined by the log-rank test. Univariate and multivariate survival analyses were conducted using the Cox regression model, and risk factors with P<0.05 according to univariate analysis were selected for multivariate analysis [17].
Results
EXPRESSION LEVELS OF ITGA3, ITGA5, AND ITGA6 IN PATIENTS WITH HNSC:
We utilized the ONCOMINE database to analyze the mRNA expression levels of ITGA3, ITGA5, and ITGA6 among patients with HNSC. In 13 HNSC datasets, the expression levels of ITGA3, ITGA5, and ITGA6 in most tumor tissues were higher than those in normal tissue (Table 1). For example, in Ginos’s dataset [26], ITGA3 was overexpressed in HNSC with a fold change of 2.207. In Peng’s dataset [27], ITGA3 was overexpressed in oral cavity squamous cell carcinoma with a fold change of 3.147. In Pyeon’s dataset [28], ITGA3 was overexpressed in tongue carcinoma with a fold change of 2.299. According to Talbot’s dataset [29], ITGA3 was overexpressed in tongue squamous cell carcinoma with a fold change of 2.068. In Estilo’s dataset [30], ITGA3 was overexpressed in tongue squamous cell carcinoma with a fold change of 3.789, and ITGA5 with a fold change of 3.027. ITGA5 overexpression in oral cavity squamous cell carcinoma with a fold change of 2.761 in Peng’s dataset [27] and in head and neck squamous cell carcinoma with a fold change of 2.307 in Ginos’s dataset [26] was also detected. For ITGA6 mRNA expression, Pyeon [28] reported a fold change of 2.757 in patients with tongue carcinoma and a fold change of 3.133 in patients with oropharyngeal carcinoma. In Estilo’s dataset [30], ITGA6 was overexpressed in tongue squamous cell carcinoma with a fold change of 6.290. According to Talbot’s dataset [29], ITGA6 was overexpressed in tongue squamous cell carcinoma with a fold change of 4.086. In Ye’s dataset [31], ITGA6 was overexpressed in tongue squamous cell carcinoma with a fold change of 2.958 (Table 1). For validation, we performed a meta-analysis of ITGA3, ITGA5, and ITGA6 expression with thresholds of P value ≤1E-4, fold change ≥2, and the top 10% gene rank in the ONCOMINE database. As illustrated in Figure 1, ITGA3, ITGA5, and ITGA6 were significantly upregulated in HNSC compared with normal tissues (P<0.0001).
The results of GEPIA analysis indicated that the mRNA levels of ITGA3, ITGA5, and ITGA6 in HNSC were considerably greater than those in normal tissues (Figure 2, P<1E-4).
Moreover, mRNA expression levels of ITGA3, ITGA5, and ITGA6 were analyzed in HNSC and normal tissues using the GEO series (Table 2). The GSE2379, GSE6631, GSE29330, GSE53819, GSE58911, and GSE107591 results showed substantial upregulation in tumor tissues compared with normal tissues (all P<0.05, Figures 3, 4).
To further evaluate ITGA3, ITGA5, and ITGA6 expression in patients with HNSC, RNA-seq data for multiple malignancies in TCGA were determined using ONCOMINE and TIMER, with results showing significantly higher expression levels (Supplementary Figure 1, P<0.0001; Supplementary Figure 2, P<0.001).
We also analyzed immunohistochemistry images using HPA to explore the expression of ITGA3, ITGA5, and ITGA6 proteins in HNSC. Compared with normal tissue, HNSC cancer tissues exhibited higher protein expression of all these integrins, as shown in Figure 5.
ITGA3, ITGA5, ITGA6 AND NEIGHBOR GENE NETWORK IN PATIENTS WITH HNSC:
GeneMANIA was employed to perform gene-level correlation analysis of ITGA3, ITGA5, and ITGA6 and neighboring genes (Figure 6A) revealing SPP1, ITGB1, LAMC3, CD151, CD9, RPSA, ITGB3, COL17A1, PLEC, COL18A1, ITGB4, HOXD3, COL4A3, ANGPTL3, THBS2, FHL2, ITGA2, LAMB3, LAMA3, and PMP22 to be closely associated. Moreover, STRING analysis was conducted to identify interactions between ITGA3, ITGA5, and ITGA6 and neighboring genes at the level of protein expression. In this analysis, ITGA5 showed interaction with ITGA6 in coexpression, text mining, and protein homology, and they were both closely associated with CD97, CD151, PLEC, ITGB4, TNN, ITGA2B, and ITGAV (Figure 6B). We evaluated the transcripts per kilobase million association among ITGA3, ITGA5, and ITGA6 in HNSC based on Pearson correlation using GEPIA data (Figure 7) and found positive correlations between ITGA3 and ITGA5 (r=0.62, P<0.001), ITGA3 and ITGA6 (r=0.65, P<0.001), and ITGA5 and ITGA6 (r=0.47, P<0.001).
EXPRESSION OF ITGA3, ITGA5, AND ITGA6 IN HNSC IS LINKED TO THE LEVEL OF IMMUNE INFILTRATION:
Sentinel lymph node status and survival are independent predictors of tumor lymph invasion [32], and the tumor purity of clinical samples is a significant factor when evaluating immune infiltration through genomic approaches [33]. In the present study, we investigated associations between the expression of ITGA3, ITGA5, and ITGA6 and immune cell populations using transcriptomic data for various molecular subtypes and the TCGA-HNSC cohort in TIMER (Figure 8). There were statistically significant negative correlations between the expression level of ITGA3 and tumor purity (r=−0.164, P=2.51e-04), B cells (r=−0.226, P=6.60e-07), CD8+ T cells (r=−0.174, P=1.41e-04), and macrophages (r=−0.067, P=1.42e-01) and a statistically significant positive correlations with infiltrating levels of CD4+ T cells (r=0.108, P=1.83e-02) and neutrophils (r=0.224, P=7.41e-07). Furthermore, there was no significant correlation observed between dendritic cells and ITGA3 expression (r=0.098, P=3.13e-02). In addition, the expression level of ITGA5 was significantly negatively correlated with B cells (r=−0.102, P=2.59e-02) and CD8+ T cells (r=−0.102, P=2.59e-02) and significantly positively correlated with infiltrating levels of CD4+ T cells (r=0.208, P=4.10e-06), macrophages (r=0.265, P=3.23e-09), neutrophils (r=0.180, P=7.27e-05), and dendritic cells (r=0.233, P=2.17e-07). However, ITGA5 expression did not have a significant correlation with tumor purity (r=−0.08, P=7.54e-02), whereas ITGA6 expression was significantly negatively correlated with B cells (r=−0.214, P=2.60e-06) and CD8+ T cells (r=−0.253, P=2.36e-08) and significantly positively correlated with infiltrating levels of CD4+ T cells (r=0.117, P=1.01e-02). Nevertheless, no significant correlations between ITGA6 and tumor purity (r=−0.087, P=5.31e-02), macrophages (r=−0.091, P=4.51e-02), neutrophils (r=0.091, P=4.77e-02) or dendritic cells (r=0.015, P=7.45e-01) were found.
Intriguingly, we found that ITGA3 expression levels had a statistically significant correlation with arm-level gain in CD8+ T cells (P=8.69e-05), neutrophils (P=4.92e-06), and dendritic cells (P=0.009). ITGA5 levels also had a statistically significant correlation with arm-level deletion in CD8+ T cells (P=6.52e-05), neutrophils (P=0.003) and dendritic cells (P=0.017), and arm-level gain in B cells (P=0.012). Moreover, ITGA6 expression correlated significantly with arm-level gain in CD8+ T cells (P=5.19e-13), CD4+ T cells (P<0.001), B cells (P=6.89e-05), macrophages (P=0.001), neutrophils (P=1.47e-11), and dendritic cells (P=8.26e-06) (Figure 9).
FUNCTIONAL ENRICHMENT ANALYSIS OF ITGA3, ITGA5, AND ITGA6 IN PATIENTS WITH HNSC:
GO and KEGG analyses in Metascape were carried out for ITGA3, ITGA5, and ITGA6 and neighboring genes. The top 21 GO enrichment items were detected as follows: 9 items in biological process, 6 items in molecular function, and 6 items in cellular component (Figure 10A, 10B and Table 3). ITGA3, ITGA5, and ITGA6 and related genes showed strong enrichment in the biological process categories hemidesmosome assembly, extracellular matrix organization, integrin-mediated signaling pathway, skin morphogenesis, angiogenesis, cell morphogenesis involved in differentiation, receptor internalization, regulation of endocytosis, and positive regulation of the apoptotic process. Molecular function enrichment was mainly found for transcriptional regulation by integrin binding, extracellular matrix binding, neuregulin binding, extracellular matrix structural constituent, sulfur compound binding, and cadherin binding. Among terms in cellular components, the basement membrane, integrin complex, hemidesmosome, collagen trimer, platelet alpha granule, and perinuclear region of cytoplasm were highlighted. The top 4 KEGG pathways for ITGA3, ITGA5, and ITGA6 and the related genes are presented in Figure 10C and 10D and Table 4, including extracellular matrix-receptor interaction, small cell lung cancer, arrhythmogenic right ventricular cardiomyopathy, and protein digestion and absorption.
Overall, the protein-protein enrichment analysis in Metascape demonstrated the involvement of ITGA3, ITGA5, and ITGA6 in HNSC. Figure 11A and 11B illustrate the network of protein-protein interactions and MCODE components in the gene lists, whereby the most critical components of MCODE are indicated by the interaction network among proteins. The results according to pathway and process enrichment analyses applied separately in MCODE showed that the biological roles of these proteins are mainly related to type I hemidesmosome assembly, and assembly of collagen fibrils and other multimeric structures.
ASSOCIATION OF INCREASED MRNA EXPRESSION OF ITGA3, ITGA5, AND ITGA6 WITH IMPROVED PROGNOSIS IN HNSC:
We further studied the relevance of ITGA3, ITGA5, and ITGA6 to the survival of patients with HNSC. To explore the association between mRNA levels of ITGA3, ITGA5, and ITGA6 and survival, Kaplan-Meier Plotter tools were applied to support publicly available data sets. Increasing ITGA3, ITGA5, and ITGA6 mRNA levels were significantly linked to OS (P<0.05) (Figure 12) among all patients with HNSC in the Kaplan-Meier curve and log-rank test analyses. For example, survival curves showed that high ITGA3 expression was related to poor RFS (P=0.017), whereas high levels of ITGA5 and ITGA6 mRNA did not appear to be (ITGA3-OS hazard ratio (HR)=1.73, 95% CI=1.30–2.29, P=0.00014; ITGA3-RFS HR=2.40, 95% CI=1.14–5.06, P=0.017; ITGA5-OS HR=1.63, 95% CI=1.25–2.31, P=0.00029; ITGA5-RFS HR=1.95, 95% CI=0.91–4.17, P=0.079; ITGA6-OS HR=1.70, 95% CI=1.30–2.23, P=1e-04; ITGA6-RFS HR=0.74, 95% CI=0.35–1.56, P=0.42). We subsequently performed Cox regression analysis to calculate the prognostic values of ITGA3, ITGA5, and ITGA6 in HNSC based on original TCGA data, which revealed that the high expression of these genes, age >65, and female sex to be associated with worse OS in HNSC (Table 5). In addition, multivariate Cox analysis showed high ITGA5 expression to be on the threshold of significance (HR=1.347; 95% CI [0.988–1.837]; P=0.059), and multivariate Cox analysis adjusted for high ITGA5 expression, age, and sex confirmed high ITGA5 expression as an independent prognostic biomarker in patients with HNSC (HR=1.466; 95% CI [1.108–1.940]; P=0.007; Supplementary Table 1). Conversely, there was a lack of significant findings for other genes with regard to OS in HNSC.
Discussion
ITGA3, ITGA5, and ITGA6 deregulation has been reported in numerous types of cancers. Although the effects of ITGA3, ITGA5, and ITGA6 on the tumorigenesis and prognosis of different cancers have been partially corroborated, advanced bioinformatics analysis of HNSC has yet to be conducted [34]. In fact, the present study is the first to explore the expression and prognostic value on OS and RFS of ITGA3, ITGA5, and ITGA6 in patients with HNSC. We carried out a comprehensive study of the patterns of expression and prognostic value of ITGA3, ITGA5, and ITGA6 in HNSC. We are confident that our findings will provide accessible knowledge that will contribute to an improvement in treatment modeling and prognostic accuracy for HNSC.
Previous research has found that ITGA3 can facilitate cancer development by activating the PI3K-Akt signaling pathway, which promotes the proliferation, migration, and invasion in multiple cancer types [35]. Furthermore, the value of ITGA3 expression during relapse and metastasis in colorectal cancer [36,37], lung cancer [38], prostate cancer [39], and gastric cancer [40] has been determined. ITGA3 can serve as a complementary marker for endometrial cancer [41] and bladder cancer [42]. In the present study, ONCOMINE, GEO, GEPIA,and TIMER data indicated that the mRNA expression level of ITGA3 was markedly higher in patients with HNSC than in normal controls. We also searched the HPA data to validate ITGA3 protein expression, which revealed strongly increased expression in HNSC. Another noteworthy finding was that ITGA3 expression correlated with high levels of immune infiltration in various HNSC. Overall, our results demonstrated that ITGA3 is an important factor for infiltrating immune cells in HNSC and may act as a prognostic biomarker for patients with HNSC. Using the Kaplan-Meier plotter, we observed that upregulated IGTA3 mRNA expression levels are related to worse OS and RFS in all patients with HNSC, indicating that ITGA3 represents an oncogene. Furthermore, we evaluated the connection between the expression level of ITGA3 and OS in HNSC using univariate and multivariate Cox regression analyses of TCGA data, and the results showed a prognostic role for the level of ITGA3 expression.
The knockdown of ITGA5 decreases cell adhesion and promotes apoptosis [43], whereas its upregulation enhances cell adhesion, invasion, and epithelial-mesenchymal transition in colorectal cancer cells [44]. Based on the ONCOMINE, GEO, GEPIA, and TIMER databases, we found that the expression level of ITGA5 was significantly increased in HNSC. Additionally, we examined the protein expression profile of ITGA5 in HPA, which showed levels similar to those of mRNA expression. We speculate that ITGA5 expression is related to different levels of immune infiltration in HNSC; it is also possible that ITGA5 may serve as a prognostic biomarker for HNSC infiltration. Upregulation of ITGA5 mRNA expression correlated with a worse OS but not RFS in patients with HNSC. According to univariate and multivariate Cox regression analyses of TCGA data, ITGA5 mRNA expression might be a significant prognostic factor for OS.
ITGA6 is overexpressed in multiple tumors, promoting tumorigenesis and metastasis [45,46], and expression of ITGA6 is strongly related to the occurrence of intravesical recurrence [47]. Several studies have shown that ITGA6 is a presumptive stem marker [48,49]. Using data from ONCOMINE and GEPIA, the expression level of ITGA6 was significantly upregulated in our study, as confirmed by GEO data and TIMER datasets. Furthermore, we examined the ITGA6 expression profile in HPA, which showed results similar to those for mRNA expression, and ITGA6 can also act as a prognostic biomarker because of its relationship with infiltration of various immune cells in HNSC as revealed by TCGA and TIMER datasets. In addition, we explored the increase in ITGA6 mRNA expression, which correlated significantly with worse OS using the Kaplan-Meier plotter but was not related to RFS. Analysis of ITGA6 expression in TCGA data using univariate and multivariate Cox regression revealed its prognostic value for OS.
A network of ITGA3, ITGA5, and ITGA6 and 20 neighboring genes was generated, which showed mostly enrichment in cancer-related pathways associated with the evolution of multiplex cancers. Our study adds to the growing evidence of the complexity of ITGA3, ITGA5, and ITGA6 and their associated signaling pathways, which provide insights into the rational development of targeted therapy.
Our research has the following limitations that need to be addressed in the future. First, we should explore the mechanisms of ITGA3, ITGA5, and ITGA6 for their development as biomarkers and for prognosis in further experiments. Second, we should validate our research through traditional experiments.
Conclusions
The expression patterns and prognostic values of ITGA3, ITGA5, and ITGA6 were comprehensively studied in patients with HNSC by carrying out a bioinformatics study using a variety of online platforms and data sets. ITGA3, ITGA5, and ITGA6 may serve as diagnostic and prognostic biomarkers for HNSC. In particular, IGTA5 might be used as a significant independent prognostic factor in HNSC. We hope that our results will enrich the diagnostic and therapeutic knowledge of HNSC.
Figures
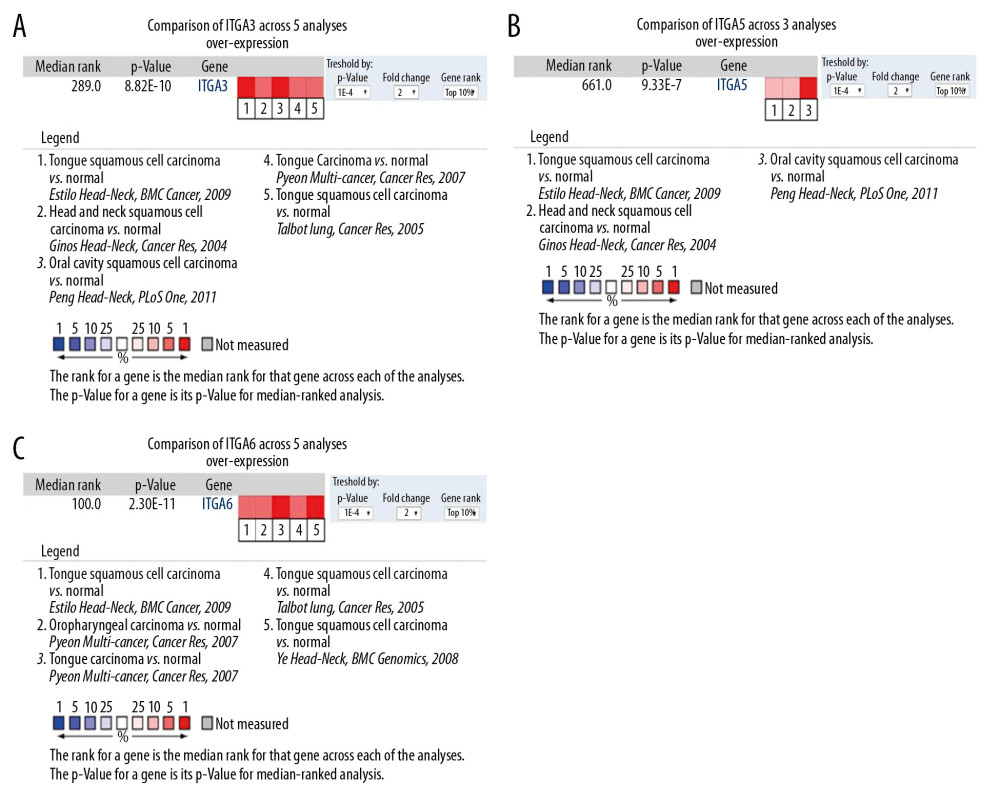 Figure 1. Comparison of mRNA expression levels across 13 analyses in the ONCOMINE database (A) Meta-analysis of ITGA3 expression in 5 analyses; (B) Meta-analysis of ITGA5 expression in 3 analyses; (C) Meta-analysis of ITGA6 expression in 5 analyses. P value: 1E-4; fold change: 2; gene rank: top 10%.
 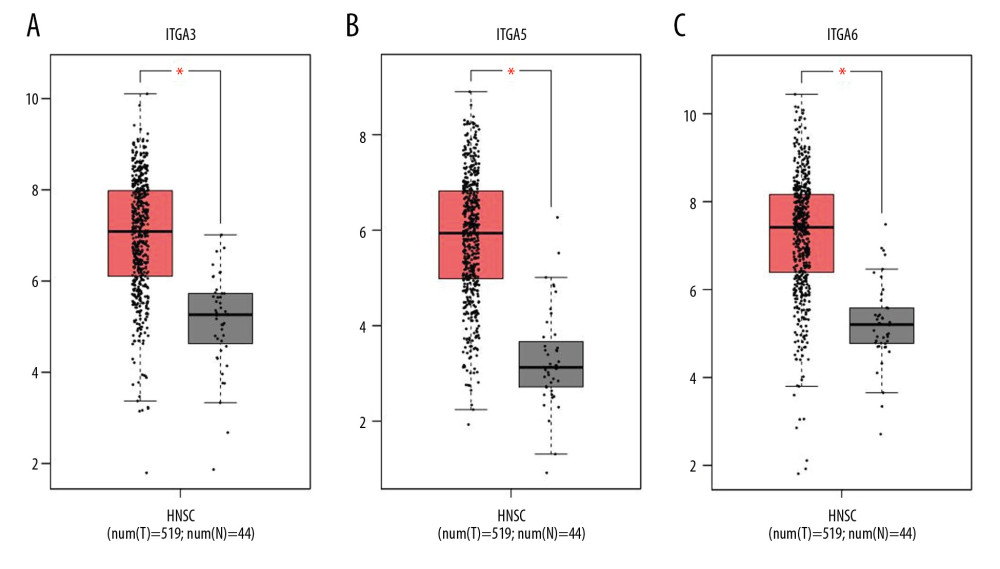 Figure 2. The expression of (A) ITGA, (B) ITGA5, and (C) ITGA6 in head and neck squamous cell carcinoma (HNSC) and normal tissues (GEPIA). * Indicates statistically significant results; a P value of 1E-4 was determined.
 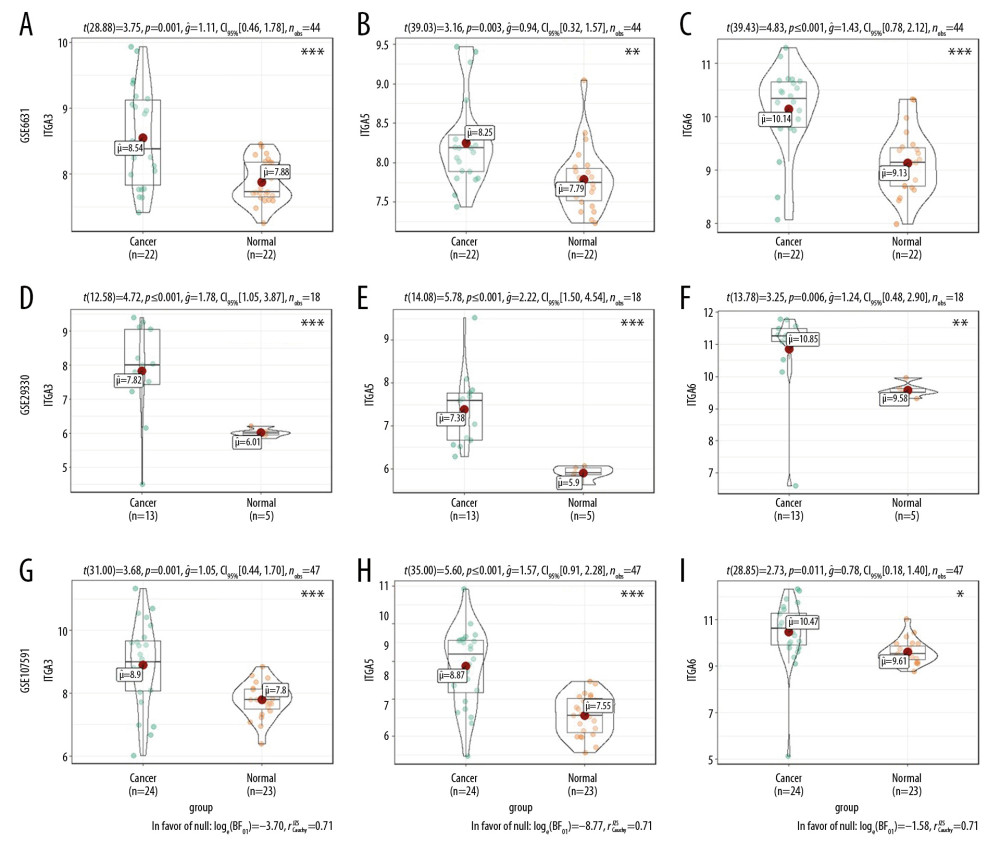 Figure 3. The mRNA expression levels between tumor and nontumor tissues in head and neck squamous cell carcinoma (HNSC) patients in GEO database series including (A–C) GSE6631; (D–F) GSE29330; and (G–I) GSE107591. (* P<0.05, ** P<0.01, *** P<0.001).
 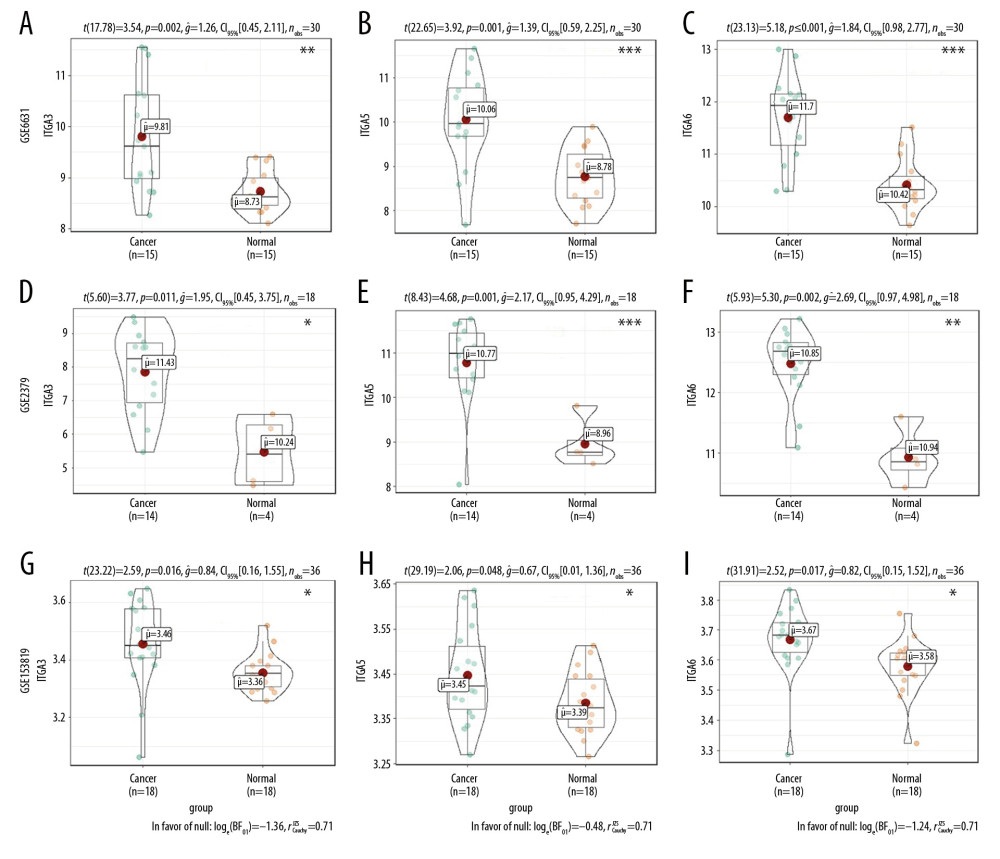 Figure 4. The mRNA expression levels between tumor and nontumor tissues in head and neck squamous cell carcinoma (HNSC) patients in GEO database series including (A–C) GSE58911; (D–F) GSE2379; and (G–I) GSE53819. (* P<0.05, ** P<0.01, *** P<0.001).
 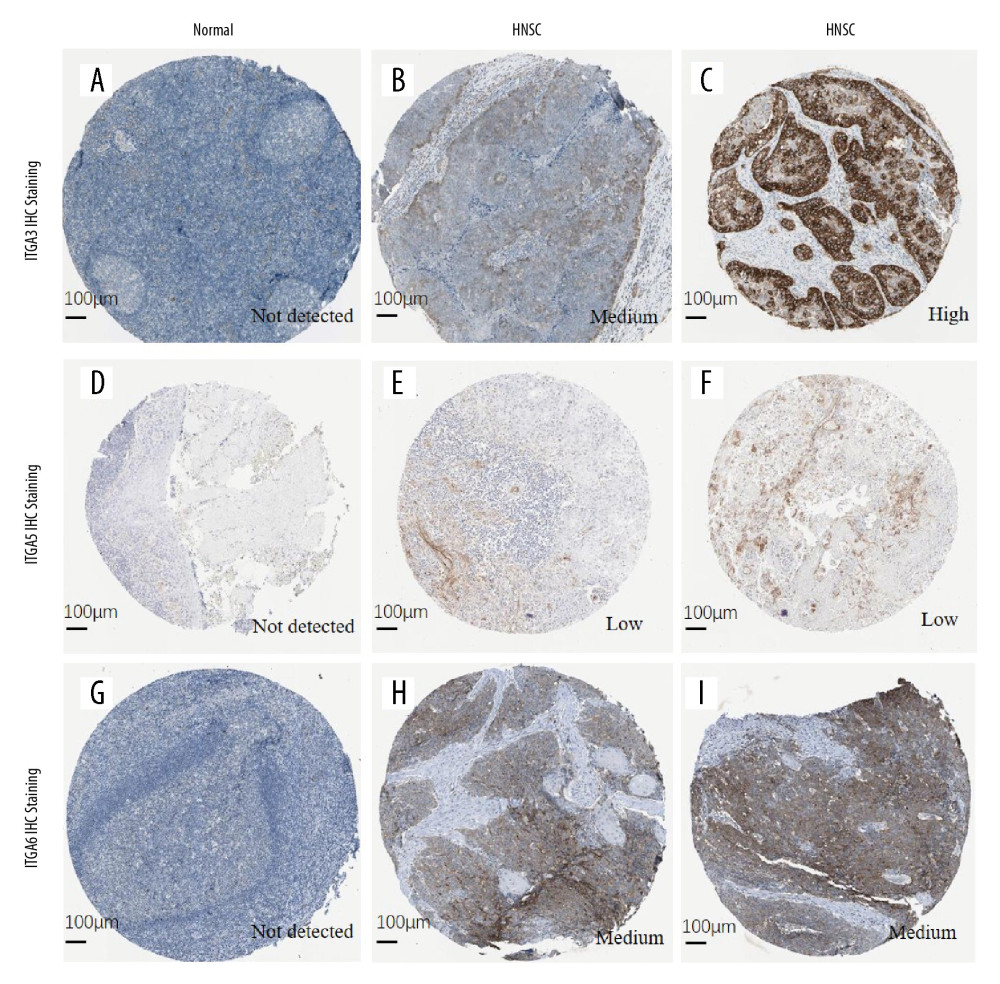 Figure 5. The protein expression of (A–C) ITGA3; (D–F) ITGA5; and (G–I) ITGA6 (HPA database). (A) Female, age 40 years, tonsil (T-61100), normal tissue, NOS (M-00100), patient ID: 2250. (B) Male, age 62 years, head-neck (T-Y0000), lymph node (T-08000), squamous cell carcinoma, metastatic, NOS (M-80706), squamous cell carcinoma, NOS (M-80703), patient ID: 1743. (C) Male, age 51 years, skeletal muscle (T-13000), head-neck (T-Y0000), squamous cell carcinoma, NOS (M-80703), normal tissue, NOS (M-00100), patient ID: 2608. (D) Male, age 20 years, tonsil (T-61100), normal tissue, NOS (M-00100), patient ID: 2519. (E, F) Female, age 76 years, head-neck (T-Y0000), oral tissue (T-51000), squamous cell carcinoma, NOS (M-80703), patient ID: 298. (G) Male, age 17 years, tonsil (T-61100), normal tissue, NOS (M-00100), patient ID: 2615. (H, I) Male, age 66 years, head-neck (T-Y0000), squamous cell carcinoma, NOS (M-80703), patient ID: 2547.
 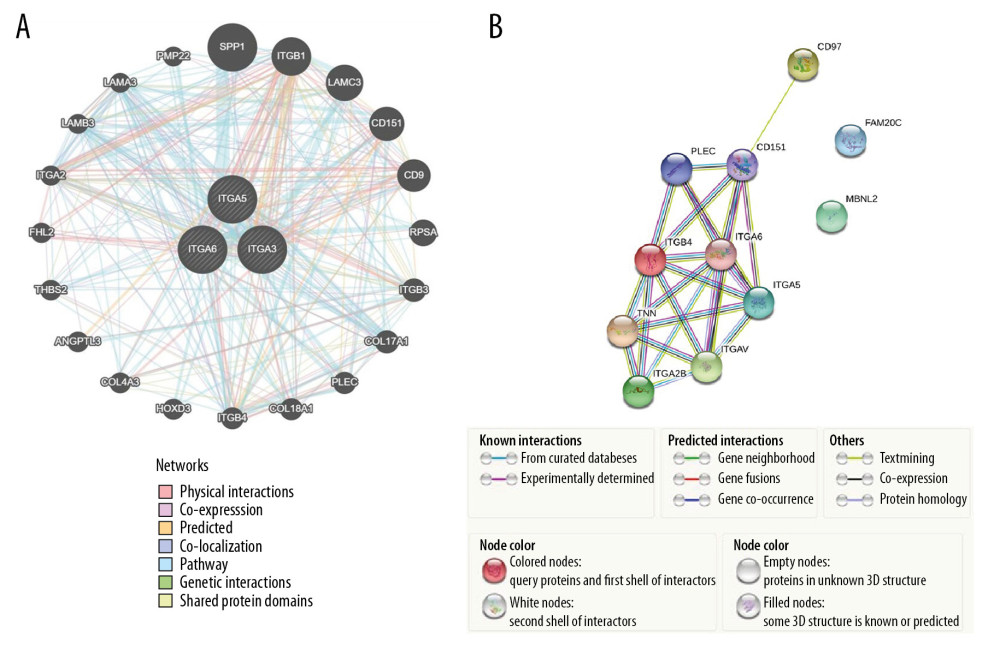 Figure 6. (A) The network of gene-level correlation for ITGA3, ITGA5, and ITGA6 and the 20 most frequent neighboring genes (GeneMANIA). (B) The protein-protein interaction relationship of these 3 genes and neighboring genes (STRING).
 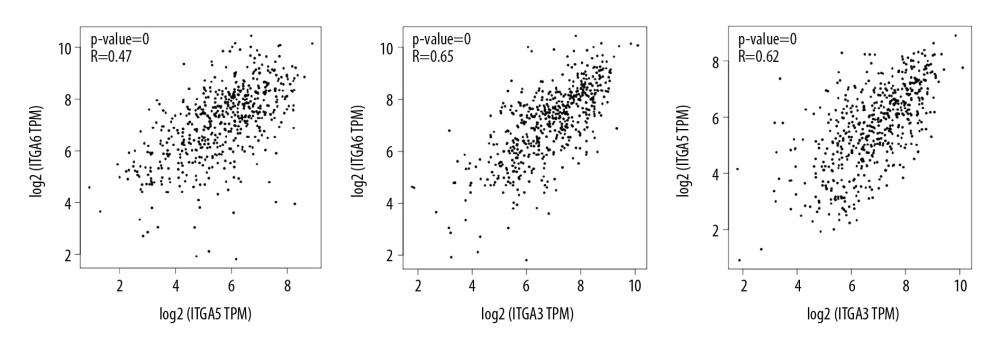 Figure 7. The association among ITGA3, ITGA5, and ITGA6 in head and neck squamous cell carcinoma (HNSC) based on Pearson correlation analysis in GEPIA databases.
 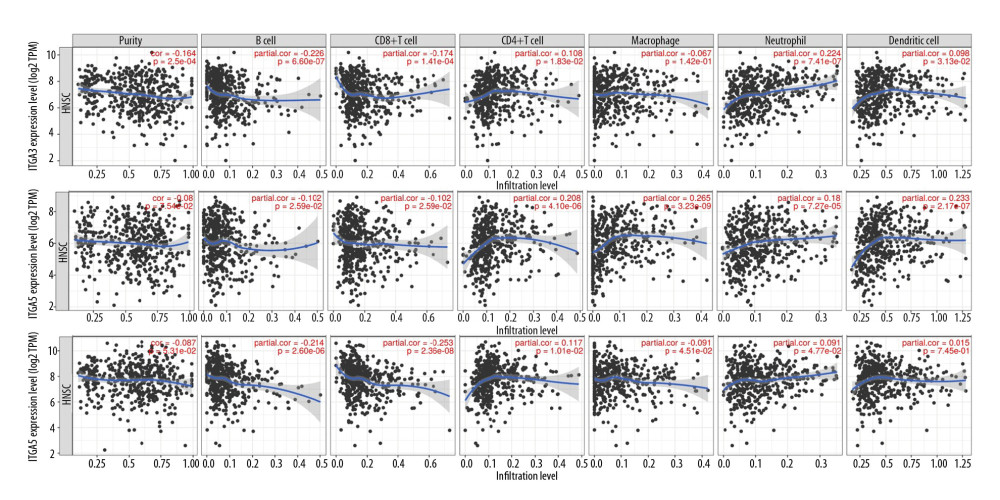 Figure 8. The associations between (A) ITGA3, (B) ITGA5, and (C) ITGA6 expression and immune cell populations from transcriptomic data in various molecular subtypes and the absolute TCGA-head and neck squamous cell carcinoma (HNSC) cohort benefitting the TIMER database.
 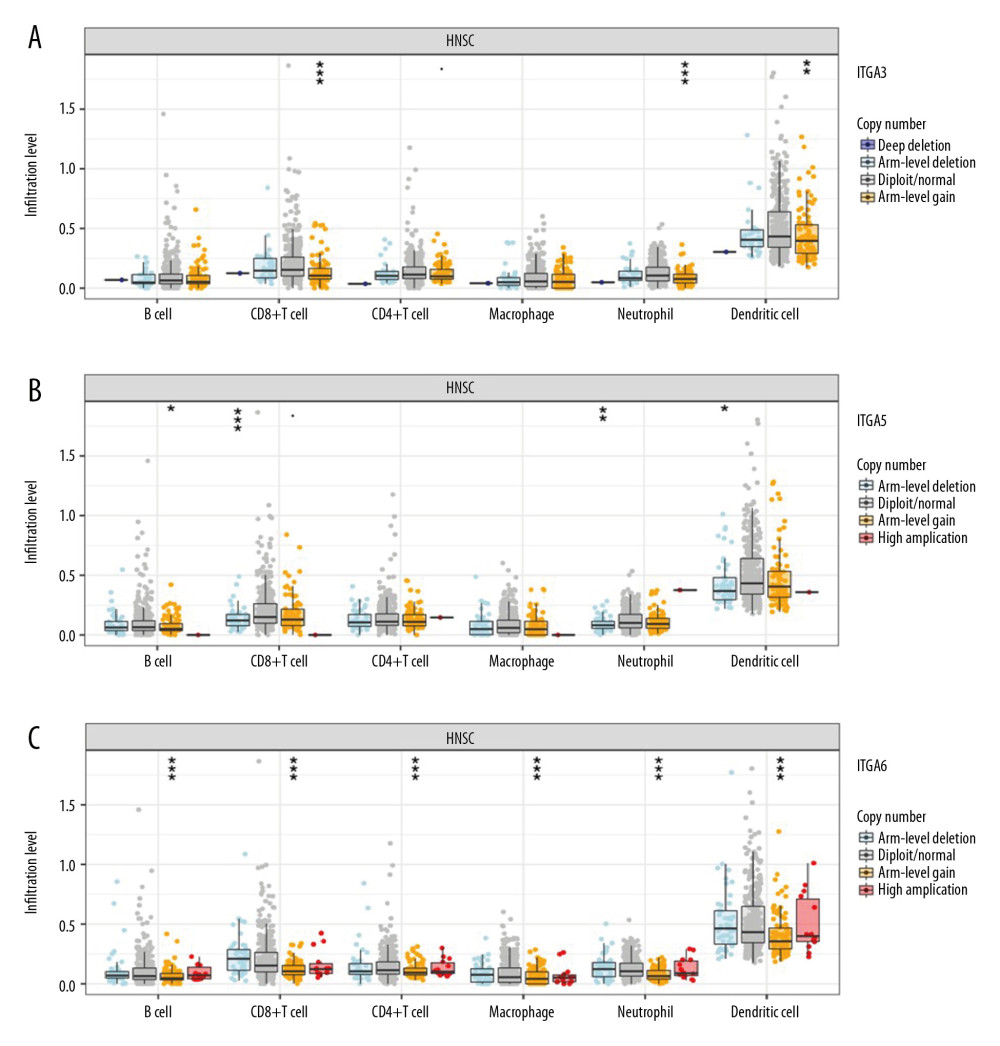 Figure 9. Somatic copy number alterations (SCNA) module provides the comparison of tumor infiltration levels among tumors with different somatic copy number alterations for (A) ITGA3, (B) ITGA5, and (C) ITGA6. P value significance: 0 ≤ *** <0.001 ≤ ** <0.01 ≤ * <0.05 ≤ <0.1.
 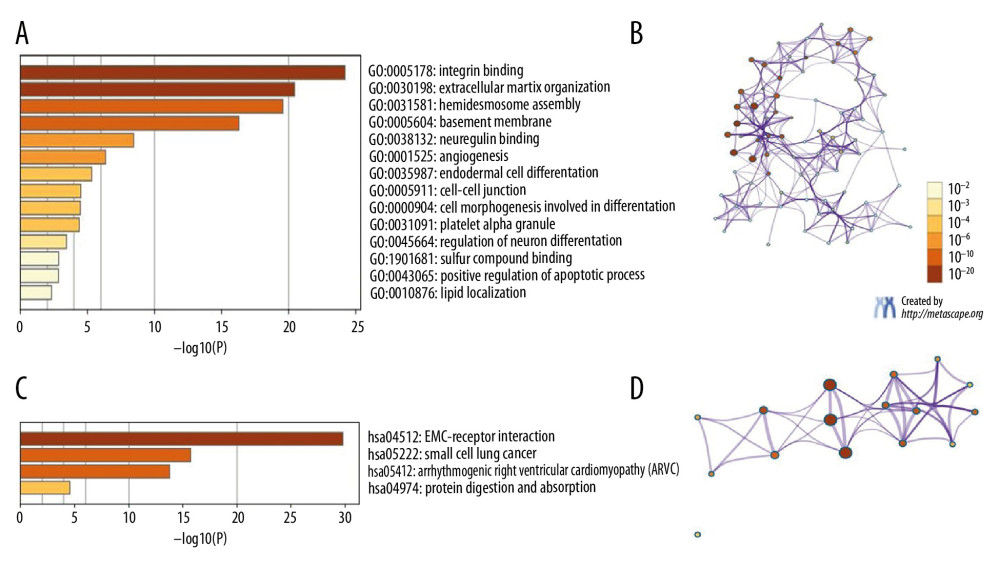 Figure 10. The GO and KEGG in Metascape were predicted to perform ITGA3, ITGA5, and ITGA6 and their neighboring genes. (A) Heatmap of GO. (B) Network of GO. (C) Heatmap of KEGG. (D) Network of KEGG.
 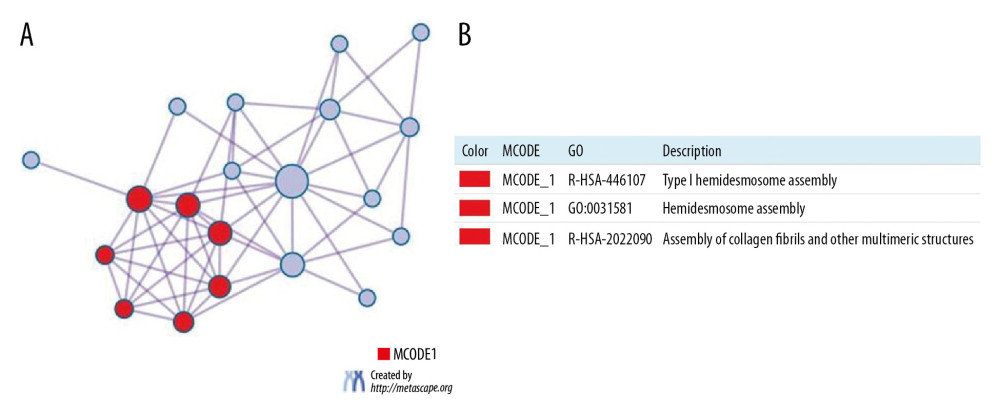 Figure 11. (A) Protein-protein interaction (PPI) network and MCODE’s most important components. (B) Independent analysis of MCODE components for functional enrichment.
 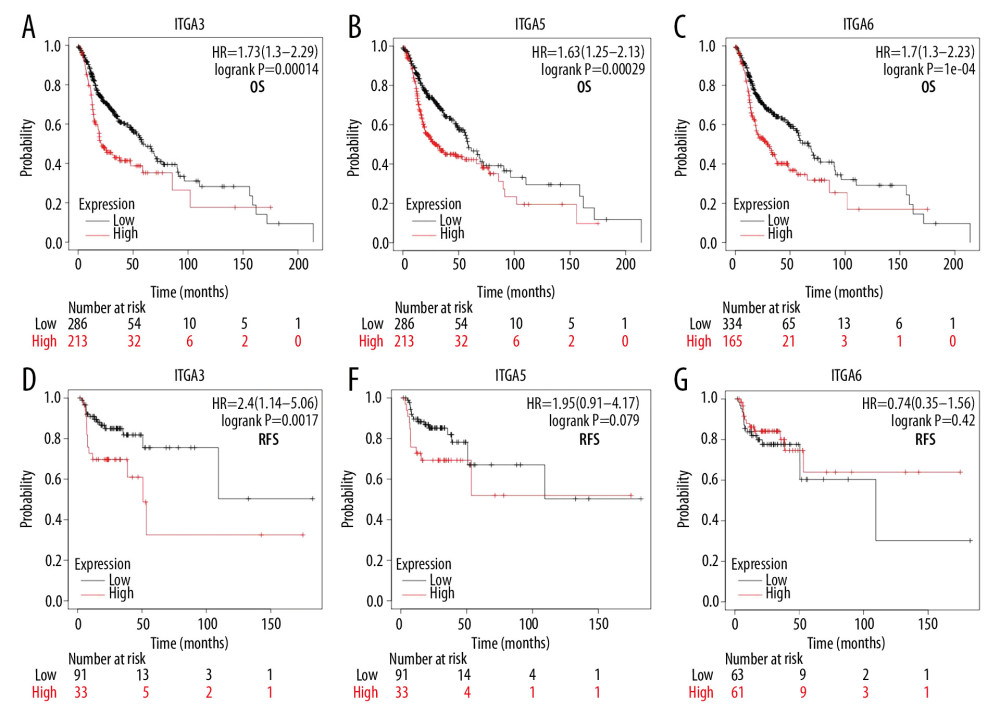 Figure 12. (A, D) The high and low expressions of ITGA3, (B, E) ITGA5, and (C, F) ITGA6 in patients with head and neck squamous cell carcinoma (HNSC); Kaplan-Meier plotter. OS – overall survival; RFS – relapse-free survival; HR – hazard ratio.
 Tables
Table 1. Comparison of expression levels of ITGA3, ITGA5, and ITGA6 between head and neck squamous cell carcinoma (HNSC) and normal samples in ONCOMINE database.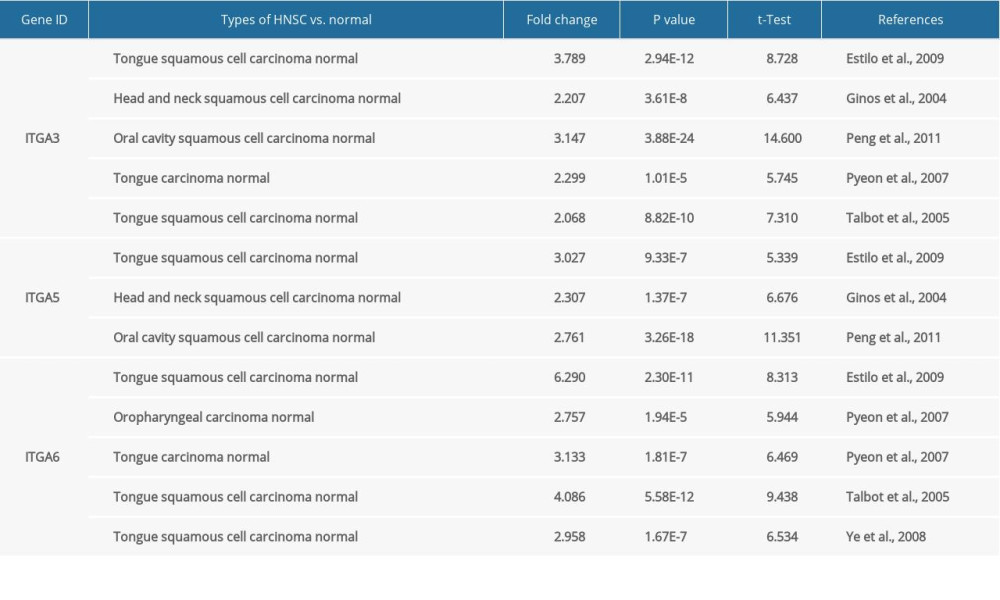 Table 2. The mRNA expression levels of ITGA3, ITGA5, and ITGA6 were analyzed in head and neck squamous cell carcinoma (HNSC) and normal tissues using the GEO series.
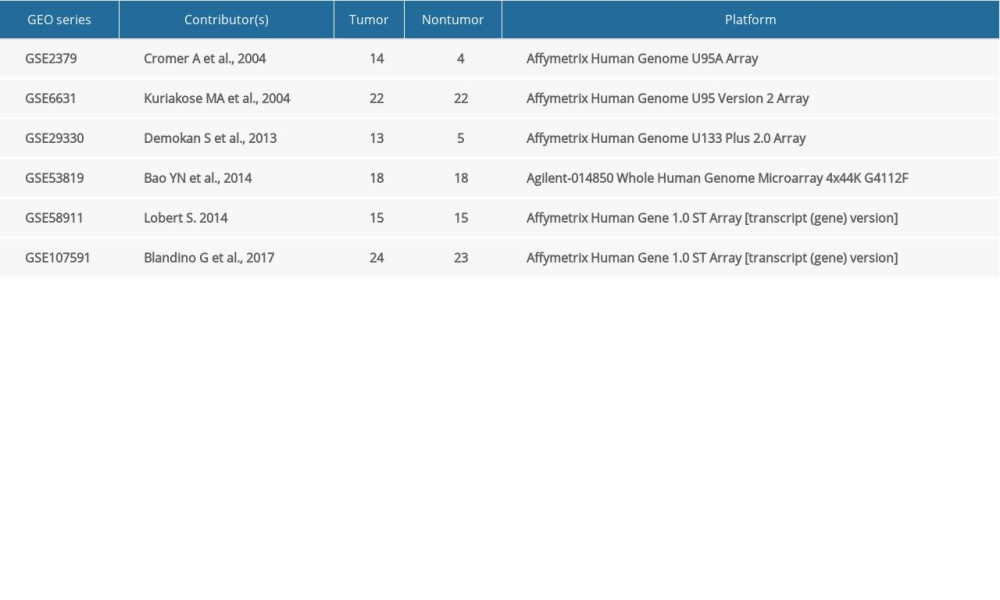 Table 3. The GO function enrichment analysis of ITGA3, ITGA5, and ITGA6 and neighbor genes in head and neck squamous cell carcinoma (HNSC).
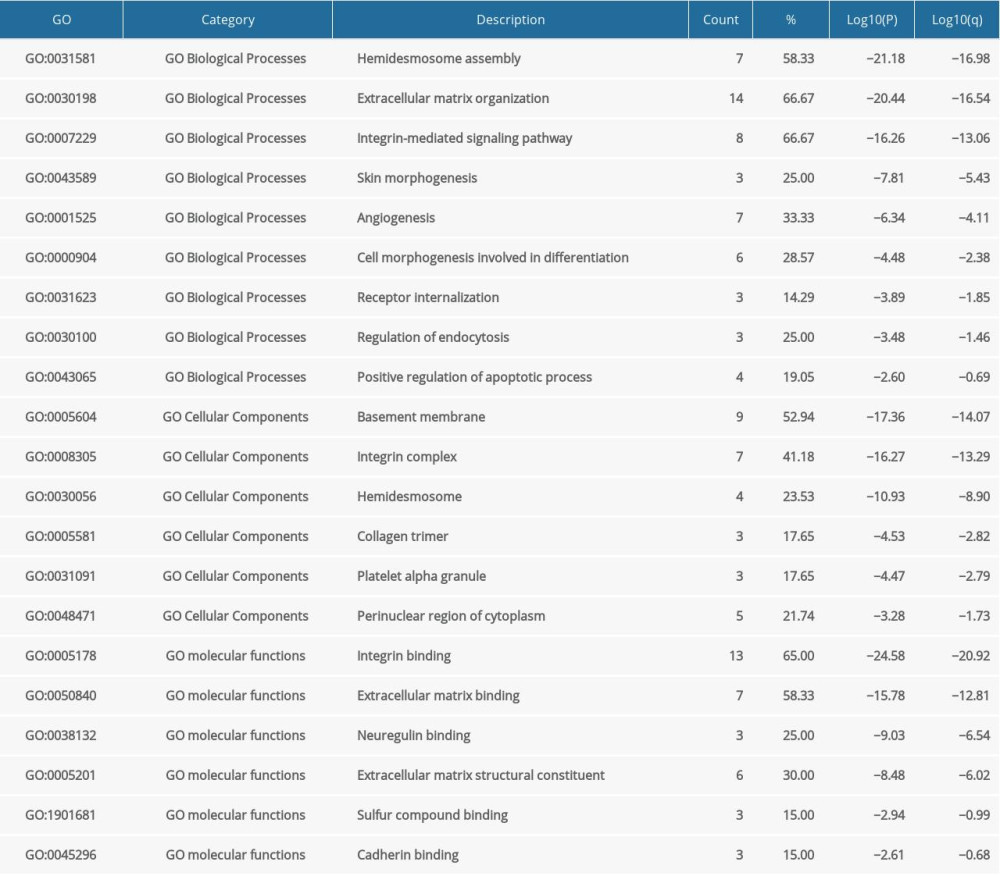 Table 4. The KEGG function enrichment analysis of ITGA3, ITGA5, ITGA6 and neighbor genes in head and neck squamous cell carcinoma (HNSC).
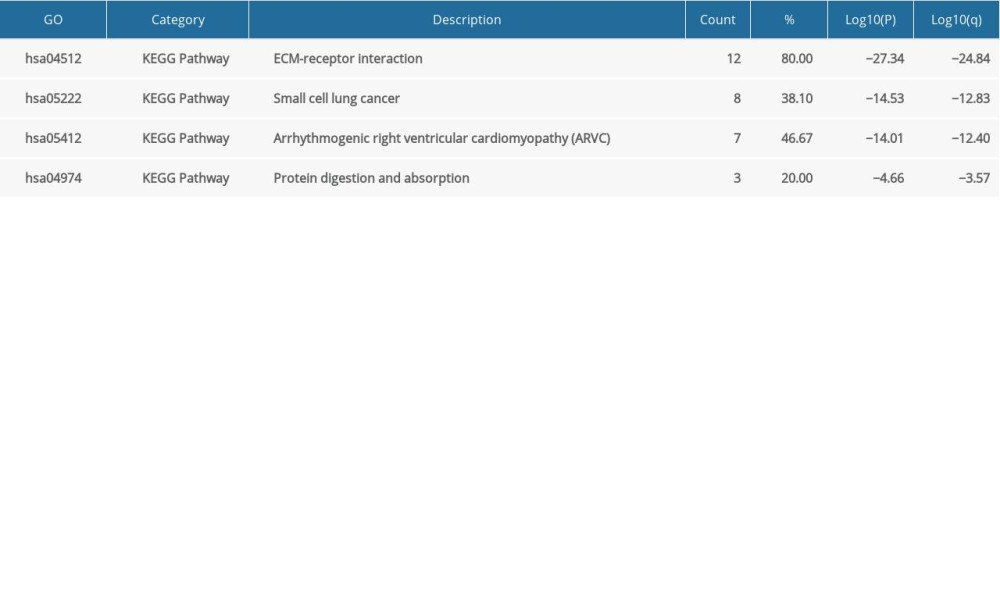 Table 5. Univariate and multivariate Cox analysis of overall survival in head and neck squamous cell carcinoma (HNSC).
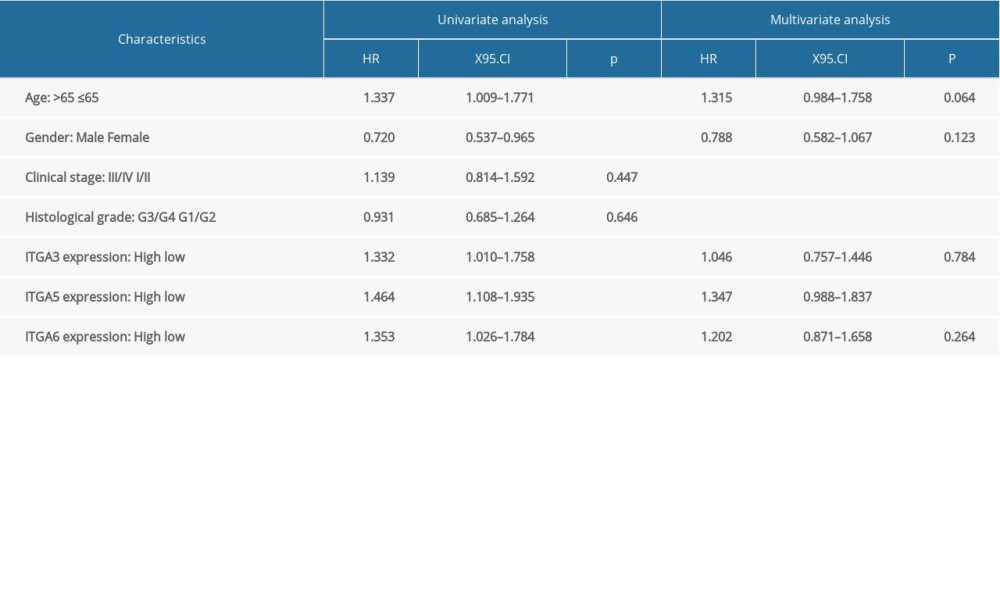 Supplementary Table 1. Adjusted univariate and multivariate Cox analysis of overall survival in head and neck squamous cell carcinoma (HNSC).
References
1. Leemans CR, Snijders PJF, Brakenhoff RH, The molecular landscape of head and neck cancer: Nat Rev Cancer, 2018; 18(5); 269-82
2. Koshizuka K, Hanazawa T, Kikkawa N, Regulation of ITGA3 by the anti-tumor miR-199 family inhibits cancer cell migration and invasion in head and neck cancer: Cancer Sci, 2017; 108(8); 1681-92
3. Siegel RL, Miller KD, Jemal A, Cancer Statistics, 2016: Cancer J Clin, 2016; 66(1); 7-30
4. Chow LQM, Head and neck cancer: New Engl J Med, 2020; 382(1); 60-72
5. Bonner JA, Harari PM, Giralt J, Radiotherapy plus cetuximab for locoregionally advanced head and neck cancer: 5-year survival data from a phase 3 randomised trial, and relation between cetuximab-induced rash and survival: Lancet Oncol, 2010; 11(1); 14
6. Hynes RO, Integrins: Bidirectional, allosteric signaling machines: Cell, 2002; 110(6); 673-87
7. Schnittert J, Bansal R, Storm G, Prakash J, Integrins in wound healing, fibrosis and tumor stroma: High potential targets for therapeutics and drug delivery: Adv Drug Deliver Rev, 2018; 129; 37-53
8. Jiao Y, Li YQ, Liu SY, ITGA3 serves as a diagnostic and prognostic biomarker for pancreatic cancer: Onco Targets Ther, 2019; 12; 4141-52
9. Kawataki T, Yamane T, Naganuma H, Laminin isoforms and their integrin receptors in glioma cell migration and invasiveness: Evidence for a role of alpha 5-laminin(s) and alpha 3 beta 1 integrin: Exp Cell Res, 2007; 313(18); 3819-31
10. Zhao XH, Wu YF, Lv ZP, miR-128 modulates hepatocellular carcinoma by inhibition of ITGA2 and ITGA5 expression: Am J Transl Res, 2015; 7(9); 1564-73 [Retracted Article; (Am J Transl Res, 2016; 8(4): 1919]
11. Gong C, Yang ZY, Wu FH, miR-17 inhibits ovarian cancer cell peritoneal metastasis by targeting ITGA5 and ITGB1: Oncol Rep, 2016; 36(4); 2177-83
12. Jin H, Ying XL, Que B, N-6-methyladenosine modification of ITGA6 mRNA promotes the development and progression of bladder cancer: Ebiomedicine, 2019; 47; 195-207
13. John AS, Rothman VL, Tuszynski GP, Thrombospondin-1 (TSP-1) simulates expression of integrin alpha6 in human breast carcinoma cells: A downstream modulator of TSP-1-induced cellular adhesion: J Oncol, 2010; 2010 645376
14. Raghavachari N, Barb J, Yang YQ, A systematic comparison and evaluation of high density exon arrays and RNA-seq technology used to unravel the peripheral blood transcriptome of sickle cell disease: BMC Med Genomics, 2012; 5; 28
15. Rhodes DR, Yu J, Shanker K, ONCOMINE: A cancer microarray database and integrated data-mining platform: Neoplasia, 2004; 6(1); 1-6
16. Rhodes DR, Kalyana-Sundaram S, Mahavisno V, Oncomine 3.0: Genes, pathways, and networks in a collection of 18,000 cancer gene expression profiles: Neoplasia, 2007; 9(2); 166-80
17. Wu PC, Wang YY, Wu YJ, Expression and prognostic analyses of ITGA11, ITGB4 and ITGB8 in human non-small cell lung cancer: Peer J, 2019; 7; e8299
18. Tang ZF, Li CW, Kang BX, GEPIA: A web server for cancer and normal gene expression profiling and interactive analyses: Nucleic Acids Res, 2017; 45(W1); W98-102
19. Uhlen M, Zhang C, Lee S, A pathology atlas of the human cancer transcriptome: Science, 2017; 357(6352); eaan2507
20. Li TW, Fan JY, Wang BB, TIMER: A web server for comprehensive analysis of tumor-infiltrating immune cells: Cancer Res, 2017; 77(21); E108-10
21. Li B, Severson E, Pignon JC, Comprehensive analyses of tumor immunity: Implications for cancer immunotherapy: Genome Biol, 2016; 17(1); 174
22. Pan JH, Zhou H, Cooper L, LAYN is a prognostic biomarker and correlated with immune infiltrates in gastric and colon cancers: Front Immunol, 2019; 10; 6
23. Zhou Q, Zhang F, He Z, Zuo MZ, E2F2/5/8 serve as potential prognostic biomarkers and targets for human ovarian cancer: Front Oncol, 2019; 9; 161
24. Gyorffy B, Lanczky A, Szallasi Z, Implementing an online tool for genome-wide validation of survival-associated biomarkers in ovarian-cancer using microarray data from 1287 patients: Endocr Relat Cancer, 2012; 19(2); 197-208
25. Goldman M, Craft B, Swatloski T, The UCSC Cancer Genomics Browser: Update 2015: Nucleic Acids Res, 2015; 43(D1); D812-17
26. Ginos MA, Page GP, Michalowicz BS, Identification of a gene expression signature associated with recurrent disease in squamous cell carcinoma of the head and neck: Cancer Res, 2004; 64(1); 55-63
27. Peng XC, Gong FM, Zhao YW, Comparative proteomic approach identifies PKM2 and cofilin-1 as potential diagnostic, prognostic and therapeutic targets for pulmonary adenocarcinoma: PLoS One, 2011; 6(11); e27309
28. Pyeon D, Newton NA, Lambert PF, Fundamental differences in cell cycle deregulation in human papillomavirus-positive and human papillomavirus-negative head/neck and cervical cancers: Cancer Res, 2007; 67(10); 4605-19
29. Talbot SG, Estilo C, Maghami E, Gene expression profiling allows distinction between primary and metastatic squamous cell carcinomas in the lung: Cancer Res, 2005; 65(8); 3063-71
30. Estilo CL, Oc P, Talbot S, Oral tongue cancer gene expression profiling: Identification of novel potential prognosticators by oligonucleotide microarray analysis: BMC Cancer, 2009; 9; 11
31. Ye H, Yu TW, Temam S, Transcriptomic dissection of tongue squamous cell carcinoma: BMC Genomics, 2008; 9; 69
32. Azimi F, Scolyer RA, Rumcheva P, Tumor-infiltrating lymphocyte grade is an independent predictor of sentinel lymph node status and survival in patients with cutaneous melanoma: J Clin Oncol, 2012; 30(21); 2678-83
33. Yoshihara K, Shahmoradgoli M, Martinez E, Inferring tumour purity and stromal and immune cell admixture from expression data: Nat Commun, 2013; 4; 2612
34. Son SY, Lee S, Singh D: Front Microbiol, 2018; 9; 1076
35. Jiao Y, Li Y, Liu S, ITGA3 serves as a diagnostic and prognostic biomarker for pancreatic cancer: Onco Targets Ther, 2019; 12; 4141-52
36. Bauer KM, Watts TN, Buechler S, Hummon AB, Proteomic and functional investigation of the colon cancer relapse-associated genes NOX4 and ITGA3: J Proteome Res, 2014; 13(11); 4910-18
37. Linhares MM, Affonso RJ, Viana LD, Genetic and immunohistochemical expression of integrins ITGAV, ITGA6, and ITGA3 as prognostic factor for colorectal cancer: Models for global and disease-free survival: PLoS One, 2015; 10(12); e0144333
38. Hsu YC, Chen HY, Yuan SS, Genome-wide analysis of three-way interplay among gene expression, cancer cell invasion and anti-cancer compound sensitivity: BMC Med, 2013; 11; 106
39. Kurozumi A, Goto Y, Matsushita R, Tumor-suppressive microRNA-223 inhibits cancer cell migration and invasion by targeting ITGA3/ITGB1 signaling in prostate cancer: Cancer Sci, 2016; 107(1); 84-94
40. Scartozzi M, Loretelli C, Bearzi I, Allele polymorphisms of tumor integrins correlate with peritoneal carcinosis capability of gastric cancer cells in radically resected patients: Ann Oncol, 2011; 22(4); 897-902
41. Bateman NW, Dubil EA, Wang GS, Race-specific molecular alterations correlate with differential outcomes for black and white endometrioid endometrial cancer patients: Cancer, 2017; 123(20); 4004-12
42. Sakaguchi T, Yoshino H, Yonemori M, Regulation of ITGA3 by the dual-stranded microRNA-199 family as a potential prognostic marker in bladder cancer: Br J Cancer, 2017; 116(8); 1077-87
43. Murillo CA, Rychahou PG, Evers BM, Inhibition of alpha 5 integrin decreases PI3K activation and cell adhesion of human colon cancers: Surgery, 2004; 136(2); 143-49
44. Nam EH, Lee Y, Moon B, Twist1 and AP-1 cooperatively upregulate integrin alpha 5 expression to induce invasion and the epithelial-mesenchymal transition: Carcinogenesis, 2015; 36(3); 327-37
45. Brooks DLP, Schwab LP, Krutilina R, ITGA6 is directly regulated by hypoxia-inducible factors and enriches for cancer stem cell activity and invasion in metastatic breast cancer models: Mol Cancer, 2016; 15; 26
46. Stewart RL, West D, Wang C, Elevated integrin alpha 6 beta 4 expression is associated with venous invasion and decreased overall survival in non-small cell lung cancer: Hum Pathol, 2016; 54; 174-83
47. Behnsawy HM, Miyake H, Abdalla MA, Expression of integrin proteins in non-muscle-invasive bladder cancer: Significance of intravesical recurrence after transurethral resection: BJU Int, 2011; 107(2); 240-46
48. Bigoni-Ordonez GD, Czarnowski D, Parsons T, Integrin alpha 6 (CD49f), the microenvironment and cancer stem cells: Curr Stem Cell Res Ther, 2019; 14(5); 428-36
49. Krebsbach PH, Villa-Diaz LG, The role of integrin alpha 6 (CD49f) in stem cells: More than a conserved biomarker: Stem Cells Dev, 2017; 26(15); 1090-99
Figures
Figure 1. Comparison of mRNA expression levels across 13 analyses in the ONCOMINE database (A) Meta-analysis of ITGA3 expression in 5 analyses; (B) Meta-analysis of ITGA5 expression in 3 analyses; (C) Meta-analysis of ITGA6 expression in 5 analyses. P value: 1E-4; fold change: 2; gene rank: top 10%.Figure 2. The expression of (A) ITGA, (B) ITGA5, and (C) ITGA6 in head and neck squamous cell carcinoma (HNSC) and normal tissues (GEPIA). * Indicates statistically significant results; a P value of 1E-4 was determined.Figure 3. The mRNA expression levels between tumor and nontumor tissues in head and neck squamous cell carcinoma (HNSC) patients in GEO database series including (A–C) GSE6631; (D–F) GSE29330; and (G–I) GSE107591. (* P<0.05, ** P<0.01, *** P<0.001).Figure 4. The mRNA expression levels between tumor and nontumor tissues in head and neck squamous cell carcinoma (HNSC) patients in GEO database series including (A–C) GSE58911; (D–F) GSE2379; and (G–I) GSE53819. (* P<0.05, ** P<0.01, *** P<0.001).Figure 5. The protein expression of (A–C) ITGA3; (D–F) ITGA5; and (G–I) ITGA6 (HPA database). (A) Female, age 40 years, tonsil (T-61100), normal tissue, NOS (M-00100), patient ID: 2250. (B) Male, age 62 years, head-neck (T-Y0000), lymph node (T-08000), squamous cell carcinoma, metastatic, NOS (M-80706), squamous cell carcinoma, NOS (M-80703), patient ID: 1743. (C) Male, age 51 years, skeletal muscle (T-13000), head-neck (T-Y0000), squamous cell carcinoma, NOS (M-80703), normal tissue, NOS (M-00100), patient ID: 2608. (D) Male, age 20 years, tonsil (T-61100), normal tissue, NOS (M-00100), patient ID: 2519. (E, F) Female, age 76 years, head-neck (T-Y0000), oral tissue (T-51000), squamous cell carcinoma, NOS (M-80703), patient ID: 298. (G) Male, age 17 years, tonsil (T-61100), normal tissue, NOS (M-00100), patient ID: 2615. (H, I) Male, age 66 years, head-neck (T-Y0000), squamous cell carcinoma, NOS (M-80703), patient ID: 2547.Figure 6. (A) The network of gene-level correlation for ITGA3, ITGA5, and ITGA6 and the 20 most frequent neighboring genes (GeneMANIA). (B) The protein-protein interaction relationship of these 3 genes and neighboring genes (STRING).Figure 7. The association among ITGA3, ITGA5, and ITGA6 in head and neck squamous cell carcinoma (HNSC) based on Pearson correlation analysis in GEPIA databases.Figure 8. The associations between (A) ITGA3, (B) ITGA5, and (C) ITGA6 expression and immune cell populations from transcriptomic data in various molecular subtypes and the absolute TCGA-head and neck squamous cell carcinoma (HNSC) cohort benefitting the TIMER database.Figure 9. Somatic copy number alterations (SCNA) module provides the comparison of tumor infiltration levels among tumors with different somatic copy number alterations for (A) ITGA3, (B) ITGA5, and (C) ITGA6. P value significance: 0 ≤ *** <0.001 ≤ ** <0.01 ≤ * <0.05 ≤ <0.1.Figure 10. The GO and KEGG in Metascape were predicted to perform ITGA3, ITGA5, and ITGA6 and their neighboring genes. (A) Heatmap of GO. (B) Network of GO. (C) Heatmap of KEGG. (D) Network of KEGG.Figure 11. (A) Protein-protein interaction (PPI) network and MCODE’s most important components. (B) Independent analysis of MCODE components for functional enrichment.Figure 12. (A, D) The high and low expressions of ITGA3, (B, E) ITGA5, and (C, F) ITGA6 in patients with head and neck squamous cell carcinoma (HNSC); Kaplan-Meier plotter. OS – overall survival; RFS – relapse-free survival; HR – hazard ratio. Tables
Table 1. Comparison of expression levels of ITGA3, ITGA5, and ITGA6 between head and neck squamous cell carcinoma (HNSC) and normal samples in ONCOMINE database.Table 2. The mRNA expression levels of ITGA3, ITGA5, and ITGA6 were analyzed in head and neck squamous cell carcinoma (HNSC) and normal tissues using the GEO series.Table 3. The GO function enrichment analysis of ITGA3, ITGA5, and ITGA6 and neighbor genes in head and neck squamous cell carcinoma (HNSC).Table 4. The KEGG function enrichment analysis of ITGA3, ITGA5, ITGA6 and neighbor genes in head and neck squamous cell carcinoma (HNSC).Table 5. Univariate and multivariate Cox analysis of overall survival in head and neck squamous cell carcinoma (HNSC).Table 1. Comparison of expression levels of ITGA3, ITGA5, and ITGA6 between head and neck squamous cell carcinoma (HNSC) and normal samples in ONCOMINE database.Table 2. The mRNA expression levels of ITGA3, ITGA5, and ITGA6 were analyzed in head and neck squamous cell carcinoma (HNSC) and normal tissues using the GEO series.Table 3. The GO function enrichment analysis of ITGA3, ITGA5, and ITGA6 and neighbor genes in head and neck squamous cell carcinoma (HNSC).Table 4. The KEGG function enrichment analysis of ITGA3, ITGA5, ITGA6 and neighbor genes in head and neck squamous cell carcinoma (HNSC).Table 5. Univariate and multivariate Cox analysis of overall survival in head and neck squamous cell carcinoma (HNSC).Supplementary Table 1. Adjusted univariate and multivariate Cox analysis of overall survival in head and neck squamous cell carcinoma (HNSC). In Press
Clinical Research
Effects of Single-Bout Endurance Exercise Intensity on Peripheral Neurotrophic Factors in Patients With Isc...Med Sci Monit In Press; DOI: 10.12659/MSM.952089
Review article
Anisodus tanguticus in Cancer Research: A Review of Traditional Use, Phytochemistry, Extraction Methods, an...Med Sci Monit In Press; DOI: 10.12659/MSM.952999
Clinical Research
Nasal Mucociliary Clearance and Its Relationship With Disease Severity in Patients With Multiple SclerosisMed Sci Monit In Press; DOI: 10.12659/MSM.952850
Clinical Research
Modified Thoracoabdominal Nerves Block Through the Perichondrial Approach vs Subcostal Transversus Abdomini...Med Sci Monit In Press; DOI: 10.12659/MSM.953976
Most Viewed Current Articles
17 Jan 2024 : Review article 14,176,570
Vaccination Guidelines for Pregnant Women: Addressing COVID-19 and the Omicron VariantDOI :10.12659/MSM.942799
Med Sci Monit 2024; 30:e942799
13 Nov 2021 : Clinical Research 3,762,188
Acceptance of COVID-19 Vaccination and Its Associated Factors Among Cancer Patients Attending the Oncology ...DOI :10.12659/MSM.932788
Med Sci Monit 2021; 27:e932788
14 Dec 2022 : Clinical Research 2,466,310
Prevalence and Variability of Allergen-Specific Immunoglobulin E in Patients with Elevated Tryptase LevelsDOI :10.12659/MSM.937990
Med Sci Monit 2022; 28:e937990
16 May 2023 : Clinical Research 708,927
Electrophysiological Testing for an Auditory Processing Disorder and Reading Performance in 54 School Stude...DOI :10.12659/MSM.940387
Med Sci Monit 2023; 29:e940387