26 August 2023: Database Analysis
An Immune-Related Gene Signature for Predicting Survival and Immunotherapy Efficacy in Esophageal Adenocarcinoma
Chuang Yang1BC, Feng Cao2EF, Yan He2A*DOI: 10.12659/MSM.940157
Med Sci Monit 2023; 29:e940157


Abstract
BACKGROUND: Immune checkpoint inhibitor (ICI) therapy has attracted wide attention in the treatment of malignant tumors. This study was designed to build a prognostic model based on immune-related genes for esophageal adenocarcinoma (EAC).
MATERIAL AND METHODS: The expression of immune-related differentially-expressed genes (IRDEGs) between EAC and normal samples from The Cancer Genome Atlas database was analyzed. Univariate and multivariate Cox regressions were used to identify the prognostic IRDEGs and construct an immune-related gene signature (IRGS) to predict the overall survival (OS) of EAC patients. Then, the molecular mechanisms and immune characteristics were comprehensively analyzed.
RESULTS: A total of 111 IRDEGs were obtained from the weighted gene co-expression network analysis. Univariate Cox regression analysis showed that 12 IRDEGs (P<0.05 for all) were linked with OS in the EAC patients. Four genes were used to construct the IRGS based on the multivariate Cox regression analysis. Patients in the high-risk group showed worse OS than those in the low-risk group (P<0.001). A high-risk score was related to DNA replication relevant pathways, an increase in mutation rate, and an increase in activated mast cell infiltration. Patients with high-risk scores had lower tumor immune dysfunction and exclusion scores (P<0.001).
CONCLUSIONS: IRDEGs may be involved in the progression of EAC. The high-risk group is more suitable for immunotherapy, which may provide a reference value for the treatment of clinical EAC patients. Therefore, it is possible to identify the patients who are better suited for ICI therapy.
Keywords: Immune Checkpoint Inhibitors, Esophageal Neoplasms, Survival Analysis, biomarkers, Humans, Immunotherapy, Adenocarcinoma
Background
According to global cancer statistics, in 2020 there were 604 000 new cases (ranking 7th among all tumors) and 544 000 deaths (ranking 6th) due to esophageal cancer [1]. Esophageal adenocarcinoma (EAC) is a common type of esophageal cancer. The incidence of EAC is increasing every year, especially in some high-income countries (such as the United States, France, and Britain) and has surpassed esophageal squamous cell carcinoma (ESCC), and two-thirds of the oesophageal cancer cases in these countries are EAC cases [1]. Being overweight may be an increasingly important factor contributing to the burden of EAC in the future [2]. The early symptoms of EAC are not obvious; it is mostly diagnosed in patients during the advanced stage, and the overall prognosis is poor, with a 5-year survival rate of less than 30% [3].
For early-stage EAC patients, endoscopic resection can be chosen based on factors such as tumor size, depth of infiltration, and lymphovascular invasion [4,5]. For locally advanced EAC patients, surgical resection or surgical resection following chemoradiotherapy can be considered [6]. For metastatic EAC patients, treatment options typically include radiotherapy, chemotherapy, and other approaches. In recent years, there has been significant progress in the use of immunotherapy for EAC treatment [7]. However, only a small number of patients achieve satisfactory outcomes with immunotherapy. Therefore, exploring the heterogeneity of EAC and identifying effective targets are particularly important for personalized treatment of EAC.
Immunotherapy provides a new option for the treatment of various malignant tumors. Immune checkpoint inhibitors (ICIs) primarily include inhibitors of targets such as CTLA-4, PD-1, LAG3, KIR-NKG2A, KIR-KIR3DL2, TIM3, CEACAM 1, VISTA, CD73, and similar immune checkpoint genes, which have been applied to the treatment of various tumors [8]. However, owing to drug resistance and immune escape, only a small number of patients benefit from ICI therapy [9]. Therefore, it is necessary to identify biomarkers that can accurately predict and identify patients who can benefit from immunotherapy to better guide the individualized clinical treatment. In addition, the resistance of cancer to immunotherapy is mainly determined by the internal and external factors of a tumor. Internal factors are mainly related to immune checkpoint gene expression, tumor mutation burden (TMB), and microsatellite instability, whereas external factors are mainly related to immune cells such as tumor-infiltrating lymphocytes, tumor-associated macrophages, and myeloid-derived suppressor cells [10]. Therefore, it is essential to better understand the tumor immune microenvironment (TIME) and construct a prognostic model related to the TIME, which can be used to predict the efficacy of immunotherapy in EAC patients.
Assessing the immune status of cancer is crucial for predicting the response to immunotherapy. Factors such as tumor mutational burden, lymphocyte infiltration, absence of checkpoints or soluble inhibitors, and others play a significant role in this assessment [11]. Combining these biomarkers provides essential information that paves the way for more precise and personalized immunotherapy [12]. The molecular subtypes of tumors indicate different treatment approaches. Detecting biomarkers can identify different molecular subtypes, allowing for better treatment outcomes for different patients. For example, in breast cancer, detecting PR, ER, Her2, and TNBC helps determine the molecular subtypes and guide individualized treatments [13]. Furthermore, immune-related biomarkers can serve as predictive markers to determine the likelihood of a patient’s response to immunotherapy. Additionally, certain immune-related biomarkers have prognostic value in EAC. This information can aid in personalized patient prognosis and help develop individualized follow-up and monitoring strategies.
The significant advancement in gene expression profiling has greatly enhanced our understanding of tumors at the genetic level. It not only reveals the functionality and regulatory networks of genes, but also has a profound impact on various aspects such as tumor diagnosis, classification, prognostic assessment, drug development, and the formulation of personalized treatment strategies. Researchers have made significant progress in understanding esophageal adenocarcinoma (EAC) through gene expression profiling. They suggest that EAC may originate from gastric cells through a Barrett’s esophagus-like metaplasia, which is consistent with studies in The Cancer Genome Atlas (TCGA). It indicates the homogeneity between EAC and gastric esophageal adenocarcinoma [14,15].
A robust immune-related prognostic signature was developed in multiple lung adenocarcinoma cohorts using the ESTIMATE algorithm and weighted gene co-expression network analysis (WGCNA) [16]. This signature may serve as a promising prognostic biomarker for lung adenocarcinomas. Another study developed and validated a novel, immune-related prognostic signature for patients with colorectal cancer. This signature reflects the dysregulated TIME and has the potential for better management of patients with colorectal cancer [17]. Based on the multigene expression dataset, a gene signature was developed for 9 immune-related genes (IRGs); this signature may be a potential biomarker for the prognostic prediction of hepatocellular carcinoma (HCC) patients [18]. A study of oesophageal cancer identified 6 novel biomarkers (PBK, KIF2C, NUF2, KIF20A, RAD51AP1, and DEPDC1) for ESCC [19]; notably, all 6 genes could be independent diagnostic and prognostic indicators for ESCC and may also be potential targets for ESCC therapy. However, IRGs in EAC have not been sufficiently elucidated in exploratory studies. Therefore, we aimed to comprehensively analyze the IRGs in EAC, the potential role of TIME, and the clinicopathological features and prognosis in ECA.
The purpose of this study was to evaluate the prognostic value of IRGs in EAC patients by analyzing the immune-related differentially-expressed genes (IRDEGs) and constructing an immune-related gene signature (IRGS) using univariate and multivariate Cox regression analyses. We also aimed to assess the effectiveness of the model from the perspective of TIME and immunotherapy to guide clinical immunotherapy in patients with EAC.
Material and Methods
DATA COLLECTION AND PROCESSING:
The flowchart of this study is shown in Supplementary Figure 1. The RNA-sequencing data (FPKM), gene mutation data (included copy number variation), and clinical information of 87 adenocarcinoma samples (78 EAC samples and 9 normal esophageal samples from the ESCA dataset) were downloaded from The Cancer Genome Atlas (https://cancergenome.nih.gov/) and the cases’ ID and clinical information (include age, gender, stage, etc.) are shown in Supplementary Table 1. The series matrix file of GSE13898 was downloaded from the GEO database (https://www.ncbi.nlm.nih.gov/gds/?term=), which contained 64 patients with EAC and annotated with the platform GPL6102. The IRGs were obtained from the ImmPort (HTTPS://www.immport.org/shared/home) database and InnateDB (HTTPS://www.innateDBdb.com/) database.
The differentially-expressed genes (DEGs) in EAC and normal esophageal tissues were identified by using the ‘limma’ package (v 3.50.3) of R software with |log2 Fold Change (FC)| >1 and adjusted P value <0.05 (FDR <0.05, method=“BH”). The DEGs with log2 FC >0 and log2 FC <0 represent upregulated and downregulated genes, respectively. Based on the list of immune-related genes, we obtained the IRDEGs. The ‘pheatmap’ package of R software was used to construct the heatmaps for DEGs of EAC and IRDEGs. A total of 3452 DEGs and 394 IRDEGs (Supplementary Table 2) were obtained to draw heatmaps.
WGCNA analysis conducted with the ‘WGCNA’ (v 1.72-1) package was used to reveal complex relationships between genes and phenotypes. At first, we determined the powers=c (1: 20) and cex1=0.9. The principle of soft threshold screening is to make the constructed network more consistent with the scale-free network characteristics. We analyzed the association between soft threshold (power) and Scale-Free Topology Model Fit, signed R2. We set R2=0.9 and we found that signed R2 is very close to 0.9 for a soft threshold value equal to 3. We also drew the result between soft threshold (power) and Mean Connectivity. We could get a stable mean connectivity with a soft threshold=3 (Supplementary Figure 2). Based on the Pearson correlation coefficient between 2 genes, we used the expression profiles of 394 IRDEGs to construct the similarity matrix and a soft threshold of β=3. Then, we transformed the adjacency matrix into a topological overlap matrix to describe the relationship between genes. Average linkage hierarchical clustering was used to construct a clustering dendrogram of the topological overlap matrix with each module containing at least 25 genes. Finally, we obtained 4 modules by setting the merging threshold function at 0.25. The height of the module reflects the similarity between 2 modules, and here the modules are merged using the distance matrix calculated by the Pearson correlation coefficient between the module eigenvalues. We set merging threshold function=0.25 represents 2 modules with a correlation greater than 0.75 are merged into a new module. Among these modules, ‘MEblue’ was the most significant, and we obtained 111 (Supplementary Table 3) genes in this module for further analysis.
FUNCTION AND PATHWAY ENRICHMENT ANALYSIS:
Gene ontology (GO) analysis is a commonly used bioinformatics tool that can describe and define genes and their RNA or proteins and can identify unique biological characteristics of high-throughput transcriptomic or genomic data. It contains 3 main parts: biological process, cellular components, and molecular function. Kyoto Encyclopedia of Genes and Genomes (KEGG) enrichment analysis is a comprehensive database that integrates genome, disease, medicinal, and chemical information. The GO and KEGG enrichment analysis was performed for 111 genes in the ‘MEblue’ module by using the ‘clusterProfiler’ (v 4.2.2) and ‘enrichplot’ (v 1.14.2) package of R software with a threshold
CONSTRUCTION AND VALIDATION OF PROGNOSTIC IRDEGS SIGNATURE:
The 111 ‘MEblue’ module genes were performed by univariate Cox regression to screen the prognosis-related IRDEGs, and
GENE SET ENRICHMENT ANALYSIS (GSEA) AND GENE MUTATION ANALYSIS:
First, we use the “limma” package to calculate the fold change of gene expression between the high-risk group and the low-risk group. Then, we sorted the gene expression matrix based on the fold change of genes. Next, we use the GSEA method to investigate the differential enrichment of pathways between the high-risk group and the low-risk group. GSEA was performed to understand the signaling pathways of high- and low-risk groups based on the KEGG gene sets. The R package ‘msigdbr’ (v 7.5.1) was used to download the gene sets, for which the parameter category was set to ‘C2’. The high- and low-risk groups of signaling pathways differences were then analyzed using the “GSEA” and “gseaplot2” function in the “clusterProfiler” and “enrichplot” packages. Based on the expression patterns of the gene set in the high-risk and low-risk groups, a score is calculated for each gene set, and the enrichment of each gene set is calculated. A
IMMUNE CELLS INFILTRATION:
To explore the TIME and clinical characteristics of 78 EAC samples, the relative 22 immune cells were obtained from the CIBERSORT which last updated 07-10-2015 (
IMMUNE RESPONSE AND IMMUNOTHERAPY:
We obtained the immune checkpoint genes from a previous publication [20]. To assess whether risk groups were associated with immunotherapy efficacy, we compared the expression of various immune checkpoints in high- and low-risk patients. TIDE stands for tumor immune dysfunction and rejection. The TIDE score consists of 2 components: dysfunction score and exclusion score. Dysfunction score is calculated by multiplying the expression of a gene with a higher weight for immune dysregulation to obtain the dysfunction score. The exclusion score is calculated by multiplying the expression of a gene with a higher weight for immune rejection to obtain the dysfunction score, which is obtained by multiplying the expression by the higher weight of the immune rejection gene. The immune dysregulation weight is obtained using cancer survival data, while the immune rejection weight is obtained using the gene expression of the immune rejection samples [21]. Actually, we acquired the CTL dysfunction and exclusion scores from the TIDE platform (http://tide.dfci.harvard.edu/). We downloaded the results and got the scores, and now we put the specific results in Supplementary Table 4. We drew the ROC using the packages “survminer” and “timeROC” in R. At first, we combined the risk data and clinical EAC data, then we drew the ROC for 1, 2, and 3 years. Similarly, we plotted the joint ROC for Risk, TIDE, and TIS and the corresponding AUC. We compared their prognostic efficacy by observing their AUCs.
STATISTICAL ANALYSIS:
Figures were created and statistical analyses were performed in R (v4.1.0) software. The ‘limma’ (v 3.50.3) package was applied for statistical analysis of differentially-expressed genes. The WGCNA analysis was done with the help of the R package ‘WGCNA’(v1.69.0) and the enrichment analysis was performed using the ‘clusterProfiler’(v 4.2.2) and ‘GSVA’(v 1.42.0) packages. Univariate and multivariate survival analyses were performed using Cox regression using ‘survival’ (v 3.3.1) and ‘survminer’ (v 0.4.9). Mutation analysis and tumor microenvironment analysis were performed using the packages ‘maftools’ (v 2.10.5), “ESTIMATE” (v 1.0.13), and ‘cibersort’. In addition, ‘pheatmap’ (1.0.12), ‘ggpolt2’ (v 3.3.6), and ‘ggpubr’ (v 0.4.0) packages were used to generate images for this study. Comparisons of survival differences were performed using Kaplan-Meier survival curves, and significance was determined using log-rank values. Univariate and multivariate Cox regression analyses were conducted to identify risk factors. Differences in immune cell infiltration between high-risk and low-risk groups were evaluated using the Wilcoxon test. Significance in enrichment analysis was determined using a threshold of
Results
SCREENING IRDEGS:
We first explored the DEGs by ‘limma’ package between the EAC samples and normal samples and obtained a total of 3452 genes, of which 2756 genes were upregulated and 696 genes were downregulated, with a log2 FC >1 and P<0.05 (Figure 1A). By using the interact function in R, we obtained the intersection of DEGs and IRGs, resulting in a total of 394 IRDEGs (Figure 1B). Based on the expression of these genes, we used WGCNA analysis to select the gene modules associated with EAC. In this study, the optimal soft-thresholding power was ‘3’, and the association between genes reached a scale-free network distribution. A total of 4 modules were identified based on the average linkage hierarchical clustering (Figure 1C, 1D). Notably, we found a strong association between the ‘MEblue’ module and the tumor samples (Figure 1D). The linear mixed-effects model, also known as the mixed-effects regression model or multilevel model, is a statistical model that extends the traditional linear regression model to account for correlated and hierarchical data structures. The linear mixed-effects model revealed the ‘MEblue’ module genes were strongly associated with the development of EAC (t-value=0.56, P<0.001). In this module, we obtained 111 genes for further study.
FUNCTIONAL ENRICHMENT ANALYSIS:
Our study identified 111 significantly enriched IGDEGs and 346 enriched GO pathways (FDR <0.05), including 47 molecular function (MF) terms, 287 biological process (BP) terms, and 12 cellular component (CC) terms (Figure 2A). The enriched pathways primarily include: positive regulation of response to biotic stimulus, regulation of response to biotic stimulus, interleukin-1-mediated signaling pathway, positive regulation of innate immune response, NIK/NF-kappa-B signaling, and anaphase promoting complex-dependent catabolic process. The KEGG analysis showed that the genes related to the ‘MEblue’ module involved 12 terms (FDR <0.05), which mainly contain Epstein-Barr virus infection, Cytokine–cytokine receptor interaction, and Neuroactive ligand–receptor interaction (Figure 2B).
CONSTRUCTION AND VALIDATION OF 4 PROGNOSTIC GENES SIGNATURE:
We performed a univariate Cox regression analysis based on the 111 IRDEGs and found that 12 genes were associated with the OS of the EAC patients (Figure 3A): ZBTB16 (HR.95: 0.172–0.999, P<0.05), CCNA2 (HR.95: 1.054–4.061, P<0.05), TXNIP (HR.95: 0.450–0.977, P<0.05), HMGB1 (HR.95: 1.288–7.686, P<0.05), UNC93B1 (HR.95: 0.221–0.865, P<0.05), HSPA14 (HR.95: 1.383–7.686, P<0.05), PSMA7 (HR.95: 1.269–8.953, P<0.05), HDAC1 (HR.95: 1.002–5.375, P<0.05), HMGB3 (HR.95: 1.472–5.828, P<0.05), PSMD14 (HR.95: 1.115–7.440, P<0.05), FGF13 (HR.95: 1.095–10.829, P<0.05), and AR (HR.95: 0.008–0.972, P<0.05). Then, a multivariate Cox regression analysis showed that 4 genes [Unc-93 homolog B1 (UNC93B1 (HR: 0.358, HR.95: 0.170–0.755, P<0.05)), heat shock protein family-A member 14 (HSPA14 (HR: 2.883, HR.95: 1.123–7.397, P<0.05)), androgen receptor (AR(HR: 0.121, HR.95: 0.010–1.547, p=0.10)), and fibroblast growth factor 13 (FGF13 (HR: 3.197, HR.95: 0.988–10.344, P=0.05))] affected the OS of the EAC patients (Figure 3B, Supplementary Table 5). Among them, UNC93B1 and HSPA14 were the independent risk factors (HR >1). Next, we used these 4 genes to construct a prognostic signature.
The risk score was calculated as follows: expression level of UNC93B1*(−1.03) + expression level of HSPA14*(1.06) + expression level of AR*(−2.10) + expression level of FGF13*(1.16). Based on the median risk score of each EAC sample, we divided these samples into high- (38 samples) and low-risk (39 samples) groups. We performed univariate and multivariate Cox regression analyses combining the clinical parameters to evaluate the risk model. We found that the risk score was an independent risk factor of OS in EAC patients (HR=1.825, P=0.002, Figure 3C, 3D).
Then, we created a prognostic hazard curve to better understand the prognostic model. The Kaplan-Meier curve showed that the patients in the high-risk group had significantly higher death probability than those in the low-risk group (log-rank test P<0.001, Figure 4A), and similarly, in dataset GSE13898, patients in the high-risk group had significantly worse survival risk than those in the low-risk group (log-rank test P=0.038 Figure 4E). As a patient’s risk score increases, the patient’s risk of death also increases in both TGCA and GSE13898 cohorts (Figure 4B, 4D, 4F, 4H). The risk heatmap showed that the HSPA and FGF14 were the upregulated genes and the UNC93B1 and AR were the downregulated genes in the high-risk group, while in the low-risk group, HSPA and FGF14 were the downregulated genes and UNC93B1 and AR were the upregulated genes (Figure 4C). HSPA, FGF14, and UNC93B1 were the downregulated genes in the high-risk group (Figure 4G).
MOLECULAR CHARACTERISTICS OF DIFFERENT RISK GROUPS:
GSEA was performed to explore the pathways in the EAC patients of different risk groups. The results indicated that the gene sets of the low-risk samples were mainly associated with immune-related pathways, including autoimmune thyroid disease, calcium signal pathway, and primary immunodeficiency (Figure 5A), while the gene sets of the high-risk samples were tightly linked to DNA replication, maturity-onset diabetes, and mismatch repair pathways (Figure 5B).
Then, we explored the gene mutations of the high- and low-risk groups. We selected the top 10 genes with the highest mutation rates in the EAC patients to observe their mutation rates in the 2 groups. We found that all patients in the high-risk group had genetic mutations, whereas 92.31% of patients in the low-risk group had genetic mutations; however, there was no statistically significant difference in the mutation rates between the 2 groups (Fisher’s test, P=0.24). Missense mutations were the most common type among all the mutation types (Figure 5C, 5D). Moreover, we found that the TP53 mutation rate (89% vs 64%, χ2=3.9, P=0.048) was higher in the high-risk group than in the low-risk group, whereas the MUC16 mutation rate (16% vs 41%, χ2=5.7, P=0.017) was lower in the high-risk group than in the low-risk group (Supplementary Table 6). Later, we compared the TMB between the 2 groups and found no statistically significant difference between them (P>0.05, Figure 5E), and there was no correlation between the risk score and TMB (R=0.058, P=0.62, Figure 5F).
THE CLINICAL CHARACTERISTICS AND IMMUNE CELLS INFILTRATION IN DIFFERENT RISK GROUPS:
After excluding patients with incomplete clinical information, we collected data from 35 patients with esophageal adenocarcinoma (EAC) from TCGA. Among them, there were 4 female patients and 31 male patients. In terms of age, there were 18 patients older than 65 years and 17 patients aged 65 years or younger. As for the tumor grade, there were 12 patients classified as G1, 15 patients as G2, and 18 patients as G3. Regarding the cancer stage, there were 4 patients classified as stage I, 13 patients as stage II, 14 patients as stage III, and 2 patients as stage IV. We explored the clinicopathological characteristics in the high- and low-risk groups and found no statistically significant difference between the 2 groups in age (Fisher test P>0.05), gender (Fisher test P>0.05), grade (Fisher test p>0.05), stage (Fisher test p>0.05) (Figure 6A). To better understand the immune cell infiltration in the high- and low-risk groups, we compared the proportion of immune cell infiltration between the 2 groups (Figure 6B). We subsequently compared the difference in the immune cell infiltration and immune functions between the 2 groups with a Wilcoxon test and found that M2 macrophages (P<0.05) and resting mast cells (P < 0.05) were higher in the low-risk group than in the high-risk group, whereas activated mast cells (P < 0.05) were higher in the high-risk group (Figure 7A). Immune cell functions such as para-inflammation (P<0.05), Type I interferon response (P<0.05), and Type II interferon response (P<0.05) were significantly higher in the low-risk group (Figure 7B), which reveals that these immunological functions were more active in the low-risk group.
IMMUNE RESPONSE AND IMMUNE THERAPY IN DIFFERENT RISK GROUPS:
To evaluate the efficacy of immunotherapy in different risk groups, we assessed the differentially-expressed immune checkpoint-related genes between the high- and low-risk groups. According to the Wilcoxon test method, we found that the genes CD47 (P=0.039), CD200R1 (P=0.023), LGALS9 (P=0.0043), VSIR (P=0.00013), and VTCN1 (P=0.025) had higher expression in the low-risk group than in the high-risk group, whereas PVR (P=0.015) had a higher expression in the high-risk group (Figure 8A–8F). We also analyzed the correlation between those 6 immune checkpoint genes (CD47, CD200R1, LGALS9, VSIR, VTCN1, and PVR) and immune cells based on Spearman correlation analysis, showing a positive correlation between those 6 genes and M2 macrophage. In addition, we found CD47, LGALS9, PVR, and VSIR were negatively correlated with activated mast cells (Supplementary Figure 3). These results imply that these immune response-related genes are more likely to be expressed in the low-risk group, which may provide additional targets for future immunotherapy.
Then, we obtained TIDE scores (Supplementary Table 4) and used the TIDE algorithms and subclass mapping to evaluate the mechanism of tumor immune escape and predict the clinical response to ICI therapy. Patients with a high score have a higher tendency to immune escape, and these patients are less likely to benefit from ICI therapy. We found that the high-risk group had lower TIDE scores than the low-risk group (P<0.001, Figure 9A), which indicated that the patients in the high-risk group are more suitable for immunotherapy. Then we analyzed the difference between risk scores and microsatellite instability score according to Wilcoxon test, but there was no difference in microsatellite instability between the 2 groups (P>0.05, Figure 9B). Moreover, we found that the low-risk group had a higher cytotoxic T-lymphocytes dysfunction (P<0.001, Figure 9C). We further explored the relationship between different risk groups and cytotoxic T-lymphocytes exclusion, but we did not find statistically significant differences in the results (P>0.05, Figure 9D). The ROC curve was used to assess the stability of the risk model. The AUC values of the ROC curves were 0.729 (1-year survival), 0.842 (2-year survival), and 0.693 (3-year survival) (Figure 9E). AUC is a commonly used metric for evaluating the performance of classification models. It measures the accuracy of binary classification models at different thresholds. A higher AUC value indicates better performance, and our research suggests that the predictive performance of the risk score is relatively accurate. We found that our model (AUC=0.693) had a higher AUC value than the values in the TIDE (AUC=0.343) and TIS (AUC=0.541), which validated our model in predicting the prognosis in EAC patients (Figure 9F).
Discussion
To improve the prognosis and treatment of patients with EAC, many efforts have been made to find potential prognostic factors and new drugs. Although several studies showed that ICI therapy is an effective treatment for patients with EAC [22,23], its clinical applications to EAC are still at an early stage, with many unanswered questions. Due to the presence of drug resistance and immune escape, only a subset of patients benefit from ICI therapy, and predictive biomarkers specific to EAC need to be validated [9]. Although PD-1/PD-L1 is the most commonly used ICI, it is not highly expressed in all patients, and a study of EAC showed a higher expression of checkpoint markers such as LAG3, TIM3, CTLA4, and CD276 than PD-1/PD-L1, which supports a combination of different checkpoint inhibitors in EAC patients [24].
In our study, we used WGCNA and identified 111 IRDEGs, and 12 genes were significantly affecting the OS of EAC patients. Based on 4 genes (UNC93B1, HSPA14, AR, FGF13), we constructed an IRGS, which is an independent prognostic factor for OS. The survival analysis showed that patients in the low-risk group had better survival.
UNC93B1 is a highly conserved transmembrane protein resident in the endoplasmic reticulum with 12 transmembrane structural domains and 598 amino acid residues [25]. It has been reported that UNC93B1 can activate the Toll-like receptors (TLRs) by activating the pathogen-associated molecular pattern and danger-associated molecular pattern, which can trigger a pro-inflammatory immune response, promote the secretion of inflammatory factors, improve the immune level of the body, and promote the occurrence and development of diseases [26]. A recent study showed that UNC93B1 was overexpressed in human oral squamous cell carcinomas and that UNC94B1 enhanced the proliferation of oral squamous cell carcinomas by promoting cell-cycle progression [27]. HSPA14 is a homologous molecule of HSP70 which makes up the mammalian ribosomal-associated complex. When a cell is in a stable state, HSPA14 is in the cytoplasm. When a cell is under stress, the intracellular HSPA14 is released outside to play an immunostimulatory role, which depends on the existence of antigen-presenting cells, especially dendritic cells [28]. HSPA14 can bind to TLR2/TLR4 on the surface of antigen-presenting cells, activate nuclear factor kappa-B and MARKs pathways, and induce the release of inflammatory cytokines and functional maturation of dendritic cells, thus activating innate and adaptive immune responses [29]. A high expression of HSPA14 has been observed in HCC, and HSPA14 can inhibit the proliferation, invasion, and metastasis of HCC cells [30,31]. While the mechanisms of UNC93B1 and HSPA14 in EAC remains unknown.
AR is a member of the steroid receptor family, and it is associated with a wide range of tumors, including breast cancer, prostate cancer, and ovarian cancer [32–34]. Additionally, accumulating evidence showed AR overexpression in EAC; immunohistochemistry studies reported that AR expression was observed in 45–97.4% of cases [35,36]. Another study showed that AR is an independent prognostic indicator of EAC (HR 2.89, 95% CI 1.40–6.0,
FGF13, also known as FGF2, is a member of the fibroblast growth factor family. FGF13 regulates tumor proliferation, apoptosis, and invasion via several metabolic pathways. Several studies reported overexpressed of FGF13 in a variety of cancers, including colorectal cancer, breast cancer, lung adenocarcinoma, and pancreatic carcinoma [38–41]. Some researchers used FGF13 as a risk factor to establish a prognostic model to evaluate the prognosis of cancer patients and achieved good results [42–43]. In vitro experiments showed that FGF2 was highly expressed in EAC cell lines [44]. High expression of FGF2 was correlated with an increased risk of tumor recurrence (HR 3.8, 95% CI 1.64–8.76) and reduced overall survival (HR 2.11, 95% CI 1.0–4.58) after surgical resection of esophageal cancer [45]. Furthermore, previous studies demonstrated that FGF2 expression was reduced after COX-2 inhibitor-induced cell proliferation in EAC cells, suggesting that the anti-tumor effects of COX-2 inhibitor may be mediated through inhibition of FGF2 [46]. Therefore, inhibition of FGF13 expression offers potential value for treating EAC and improving the prognosis of EAC patients.
To further explore molecular characteristics, we performed GSEA and studied the gene mutations of different risk groups. The results of GSEA showed that different molecular mechanisms involved in the initiation and progression of EAC were significantly associated with the risk status of the 2 groups of EAC patients. These genes are mainly involved in autoimmune and DNA replication related pathways for the low-risk group and high-risk group, respectively. Regarding gene mutations, the most common type observed was missense mutation. TP53 was the most mutated gene in both groups but was more common in the high-risk group than in the low-risk group (89% vs 64%). A study reported that mutated TP53 negatively impacts the OS in EAC patients [47]. Similarly, in our study we observed a higher mutation rate of TP53 in the high-risk group, which showed a poor survival rate.
It is well known that immune cells either promote or suppress a tumor. Immune cell infiltration and functions are related to TIME, which is a novel prognostic factor in human cancers [48]. Our results demonstrated that M2 macrophages and resting mast cells were significantly enriched in the low-risk group whereas activated mast cells were significantly enriched in the high-risk group. Mast cells are commonly found in many human cancer types, and their level of accumulation has been associated with tumor growth [49]. A recent study showed that increased numbers of intra-tumoral mast cells promoted tumor progression and poor survival in cancer patients [50]. Mast cells regulated inflammation and angiogenesis in TME, which may be a potential target for cancer therapy [51].
The ICIs brought a conceptual shift in the treatment of advanced cancers. As few patients benefit from the existing ICI therapy, it is necessary to explore novel immune checkpoints. In our study, several common immune checkpoints were detected, and we found that CD47, CD200R1, LGALS9, VSIR, VTCN1, and PVR showed significant differences between the 2 risk groups.
CD47 is a member of the immunoglobulin superfamily. Previous studies indicated that high expression of CD47 was found in a variety of human tumors, including lung cancer, breast cancer, colorectal cancer, and hepatocellular cancer [52]. Although CD47 is associated with poor prognosis in many tumors [53–55], its role in esophageal cancer is not well characterized. Suzuki et al confirmed that high expression of CD47 was correlated with lymph node metastasis [56]. In vivo experiments showed that anti-CD47 enhanced pro-inflammatory responses and increased infiltration of CD8+ T cells in tumor tissues and also enhanced the anti-tumor efficacy of anti-PD-1 and CTLA-4 [57]. Similarly, another study showed that phagocytosis of tumor cells by macrophages was significantly increased when CD47 on tumor cells was blocked [58]. However, to date there have been no studies investigating the function of CD47 in EAC.
CD200R1 is the receptor of CD200. CD200 is overexpressed in many human tumors, including lung cancer [59], ovarian cancer [60], and acute myeloid leukemia [61]. However, targeting CD200 is difficult and may have potential adverse effects. Therefore, as an alternative method, targeting CD200R1 is more feasible for the treatment of human cancers. CD200R1 is strongly expressed in macrophages, neutrophils, and mast cells [62]. A previous study indicated that CD200R monoclonal antibody treatment significantly inhibited the formation of lung tumor lesions in mice [63]. This strategy can also be used as an immunotherapeutic modality in the treatment of EAC with overexpression of CD200R1.
LGALS9 (gal-9) belongs to the galectin family of animal lectins. Overexpression of LGALS9 is correlated with poor outcome in a variety of human tumors [64]. LGALS9 regulates cell aggregation and apoptosis and enhances anti-tumor capacity by initiating dendritic cell maturation [65]. Liang et al investigated the role of LGALS9 in gliomas cells, showing that high expression of GAL-9 was closely associated with the immune response in gliomas [66]. In addition, Akashi et al found that Gal-9 significantly suppressed cell viability and induced cell apoptosis in EAC cell lines. Therefore, LGALS9 may have potential clinical utility in the treatment of EAC.
VSIR (also known as VISTA, B7-H5, and SISP1) is a type I transmembrane protein primarily found in hematopoietic cells [67]. The role of VSIR in immune regulation is controversial. VSIR functions not only as a ligand on antigen-presenting cells but also as a receptor on T cells [68]. Pan-cancer analysis showed that VSIR is involved in several immune-related pathways, including cell proliferation, migration, and migration of immune cells [69]. However, the function of VSIR in EAC remains unknown. VTCN1 (also known as B7-H4) and PVR (also known as CD155) are 2 other immune checkpoint genes. Numerous studies evaluated the effect of VTCN1 and PVR in esophageal squamous cancer and found that VTCN1 and PVR expression is associated with tumor progression and promotes cell proliferation [70–73]. However, the value of these 2 genes in EAC has not been revealed. The study of these immune checkpoint genes may provide additional options for targeted therapy for EAC patients.
T cell dysfunction is manifested by manifested by loss of proliferation and effector function, as well as by the acquisition of significant metabolic and transcriptional alterations [74]. T cell exclusion exhibits decreased expression and effector function of cytokines produced by effector T cells and is resistant to reactivation [75]. The upregulation of immune checkpoints is one of the hallmarks of T cell dysfunction and exclusion, including PD-1, TIM-3, LAG-3, CTLA-4, and TIGIT [74,76]. They can bind to antigen-presenting cells in the tumor immune microenvironment and to ligands expressed by tumor cells, thereby impeding T cell function [77,78]. This allows tumor cells to evade immune surveillance and significantly reduces the effectiveness of immunotherapy.
Some tumors have high levels of cytotoxic T cell infiltration, but these T cells are often in a state of dysfunction, while in other tumors, T cells may be excluded from infiltrating the tumors by immunosuppressive factors [23,79]. TIDE involves 2 different mechanisms of immune escape. A study reported that the TIDE score is inversely associated with the clinical outcome of patients treated with anti-PD1 or anti-CTLA4 [80]. Our study showed that the low-risk group patients have higher TIDE and T cell dysfunction scores (but not T cell exclusion scores) than the high-risk group patients. Therefore, the lower immunotherapy response of the low-risk group might be due to the immune escape through T cell dysfunction. TIS is used to measure a pre-existing but suppressed adaptive immune response with tumors, which also focuses on the function and status of T cells. The TIS score can be used as a predictive biomarker for ICI therapy [81]. A study demonstrated the prognostic significance of TIS in different cancers, including breast cancer, cervical carcinomas, and sarcomas [81]. In our study, we compared the prognostic value of our risk model with those of TIDE and TIS, and the results demonstrated that our prognostic model had the largest AUC, which suggests that our model might be an important predictor of OS in EAC patients.
A previous similar study also investigated the prognostic factor, immune cell infiltration, and immune-related pathways in EAC [82]. Zhang et al found 12 IRGs (ADRM1, CXCL1, SEMG1, CCL26, CCL24, AREG, IL23A, UCN2, FGFR4, IL17RB, TNFRSF11A and TNFRSF21) in EAC. Among them, CCL26, CCL24, AREG, IL23A, TNFRSF11A, and TNFRSF21 were independent risk factors in EAC. Immune cell infiltration analysis showed that M0 was positively correlated with the high-risk group, while M1 and plasma cells were positively correlated with the low-risk group [82], but they did not explore the immune-related pathways in EAC. In the present study, we constructed an IRGS based on multivariate Cox regression analysis, and we found UNC93B1 and HSPA14 are the independent risk factors in EAC. In addition, immune cell infiltration showed that M2 macrophages and resting mast cells were positively correlated with the low-risk group whereas activated mast cells were positively associated with the high-risk group. In addition, GSEA analysis revealed that the low-risk group was mainly associated with immune-related pathways, including autoimmune thyroid disease, calcium signal pathway, and primary immunodeficiency, while the high-risk group was tightly linked to DNA replication, maturity-onset diabetes, and mismatch repair pathways. Both studies showed a robust performance of immune-related gene signature in predicting the risk of EAC. The differences in the prognostic factors, immune infiltration, and pathways were mainly due to the fact that we selected a larger set of immune genes and performed WGCNA analysis. Subsequently, we obtained results based on the genes from WGNA analysis, so the results were highly variable.
The present study has some limitations. First, this was a retrospective study, and our findings need to be verified in a prospective cohort study. Second, our results lack external validations on different platforms, which prevents our findings from being broadly generalizable and robust. Finally, this study relied on bioinformatics and therefore lacks validation of molecular biological mechanisms. In future studies, we need to conduct prospective cohort studies and validate them on different platforms and to perform in vivo/in vitro experiments to elucidate the functional roles and regulatory mechanisms of the identified genes.
Conclusions
In this study, we used IRGs and constructed a prognostic gene signature that can predict outcomes in EAC patients. Our model may provide insight into a potential immune checkpoint therapy by identifying the patients who are more suitable for immunotherapy. This allows for the development of individualized treatment strategies for clinical EAC patients, the identification of new treatment goals, and the improvement of patient prognosis and outcomes. Our prognostic signature model can be integrated with clinical practice and used as a predictive biomarker of immunotherapy response or as a tool for treatment stratification. Further in vitro and in vivo experiments are needed to validate our results.
Figures
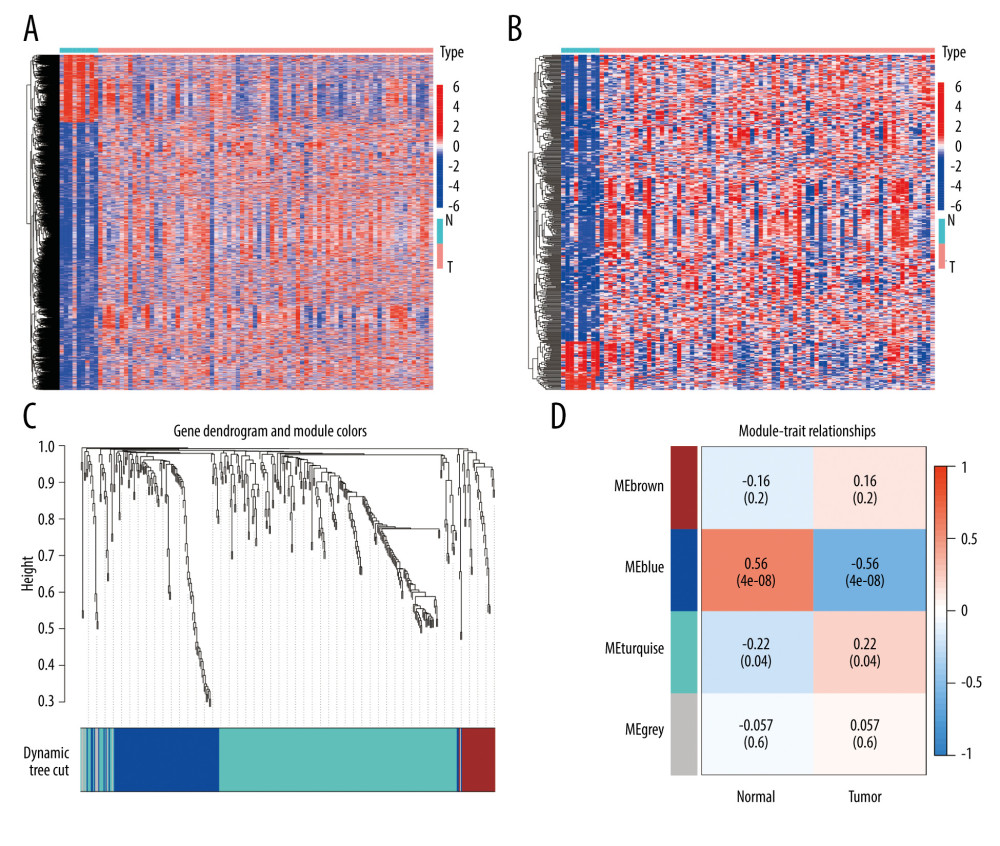 Figure 1. Identification of IRDEGs in EAC. (A) The heatmap shows all DEGs between 78 EAC samples (red) and 9 normal samples (blue) (P<0.05, |log2FC| >1). (B) The heatmap shows 394 IRDEGs. (C) WGCNA of immune-related DEGs. (D) Gene modules related to EAC obtained by WGCNA. EAC – esophageal adenocarcinoma; DEGs – differentially-expressed genes; WGCNA – weighted gene co-expression network analysis; IRDEGs – immune-related differentially-expressed genes.
 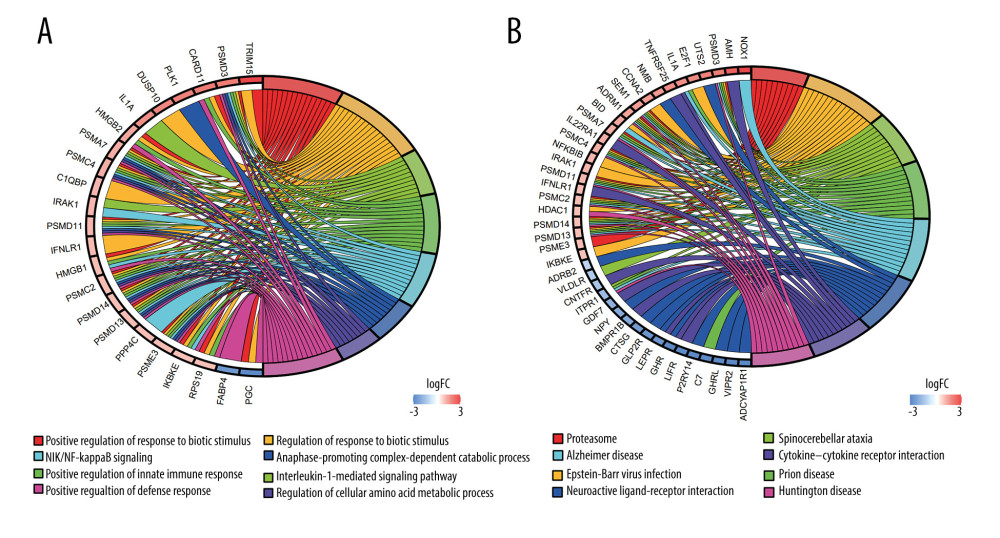 Figure 2. GO and KEGG analysis of the 111 IRDEGs. (A) GO enrichment analysis of the IRDEGs (P<0.05). (B) KEGG pathway analysis of the IRDEGs (P<0.05). IRDEGs – immune-related differentially-expressed genes; GO – gene ontology; KEGG – Kyoto Encyclopedia of Genes and Genomes.
 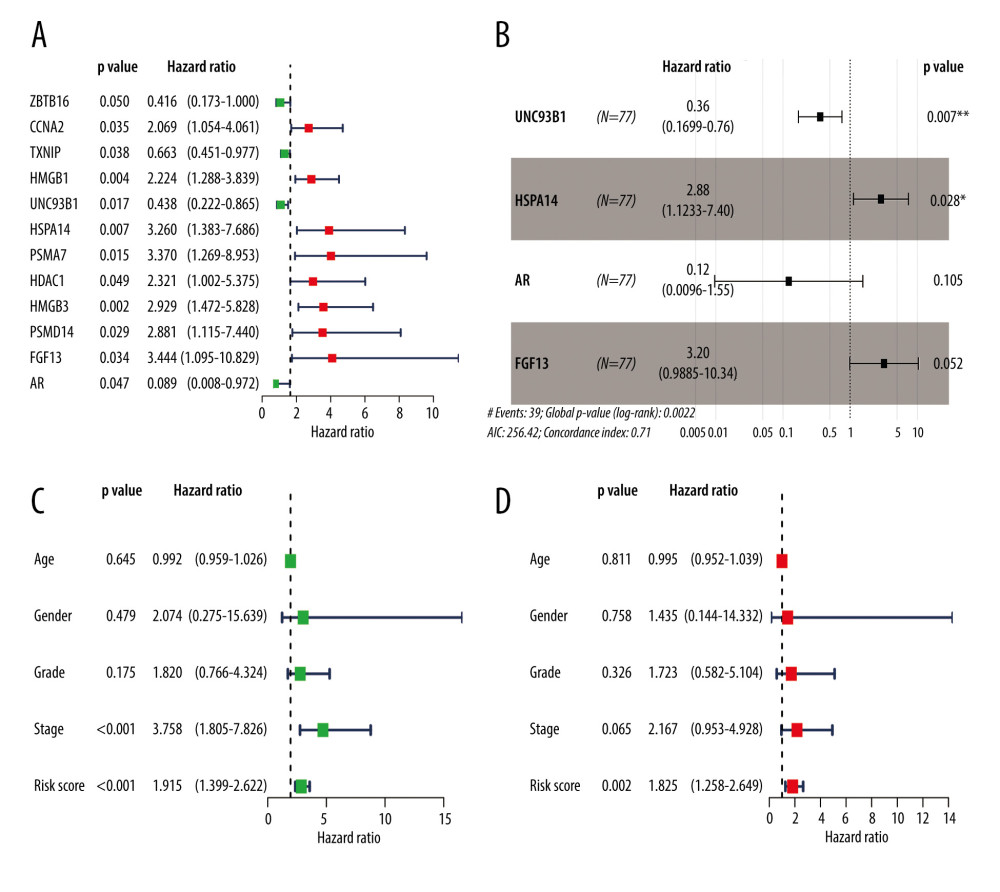 Figure 3. Results of the univariate and multivariate Cox regression analyses of the prognostic factors in EAC patients. (A) Univariate Cox analysis of the 12 immune-related prognostic genes. (B) Multivariate Cox analysis of the 4 gene prognostic indexes. (C) Univariate and (D) multivariate regression analyses demonstrated risk score as an independent factor affecting the prognosis in EAC patients. EAC – esophageal adenocarcinoma
 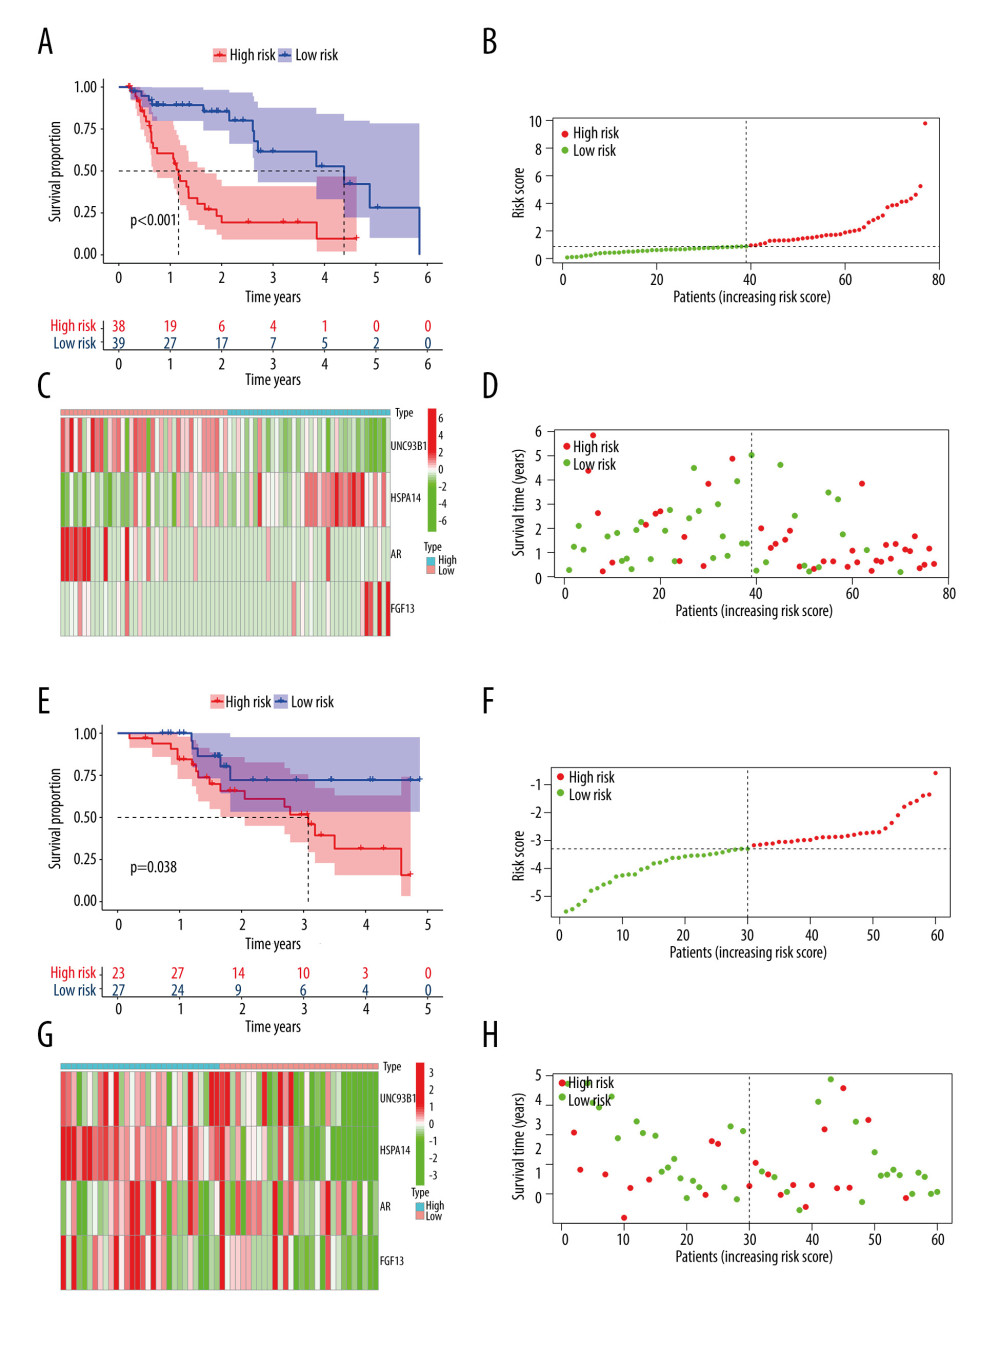 Figure 4. The Kaplan-Meier curve and prognostic hazard curves. Kaplan-Meier survival curves designate the overall survival among the high- and low-risk groups in TCGA (A) and GSE13898 (E). The risk scores of different groups in TCGA (B) and GSE13898 (F). The heatmaps of the expression profiles of the 4 immune-related genes in TCGA (C) and GSE13898 (G). The survival time and status of each patient in TCGA (D) and GSE13898 (H).
 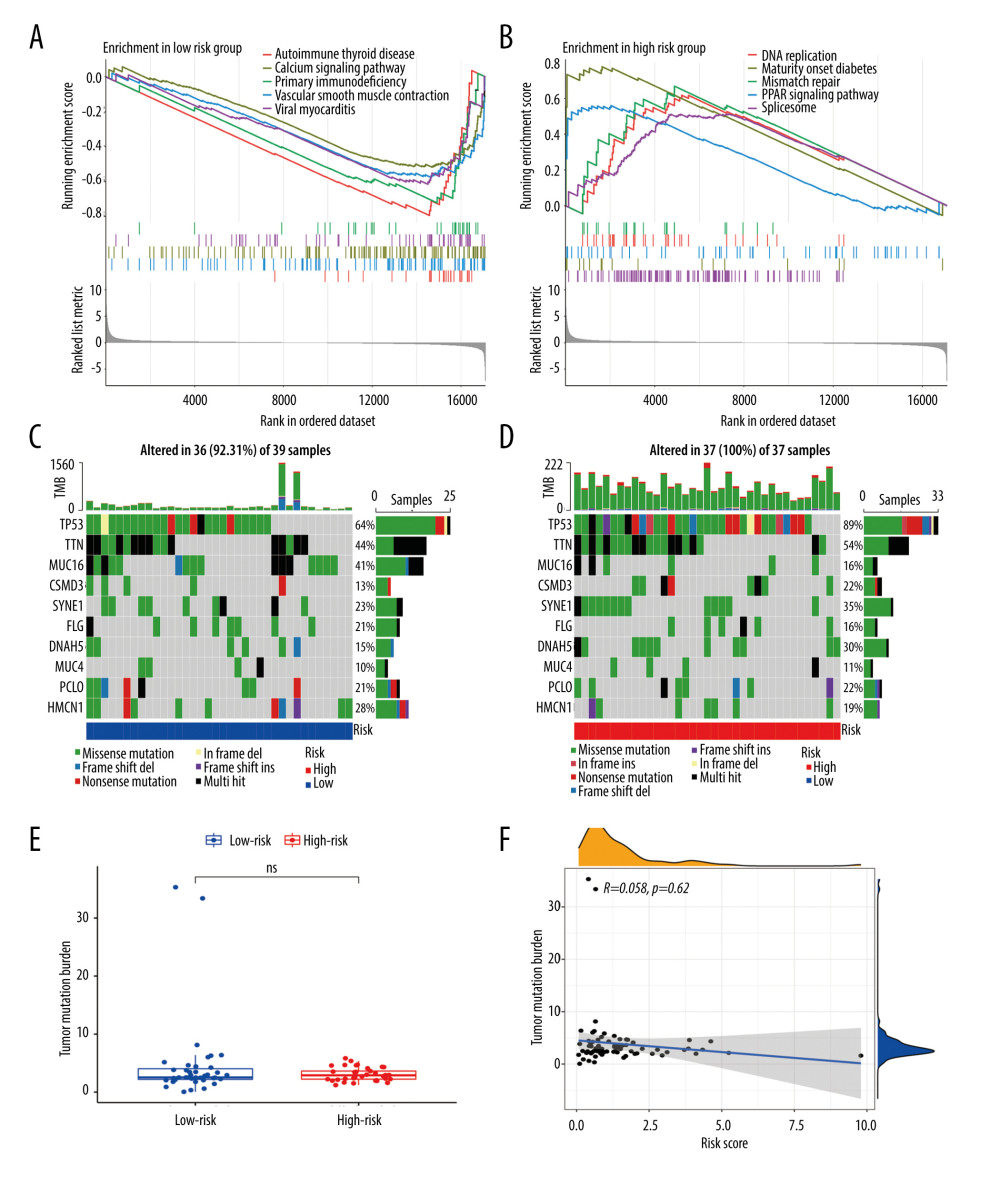 Figure 5. Gene set enrichment analysis and gene mutation analysis of the 2 risk groups. (A) The Kyoto Encyclopedia of Genes and Genomes enrichment results (top 5) in the low- and (B) high-risk groups (P<0.05). (C) The top 10 significantly mutated genes in the mutated EAC samples of the low- and (D) high-risk groups. (E) The difference in TMB in the 2 risk groups (ns – not significant). (F) Correlation analysis between the risk score and TMB. EAC – esophageal adenocarcinoma; TMB – tumor mutation burden.
 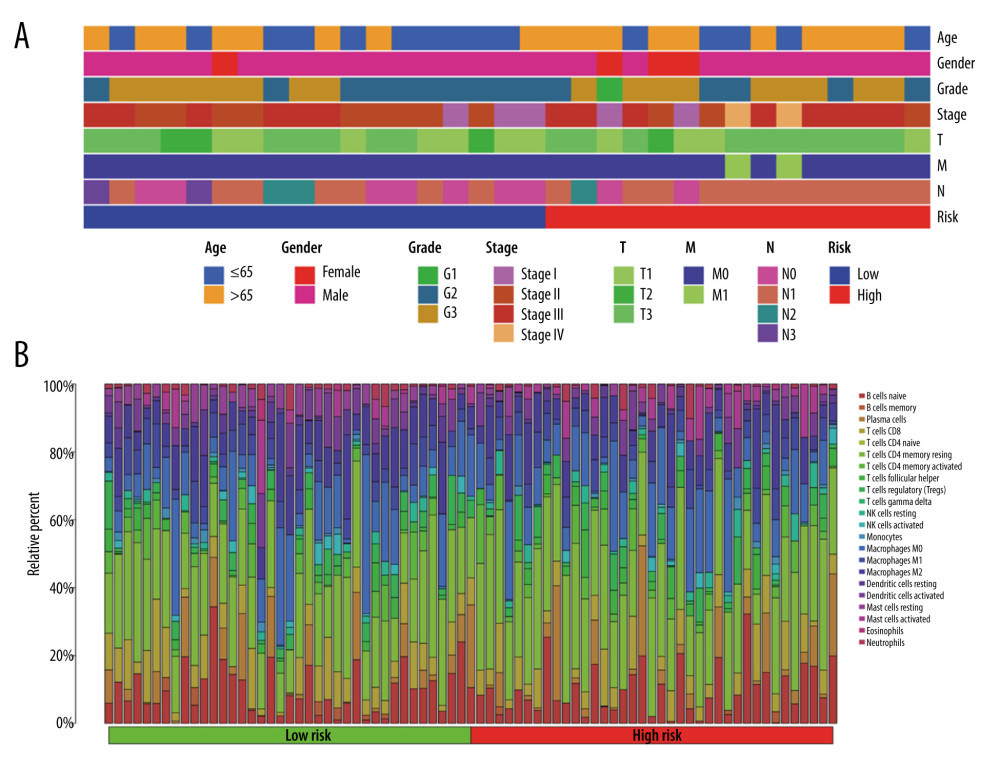 Figure 6. The clinical characteristics and immune cell infiltration in different risk groups. (A) Basic clinicopathological characteristics of the 2 groups. (B) The proportions of TME cells for EAC patients in low- and high-risk groups.
 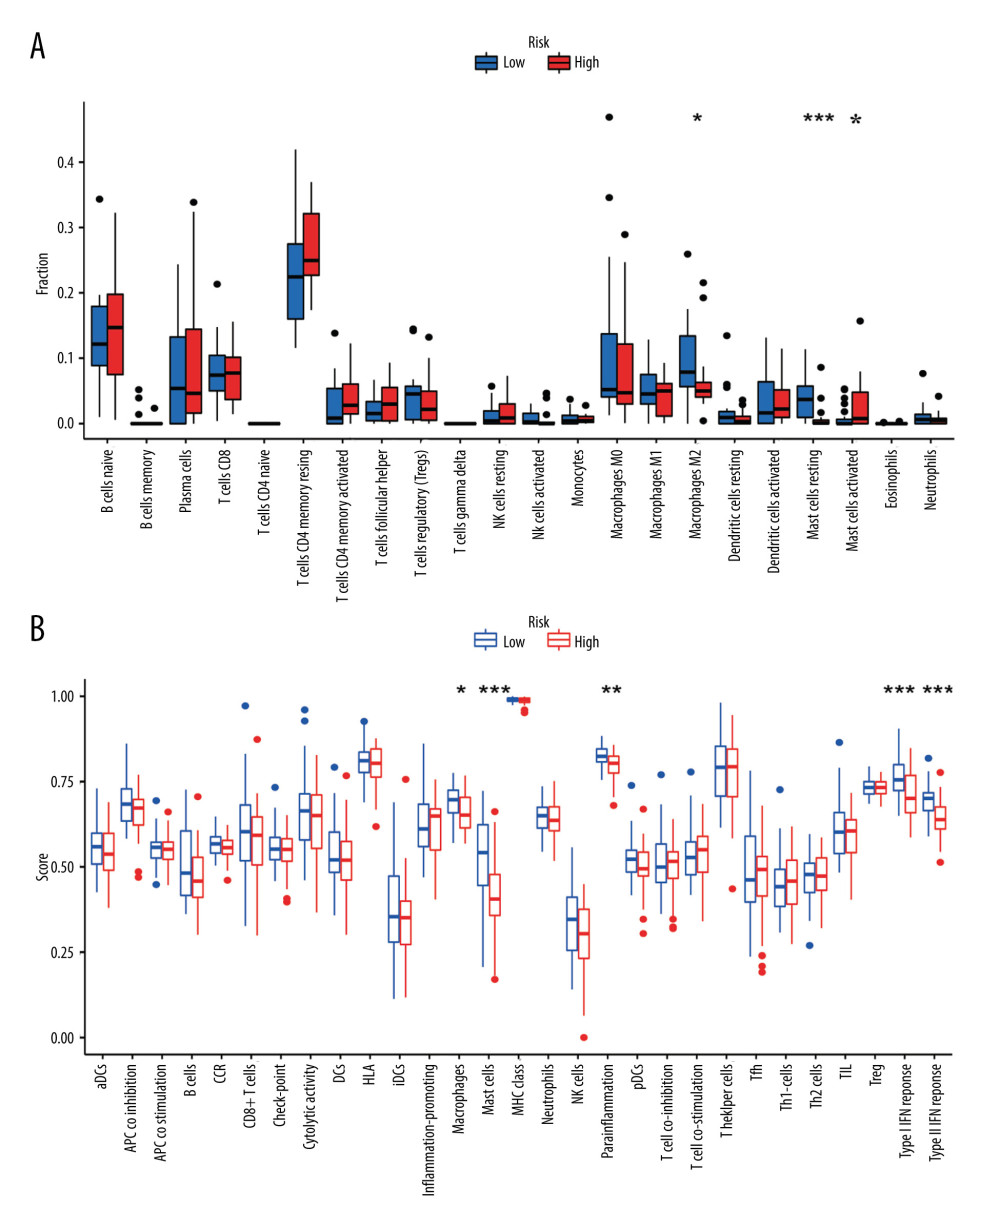 Figure 7. The difference in immune cell infiltration and immune functions between the 2 risk groups. (A) The fraction of 22 immune cells in the high- and low-risk groups (* P<0.05, ** P<0.01, *** P<0.001). (B) The score of immune cells-related functions in the high- and low-risk groups (* P<0.05, ** P<0.01, *** P<0.001).
 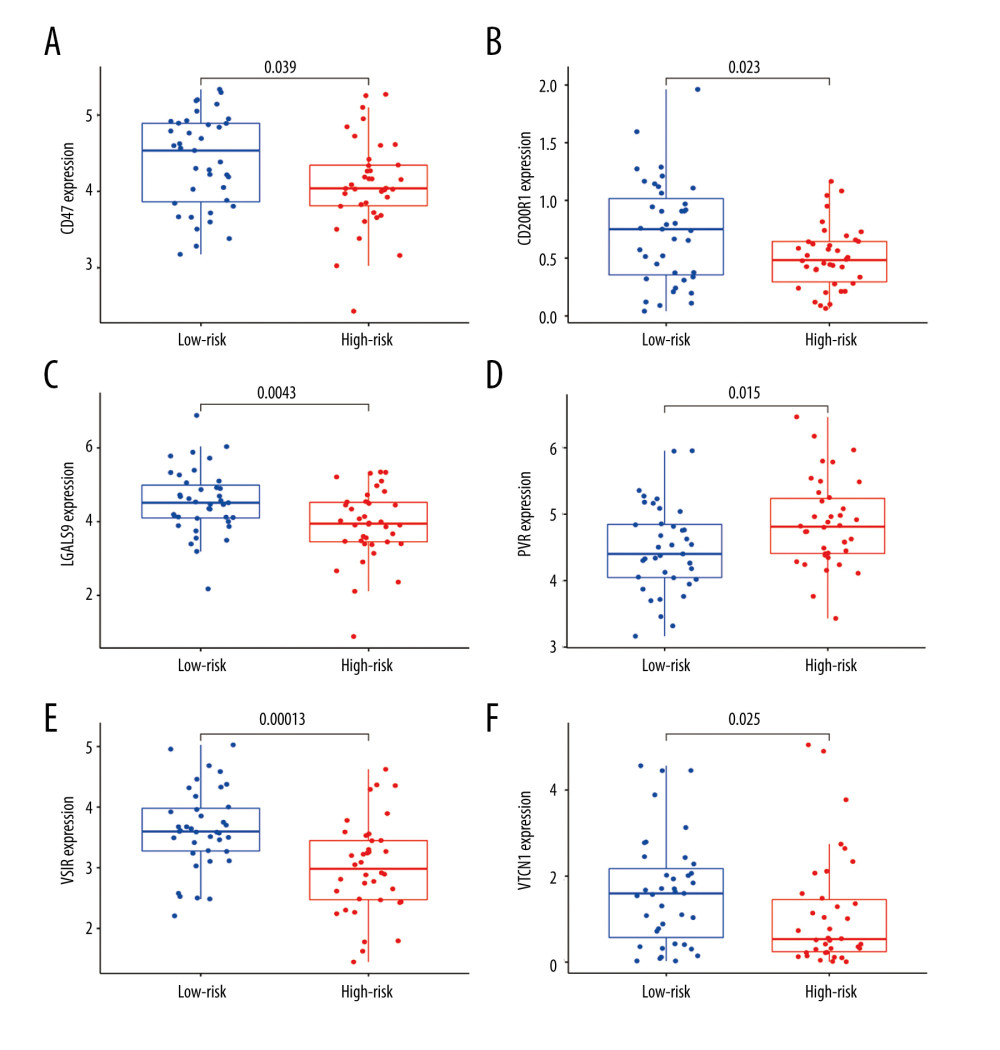 Figure 8. (A–F) mRNA expression of the 6 immune checkpoint genes (CD47, CD200R1, LGALS9, PVR, VSIR and VTCN1) in the high- and low-risk groups (P<0.05 was considered statistically significant).
 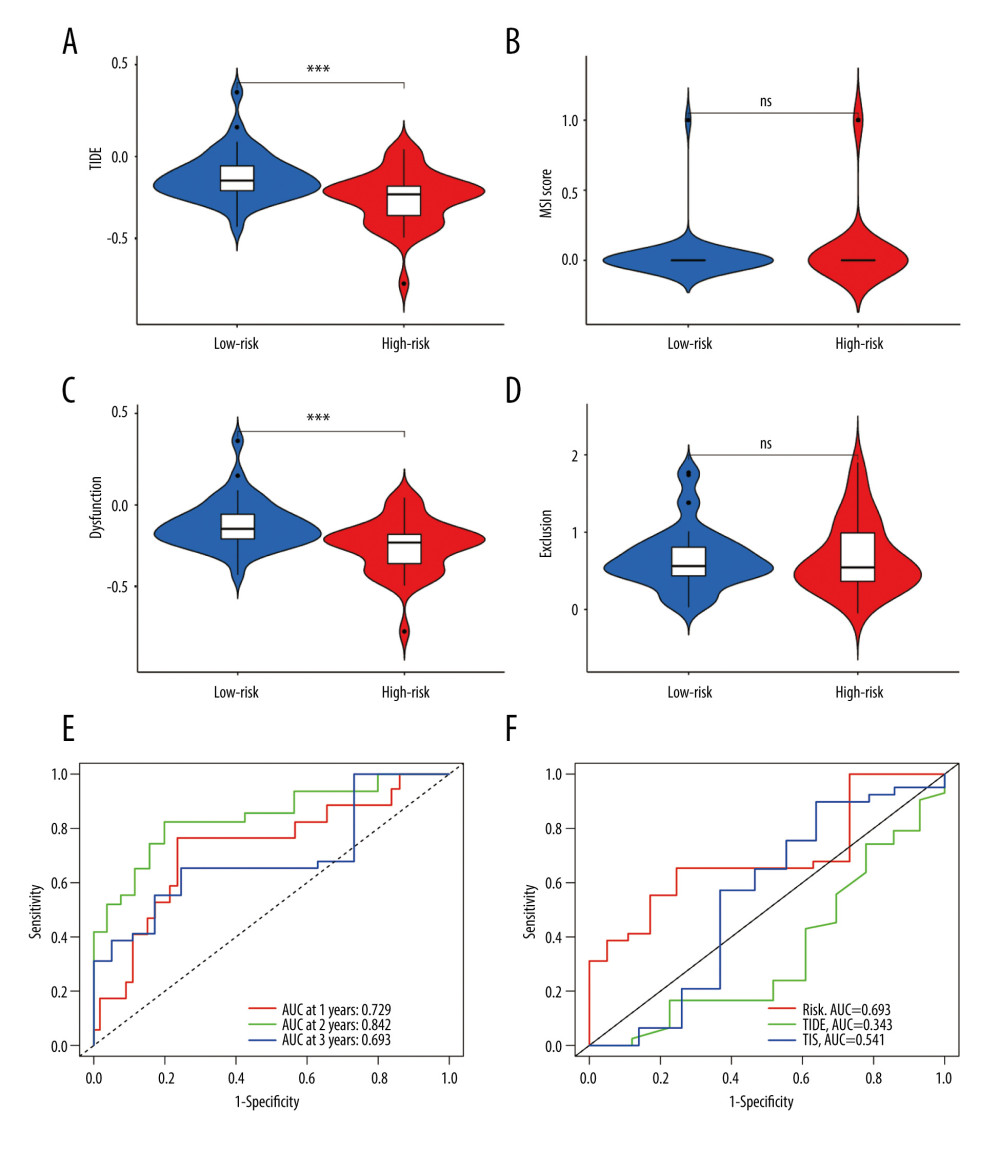 Figure 9. The evaluation of the efficacy of immunotherapy in different risk groups. (A–D) The results of TIDE, microsatellite instability, and T cell exclusion and dysfunction score in different risk groups (ns: not significant, * P<0.05, ** P<0.01, *** P<0.001). (E) Time-dependent ROC curve for 1-year, 2-year and 3-year predictions (our risk model). (F) ROC analysis of the risk model, TIDE and TIS on overall survival. TIDE – tumor immune dysfunction and exclusion; ROC – receiver operating characteristic; TIS – tumor inflammation signature.
 Tables
Supplementary Table 1. Clinical information of 87 EAC cases in TCGA.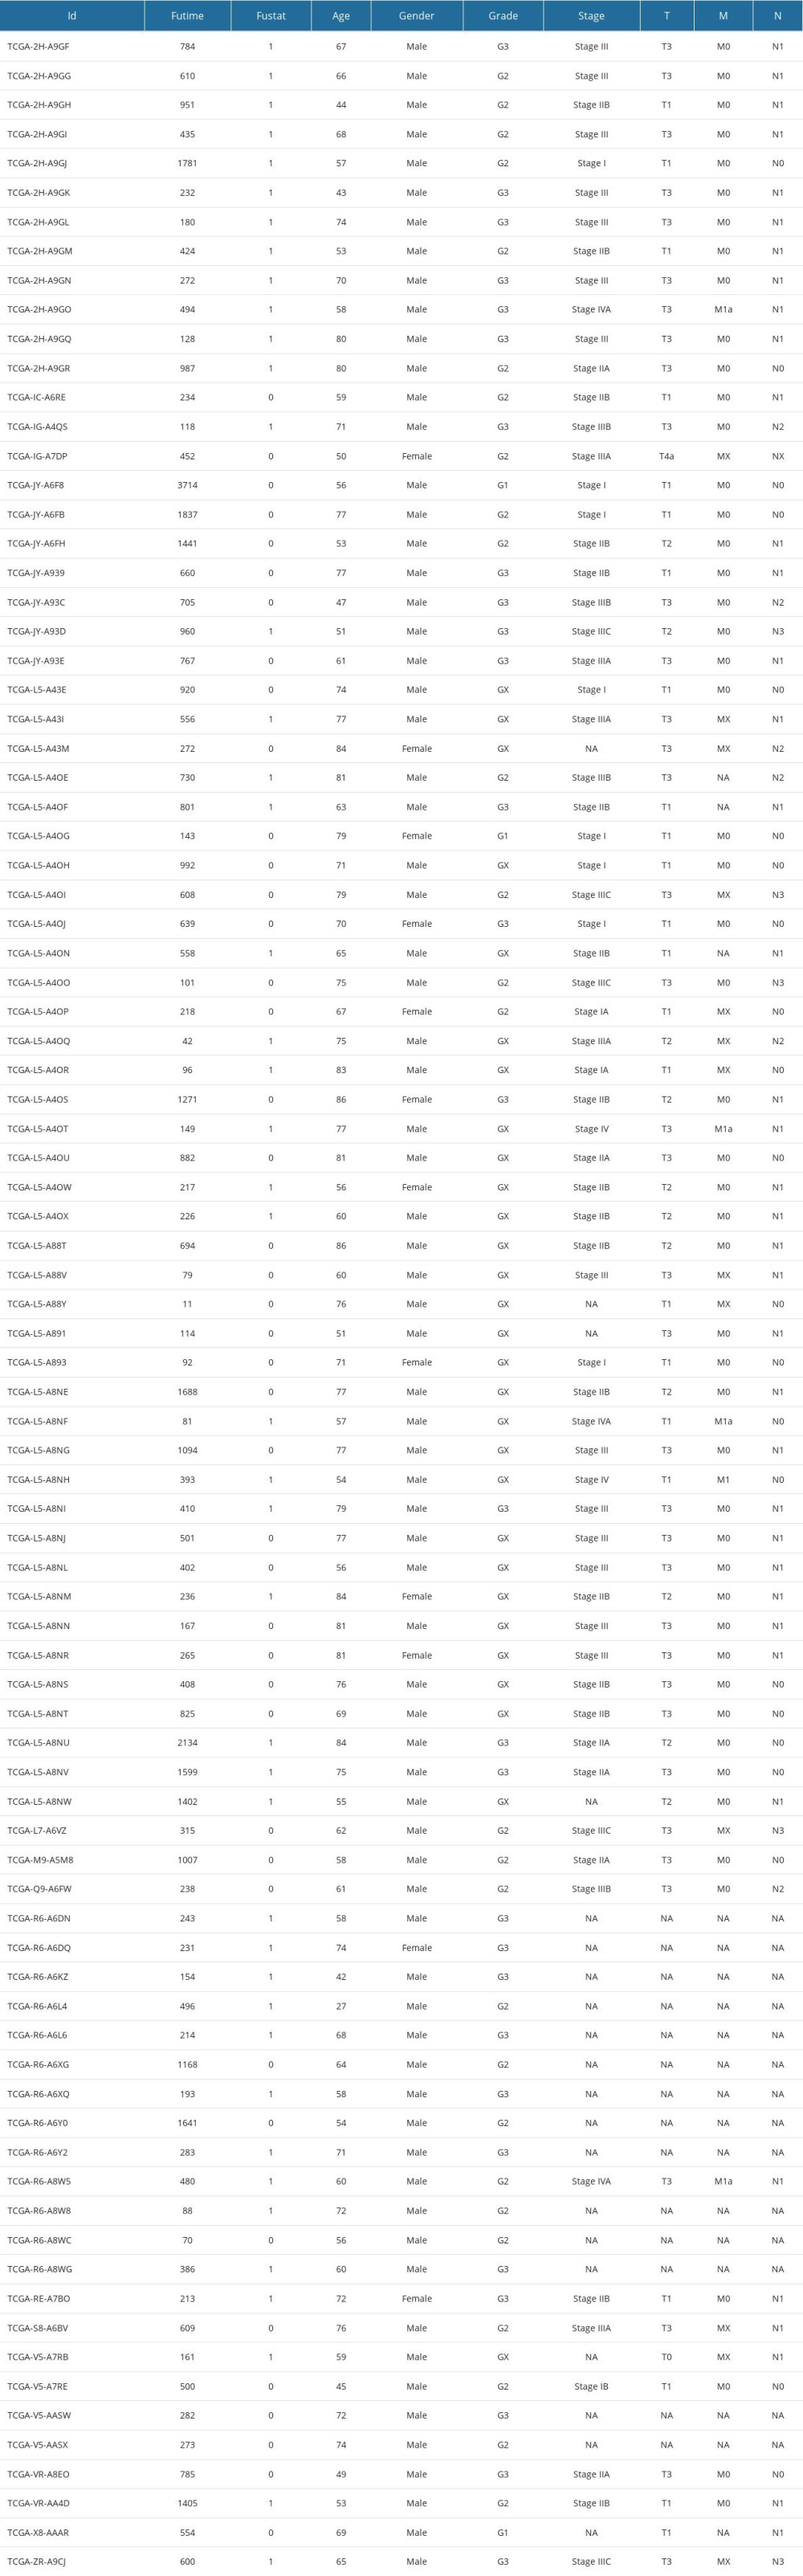 Supplementary Table 2. 394 IRDEGs.
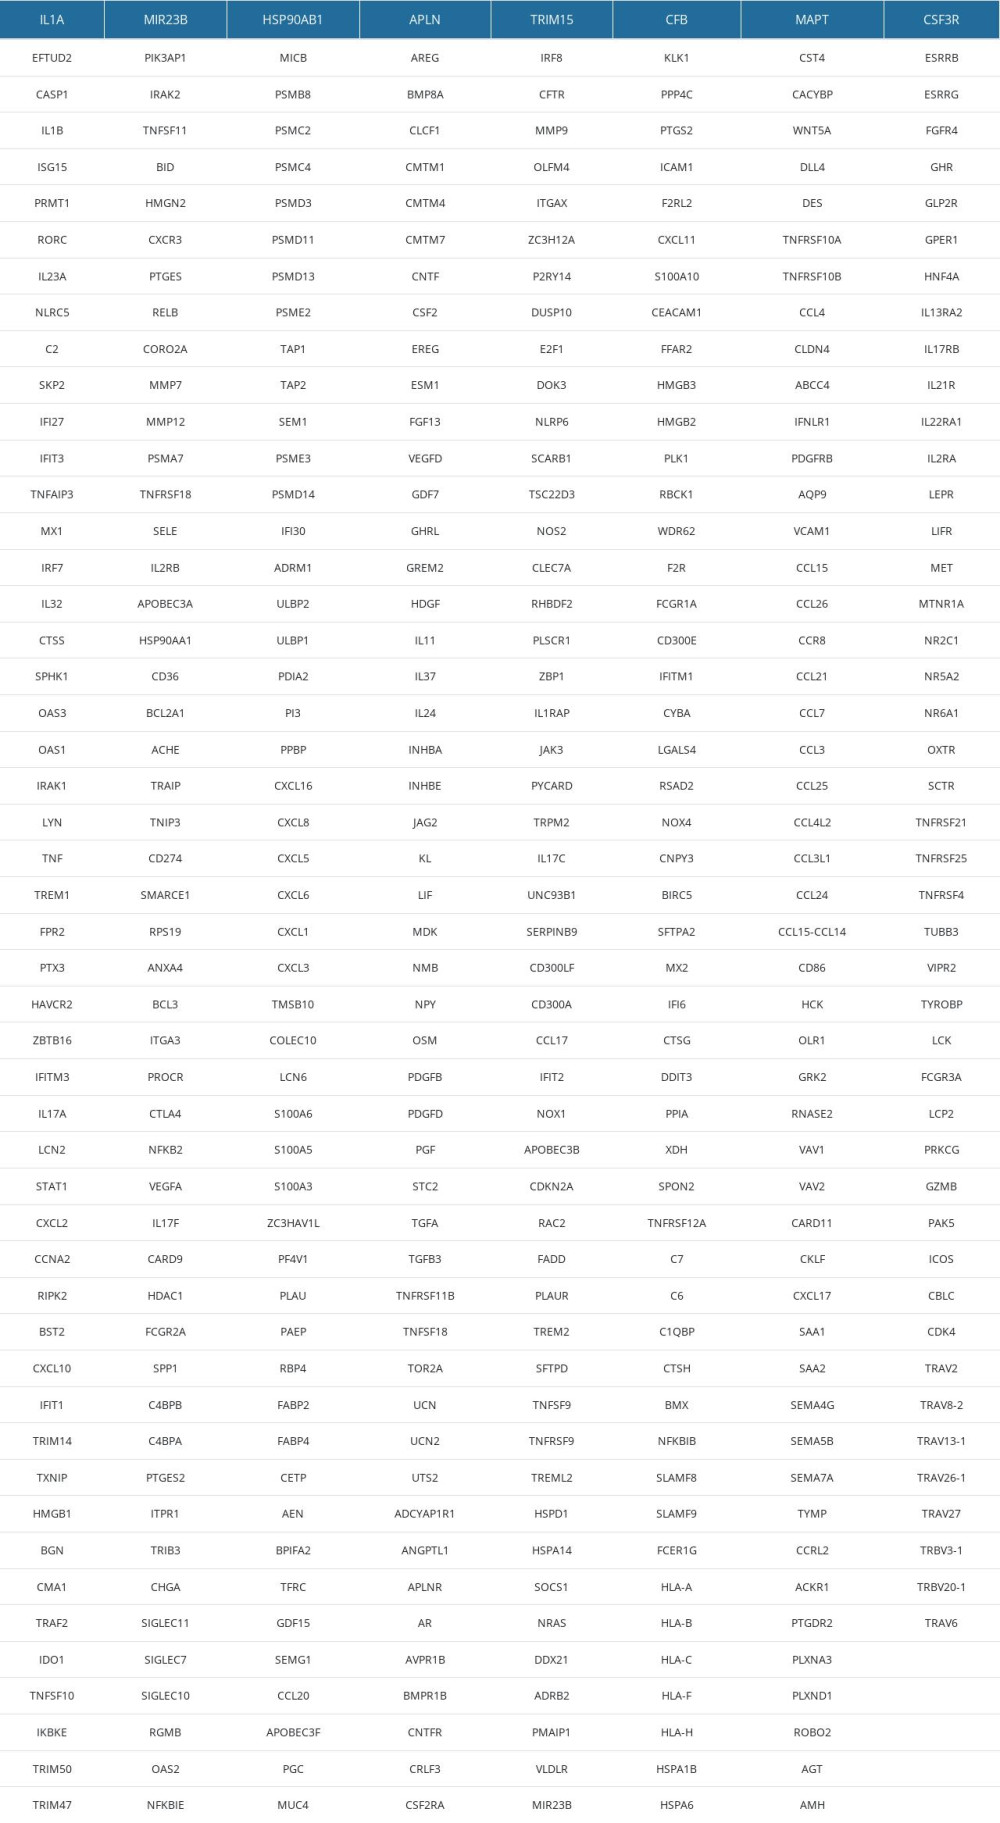 Supplementary Table 3. 111 IRDEGs in MEblue module.
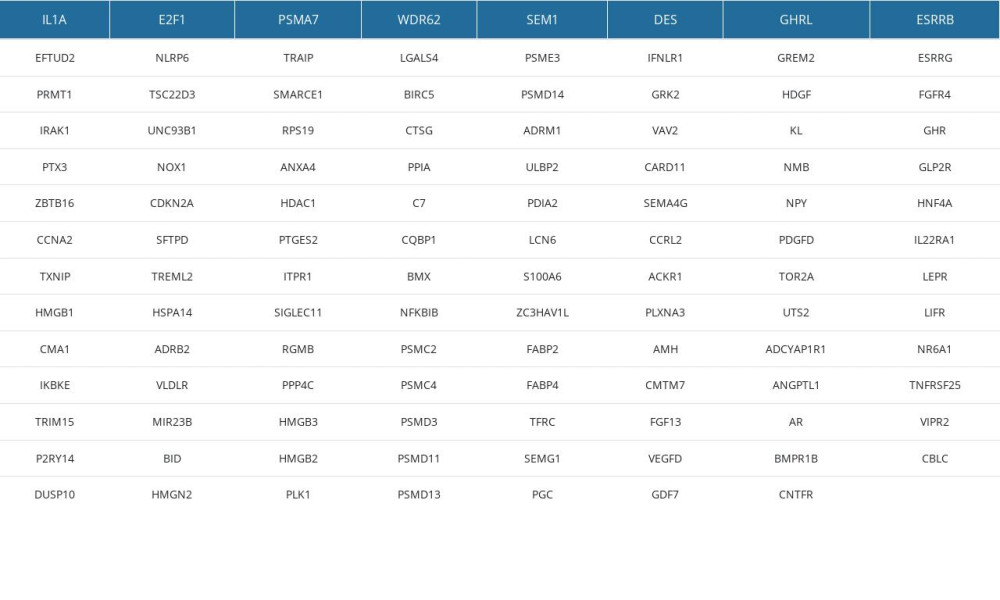 Supplementary Table 4. The results of TIDE, dysfunction and exclusion scores.
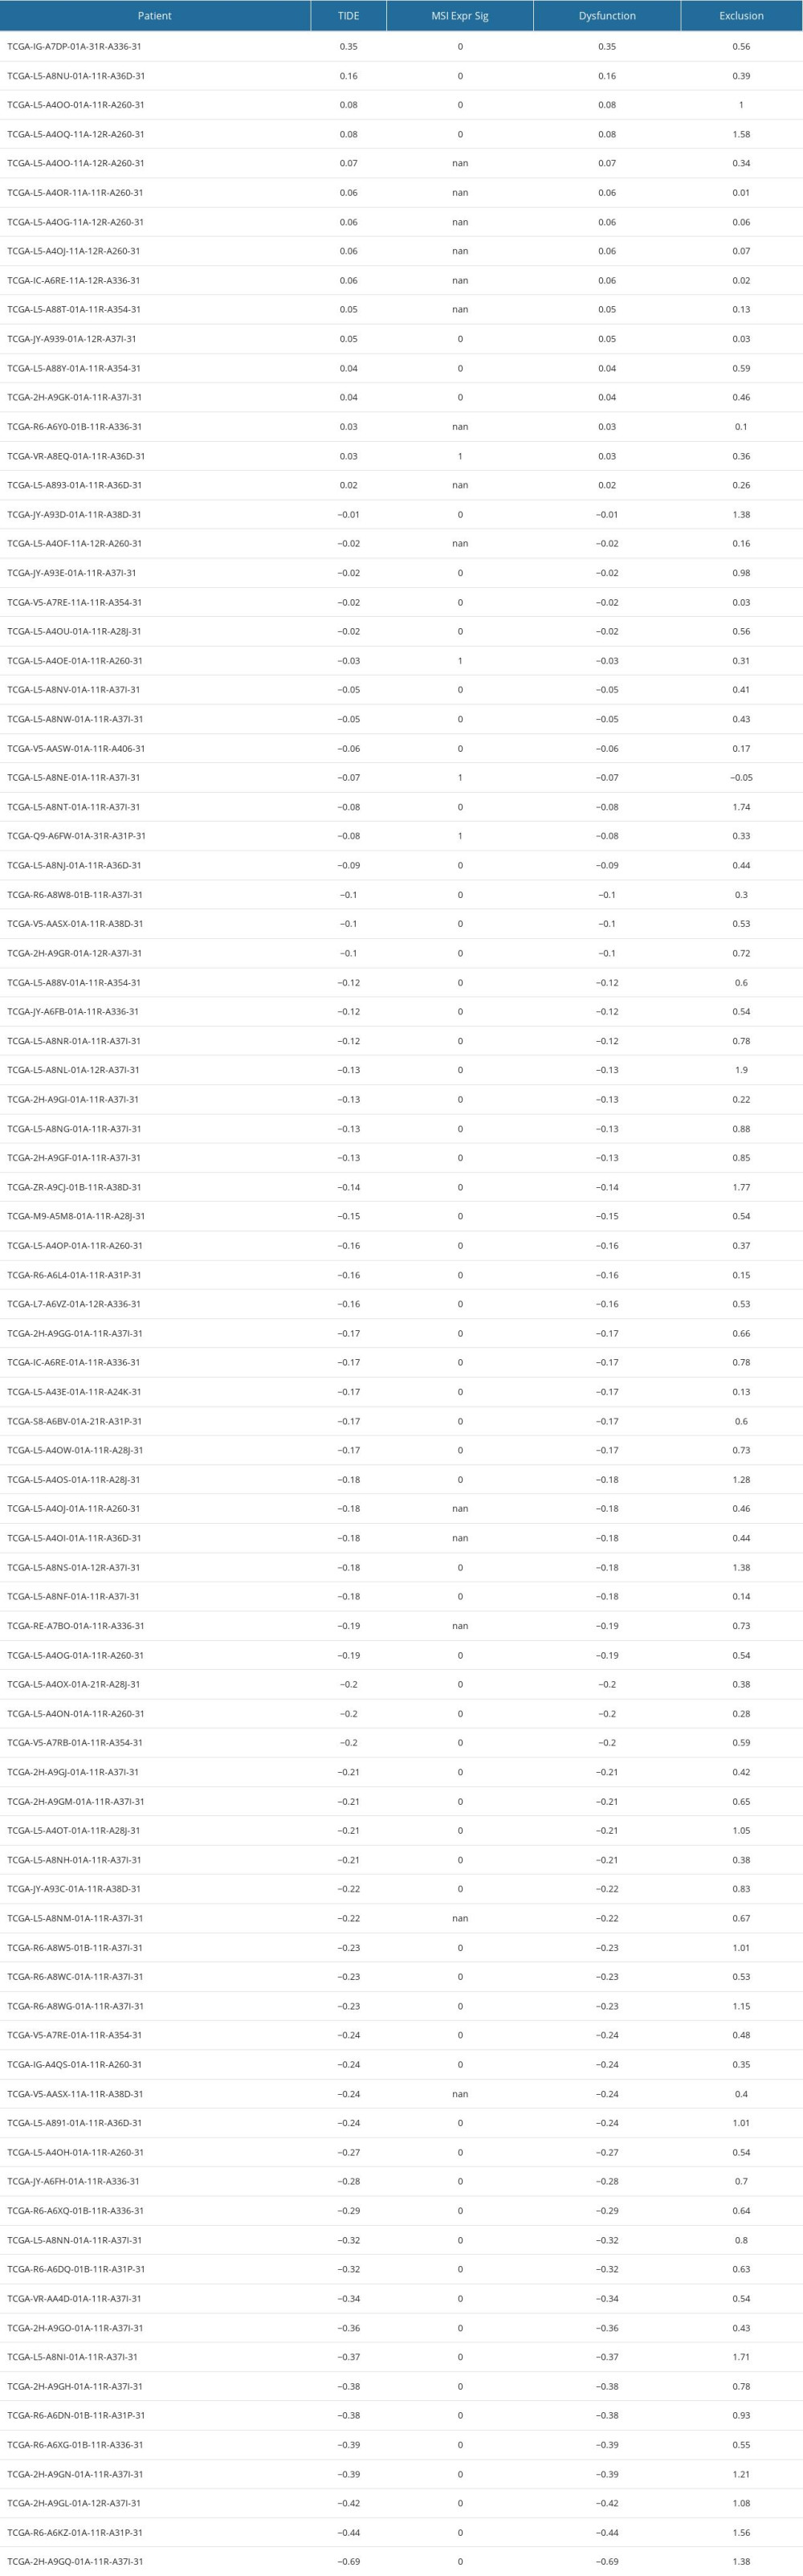 Supplementary Table 5. 4 immune-related gene signatures (IRGS).
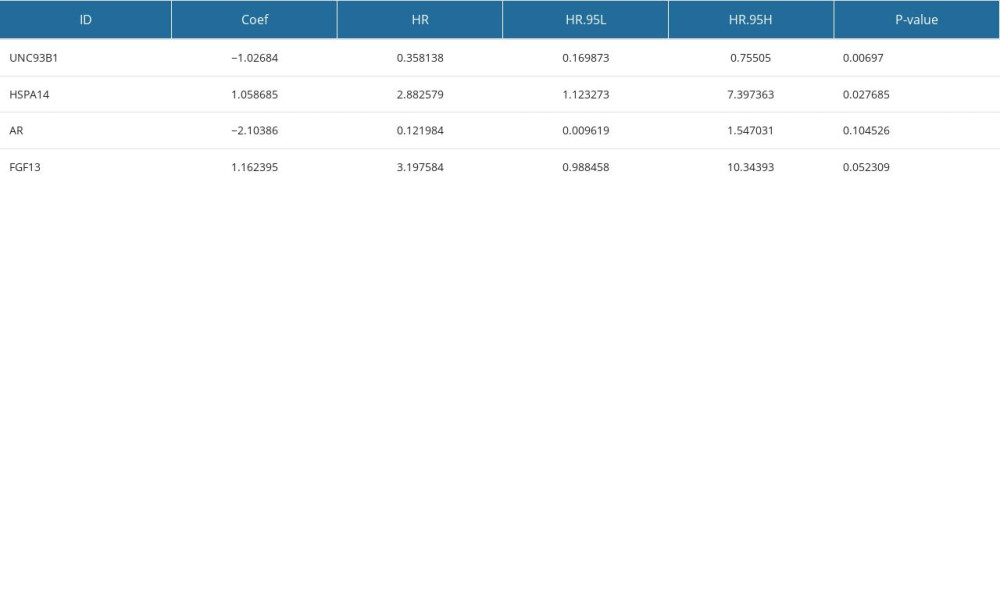 Supplementary Table 6. The overall, TP53 and MUC16 mutation rates in the low-risk and high-risk groups.
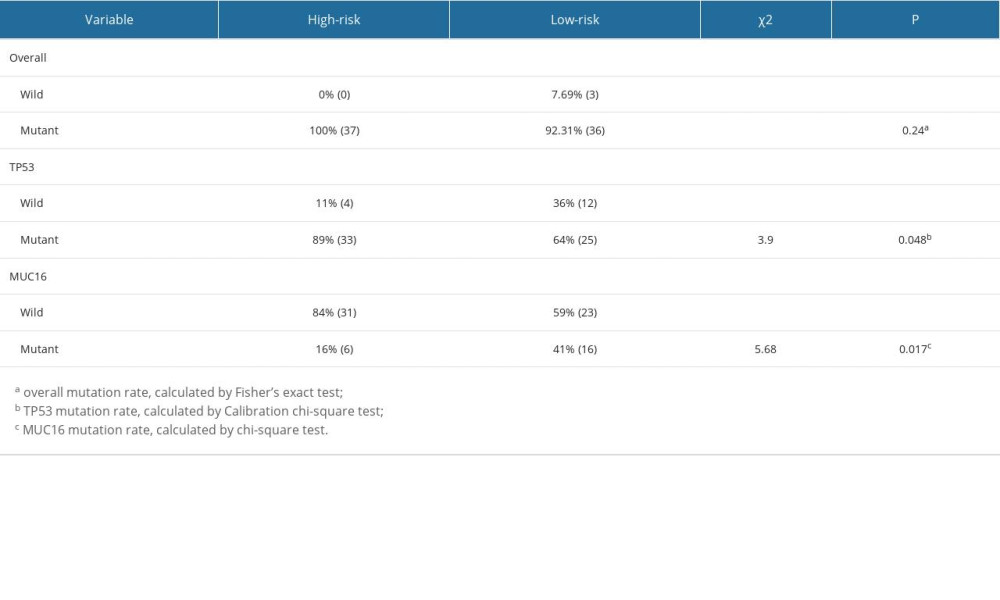
References
1. Sung H, Ferlay J, Siegel RL, Global Cancer Statistics 2020: GLOBOCAN estimates of incidence and mortality worldwide for 36 cancers in 185 countries: Cancer J Clin, 2021; 71(3); 209-49
2. Arnold M, Laversanne M, Brown LM, Predicting the future burden of esophageal cancer by histological subtype: International trends in incidence up to 2030: Am J Gastroenterol, 2017; 112(8); 1247-55
3. Coleman HG, Xie SH, Lagergren J, The epidemiology of esophageal adenocarcinoma: Gastroenterology, 2018; 154(2); 390-405
4. Pimentel-Nunes P, Libânio D, Bastiaansen BAJ, Endoscopic submucosal dissection for superficial gastrointestinal lesions: European Society of Gastrointestinal Endoscopy (ESGE) guideline – update 2022: Endoscopy, 2022; 54(6); 591-622
5. Ajani JA, D’Amico TA, Almhanna K, Esophageal and esophagogastric junction cancers, version 1.2015: J Natl Compr Canc Netw, 2015; 13(2); 194-227
6. Shapiro J, van Lanschot JJB, Hulshof MCCM, Neoadjuvant chemoradiotherapy plus surgery versus surgery alone for oesophageal or junctional cancer (CROSS): Long-term results of a randomised controlled trial: Lancet Oncol, 2015; 16(9); 1090-98
7. Le DT, Durham JN, Smith KN, Mismatch repair deficiency predicts response of solid tumors to PD-1 blockade: Science, 2017; 357(6349); 409-13
8. Diesendruck Y, Benhar I, Novel immune check point inhibiting antibodies in cancer therapy-Opportunities and challenges: Drug Resist Updat, 2017; 30; 39-47
9. Merlano MC, Denaro N, Garrone O, Immune escape mechanisms in head and neck squamous cell carcinoma and implication for new immunotherapy approach: Curr Opin Oncol, 2020; 32(3); 203-9
10. Baba Y, Nomoto D, Okadome K, Tumor immune microenvironment and immune checkpoint inhibitors in esophageal squamous cell carcinoma: Cancer Sci, 2020; 111(9); 3132-41
11. Blank CU, Haanen JB, Ribas A, Schumacher TN, Cancer immunology. The “cancer immunogram”: Science, 2016; 352(6286); 658-60
12. Pérez-Romero K, Rodríguez RM, Amedei A, Immune landscape in tumor microenvironment: Implications for biomarker development and immunotherapy: Int J Mol Sci, 2020; 21(15); 5521
13. Prat A, Pineda E, Adamo B, Clinical implications of the intrinsic molecular subtypes of breast cancer: Breast, 2015; 24(Suppl 2); S26-S35
14. Nowicki-Osuch K, Zhuang L, Jammula S, Molecular phenotyping reveals the identity of Barrett’s esophagus and its malignant transition: Science, 2021; 373(6556); 760-67
15. Blum A, Wang P, Zenklusen JC, SnapShot: TCGA-analyzed tumors: Cell, 2018; 173(2); 530
16. Sun S, Guo W, Wang Z, Development and validation of an immune-related prognostic signature in lung adenocarcinoma: Cancer Med, 2020; 9(16); 5960-75
17. Wang J, Yu S, Chen G, A novel prognostic signature of immune-related genes for patients with colorectal cancer: J Cell Mol Med, 2020; 24(15); 8491-504
18. Chen W, Ou M, Tang D, Identification and validation of immune-related gene prognostic signature for hepatocellular carcinoma: J Immunol Res, 2020; 2020; 5494858
19. Zheng L, Li L, Xie J, Six novel biomarkers for diagnosis and prognosis of esophageal squamous cell carcinoma: Validated by scRNA-seq and qPCR: J Cancer, 2021; 12(3); 899-911
20. Hu FF, Liu CJ, Liu LL, Expression profile of immune checkpoint genes and their roles in predicting immunotherapy response: Brief Bioinform, 2021; 22(3); bbaa176
21. Jiang P, Gu S, Pan D, Signatures of T cell dysfunction and exclusion predict cancer immunotherapy response: Nat Med, 2018; 24(10); 1550-58
22. Humphries MP, Craig SG, Kacprzyk R, The adaptive immune and immune checkpoint landscape of neoadjuvant treated esophageal adenocarcinoma using digital pathology quantitation: BMC Cancer, 2020; 20(1); 500
23. Thommen DS, Schumacher TN, T Cell dysfunction in cancer: Cancer Cell, 2018; 33(4); 547-62
24. Wagener-Ryczek S, Schoemmel M, Kraemer M, Immune profile and immunosurveillance in treatment-naive and neoadjuvantly treated esophageal adenocarcinoma: Cancer Immunol Immunother, 2020; 69(4); 523-33
25. Kashuba VI, Protopopov AI, Kvasha SM, hUNC93B1: A novel human gene representing a new gene family and encoding an unc-93-like protein: Gene, 2002; 283(1–2); 209-17
26. Krock E, Rosenzweig DH, Currie JB, Toll-like receptor activation induces degeneration of human intervertebral discs: Sci Rep, 2017; 7(1); 17184
27. Wagai S, Kasamatsu A, Iyoda M, UNC93B1 promotes tumoral growth by controlling the secretion level of granulocyte macrophage colony-stimulating factor in human oral cancer: Biochem Biophys Res Commun, 2019; 513(1); 81-87
28. Jung ID, Shin SJ, Lee MG, Enhancement of tumor-specific T cell-mediated immunity in dendritic cell-based vaccines by Mycobacterium tuberculosis heat shock protein X: J Immunol, 2014; 193(3); 1233-45
29. Valentinis B, Capobianco A, Esposito F, Human recombinant heat shock protein 70 affects the maturation pathways of dendritic cells in vitro and has an in vivo adjuvant activity: J Leukoc Biol Jul, 2008; 84(1); 199-206
30. Yang Z, Zhuang L, Szatmary P, Upregulation of heat shock proteins (HSPA12A, HSP90B1, HSPA4, HSPA5 and HSPA6) in tumour tissues is associated with poor outcomes from HBV-related early-stage hepatocellular carcinoma: Int J Med Sci, 2015; 12(3); 256-63
31. Wang B, Lan T, Xiao H, The expression profiles and prognostic values of HSP70s in hepatocellular carcinoma: Cancer Cell Int, 2021; 21(1); 286
32. Niţă I, Niţipir C, Toma ŞA, The importance of androgen receptors in breast cancer: Med Pharm Rep, 2021; 94(3); 273-81
33. Cheng WC, Wang HJ, Current advances of targeting epigenetic modifications in neuroendocrine prostate cancer: Tzu Chi Med J, 2021; 33(3); 224-32
34. Chung WM, Chen L, Chang WC, Androgen/androgen receptor signaling in ovarian cancer: Molecular regulation and therapeutic potentials: Int J Mol Sci, 2021; 22(14); 7748
35. Tihan T, Harmon JW, Wan X, Evidence of androgen receptor expression in squamous and adenocarcinoma of the esophagus: Anticancer Res, 2001; 21(4B); 3107-14
36. Smith E, Palethorpe HM, Ruszkiewicz AR, Androgen receptor and androgen-responsive gene FKBP5 are independent prognostic indicators for esophageal adenocarcinoma: Dig Dis Sci, 2016; 61(2); 433-43
37. Palethorpe HM, Drew PA, Smith E, Androgen signaling in esophageal adenocarcinoma cell lines in vitro: Dig Dis Sci, 2017; 62(12); 3402-14
38. Song JJ, Li W, MiR-10b suppresses the growth and metastasis of colorectal cancer cell by targeting FGF13: Eur Rev Med Pharmacol Sci, 2019; 23(2); 576-87
39. Johnstone CN, Pattison AD, Harrison PF, FGF13 promotes metastasis of triple-negative breast cancer: Int J Cancer, 2020; 147(1); 230-43
40. Bublik DR, Bursać S, Sheffer M, Regulatory module involving FGF13, miR-504, and p53 regulates ribosomal biogenesis and supports cancer cell survival: Proc Natl Acad Sci USA, 2017; 114(4); E496-E505
41. Missiaglia E, Dalai I, Barbi S, Pancreatic endocrine tumors: Expression profiling evidences a role for AKT-mTOR pathway: J Clin Oncol, 2010; 28(2); 245-55
42. Ren H, Liu X, Li F, Identification of a six gene prognosis signature for papillary thyroid cancer using multi-omics methods and bioinformatics analysis: Front Oncol, 2021; 11; 624421
43. Liu T, Wu H, Qi J, Seven immune-related genes prognostic power and correlation with tumor-infiltrating immune cells in hepatocellular carcinoma: Cancer Med, 2020; 9(20); 7440-52
44. Barclay C, Li AW, Geldenhuys L, Basic fibroblast growth factor (FGF-2) overexpression is a risk factor for esophageal cancer recurrence and reduced survival, which is ameliorated by coexpression of the FGF-2 antisense gene: Clin Cancer Res, 2005; 11(21); 7683-91
45. Barclay C, Li AW, Geldenhuys L, Basic fibroblast growth factor (FGF-2) overexpression is a risk factor for esophageal cancer recurrence and reduced survival, which is ameliorated by coexpression of the FGF-2 antisense gene: Clin Cancer Res, 2005; 11(21); 7683-91
46. Baguma-Nibasheka M, Barclay C, Li AW, Selective cyclooxygenase-2 inhibition suppresses basic fibroblast growth factor expression in human esophageal adenocarcinoma: Mol Carcinog, 2007; 46(12); 971-80
47. Fisher OM, Lord SJ, Falkenback D, The prognostic value of TP53 mutations in oesophageal adenocarcinoma: a systematic review and meta-analysis: Gut, 2017; 66(3); 399-410
48. Zeng Z, Li J, Zhang J, Immune and stromal scoring system associated with tumor microenvironment and prognosis: A gene-based multi-cancer analysis: J Transl Med, 2021; 19(1); 330
49. Varricchi G, Galdiero MR, Loffredo S, Are mast cells MASTers in cancer?: Front Immunol, 2017; 8; 424
50. Lv YP, Peng LS, Wang QH, Degranulation of mast cells induced by gastric cancer-derived adrenomedullin prompts gastric cancer progression: Cell Death Dis, 2018; 9(10); 1034
51. Komi DEA, Redegeld FA, Role of mast cells in shaping the tumor microenvironment: Clin Rev Allergy Immunol, 2020; 58(3); 313-25
52. Jia X, Yan B, Tian X, CD47/SIRPα pathway mediates cancer immune escape and immunotherapy: Int J Biol Sci, 2021; 17(13); 3281-87
53. Arrieta O, Aviles-Salas A, Orozco-Morales M, Association between CD47 expression, clinical characteristics and prognosis in patients with advanced non-small cell lung cancer: Cancer Med, 2020; 9(7); 2390-402
54. Shi M, Gu Y, Jin K, CD47 expression in gastric cancer clinical correlates and association with macrophage infiltration: Cancer Immunol Immunother, 2021; 70(7); 1831-40
55. Majeti R, Chao MP, Alizadeh AA, CD47 is an adverse prognostic factor and therapeutic antibody target on human acute myeloid leukemia stem cells: Cell, 2009; 138(2); 286-99
56. Suzuki S, Yokobori T, Tanaka N, CD47 expression regulated by the miR-133a tumor suppressor is a novel prognostic marker in esophageal squamous cell carcinoma: Oncol Rep, 2012; 28(2); 465-72
57. Tao H, Qian P, Wang F, Targeting CD47 enhances the efficacy of anti-PD-1 and CTLA-4 in an esophageal squamous cell cancer preclinical model: Oncol Res, 2017; 25(9); 1579-87
58. Yoshida K, Tsujimoto H, Matsumura K, CD47 is an adverse prognostic factor and a therapeutic target in gastric cancer: Cancer Med, 2015; 4(9); 1322-33
59. Vathiotis IA, MacNeil T, Zugazagoitia J, Quantitative assessment of CD200 and CD200R expression in lung cancer: Cancers (Basel), 2021; 13(5); 1024
60. Siva A, Xin H, Qin F, Immune modulation by melanoma and ovarian tumor cells through expression of the immunosuppressive molecule CD200: Cancer Immunol Immunother, 2008; 57(7); 987-96
61. Herbrich S, Baran N, Cai T, Overexpression of CD200 is a stem cell-specific mechanism of immune evasion in AML [published correction appears in J Immunother Cancer. 2021;9(11):e002968corr1]: J Immunother Cancer, 2021; 9(7); e002968
62. Wright GJ, Cherwinski H, Foster-Cuevas M, Characterization of the CD200 receptor family in mice and humans and their interactions with CD200: J Immunol, 2003; 171(6); 3034-46
63. Talebian F, Liu JQ, Liu Z, Melanoma cell expression of CD200 inhibits tumor formation and lung metastasis via inhibition of myeloid cell functions: PLoS One, 2012; 7(2); e31442
64. Yang R, Sun L, Li CF, Galectin-9 interacts with PD-1 and TIM-3 to regulate T cell death and is a target for cancer immunotherapy: Nat Commun, 2021; 12(1); 832
65. Dai SY, Nakagawa R, Itoh A, Galectin-9 induces maturation of human monocyte-derived dendritic cells: J Immunol, 2005; 175(5); 2974-81
66. Liang T, Wang X, Wang F, Galectin-9: A predictive biomarker negatively regulating immune response in glioma patients: World Neurosurg, 2019; 132; e455-e62
67. Borggrewe M, Grit C, Den Dunnen WFA, VISTA expression by microglia decreases during inflammation and is differentially regulated in CNS diseases: Glia, 2018; 66(12); 2645-58
68. Huang X, Zhang X, Li E, VISTA: An immune regulatory protein checking tumor and immune cells in cancer immunotherapy: J Hematol Oncol, 2020; 13(1); 83
69. Liu Y, Zhang J, Wang Z, Identify the prognostic and immune profile of VSIR in the tumor microenvironment: A pan-cancer analysis: Front Cell Dev Biol, 2022; 10; 821649
70. Chen LJ, Sun J, Wu HY, B7–H4 expression associates with cancer progression and predicts patient’s survival in human esophageal squamous cell carcinoma: Cancer Immunol Immunother, 2011; 60(7); 1047-55
71. Chen X, Wang L, Wang W, B7–H4 facilitates proliferation of esophageal squamous cell carcinoma cells through promoting interleukin-6/signal transducer and activator of transcription 3 pathway activation: Cancer Sci, 2016; 107(7); 944-54
72. Xin H, Liu Y, Chen P, CD155 promotes radioresistance and malignancy of esophageal cancer by regulating Hippo-YAP pathway: Discov Oncol, 2022; 13(1); 53
73. Tang X, Yang J, Shi A, CD155 Cooperates with PD-1/PD-L1 to promote proliferation of esophageal squamous cancer cells via PI3K/Akt and MAPK signaling pathways: Cancers (Basel), 2022; 14(22); 5610
74. Thommen DS, Schumacher TN, T Cell dysfunction in cancer: Cancer Cell, 2018; 33(4); 547-62
75. Wherry EJ, T cell exhaustion: Nat Immunol, 2011; 12(6); 492-99
76. Wherry EJ, Ha SJ, Kaech SM, Molecular signature of CD8+ T cell exhaustion during chronic viral infection [published correction appears in Immunity. 2007 Nov;27(5):824]: Immunity, 2007; 27(4); 670-684
77. Ahmadzadeh M, Johnson LA, Heemskerk B, Tumor antigen-specific CD8 T cells infiltrating the tumor express high levels of PD-1 and are functionally impaired: Blood, 2009; 114(8); 1537-44
78. Fourcade J, Sun Z, Benallaoua M, Upregulation of Tim-3 and PD-1 expression is associated with tumor antigen-specific CD8+ T cell dysfunction in melanoma patients: J Exp Med, 2010; 207(10); 2175-86
79. Wherry EJ, T cell exhaustion: Nat Immunol, 2011; 12(6); 492-99
80. Jiang P, Gu S, Pan D, Signatures of T cell dysfunction and exclusion predict cancer immunotherapy response: Nat Med, 2018; 24(10); 1550-58
81. Danaher P, Warren S, Lu R, Pan-cancer adaptive immune resistance as defined by the Tumor Inflammation Signature (TIS): Results from The Cancer Genome Atlas (TCGA): J Immunother Cancer, 2018; 6(1); 63
82. Zhang X, Yang L, Kong M, Development of a prognostic signature of patients with esophagus adenocarcinoma by using immune-related genes: BMC Bioinformatics, 2021; 22(1); 536
Figures
Figure 1. Identification of IRDEGs in EAC. (A) The heatmap shows all DEGs between 78 EAC samples (red) and 9 normal samples (blue) (P<0.05, |log2FC| >1). (B) The heatmap shows 394 IRDEGs. (C) WGCNA of immune-related DEGs. (D) Gene modules related to EAC obtained by WGCNA. EAC – esophageal adenocarcinoma; DEGs – differentially-expressed genes; WGCNA – weighted gene co-expression network analysis; IRDEGs – immune-related differentially-expressed genes.Figure 2. GO and KEGG analysis of the 111 IRDEGs. (A) GO enrichment analysis of the IRDEGs (P<0.05). (B) KEGG pathway analysis of the IRDEGs (P<0.05). IRDEGs – immune-related differentially-expressed genes; GO – gene ontology; KEGG – Kyoto Encyclopedia of Genes and Genomes.Figure 3. Results of the univariate and multivariate Cox regression analyses of the prognostic factors in EAC patients. (A) Univariate Cox analysis of the 12 immune-related prognostic genes. (B) Multivariate Cox analysis of the 4 gene prognostic indexes. (C) Univariate and (D) multivariate regression analyses demonstrated risk score as an independent factor affecting the prognosis in EAC patients. EAC – esophageal adenocarcinomaFigure 4. The Kaplan-Meier curve and prognostic hazard curves. Kaplan-Meier survival curves designate the overall survival among the high- and low-risk groups in TCGA (A) and GSE13898 (E). The risk scores of different groups in TCGA (B) and GSE13898 (F). The heatmaps of the expression profiles of the 4 immune-related genes in TCGA (C) and GSE13898 (G). The survival time and status of each patient in TCGA (D) and GSE13898 (H).Figure 5. Gene set enrichment analysis and gene mutation analysis of the 2 risk groups. (A) The Kyoto Encyclopedia of Genes and Genomes enrichment results (top 5) in the low- and (B) high-risk groups (P<0.05). (C) The top 10 significantly mutated genes in the mutated EAC samples of the low- and (D) high-risk groups. (E) The difference in TMB in the 2 risk groups (ns – not significant). (F) Correlation analysis between the risk score and TMB. EAC – esophageal adenocarcinoma; TMB – tumor mutation burden.Figure 6. The clinical characteristics and immune cell infiltration in different risk groups. (A) Basic clinicopathological characteristics of the 2 groups. (B) The proportions of TME cells for EAC patients in low- and high-risk groups.Figure 7. The difference in immune cell infiltration and immune functions between the 2 risk groups. (A) The fraction of 22 immune cells in the high- and low-risk groups (* P<0.05, ** P<0.01, *** P<0.001). (B) The score of immune cells-related functions in the high- and low-risk groups (* P<0.05, ** P<0.01, *** P<0.001).Figure 8. (A–F) mRNA expression of the 6 immune checkpoint genes (CD47, CD200R1, LGALS9, PVR, VSIR and VTCN1) in the high- and low-risk groups (P<0.05 was considered statistically significant).Figure 9. The evaluation of the efficacy of immunotherapy in different risk groups. (A–D) The results of TIDE, microsatellite instability, and T cell exclusion and dysfunction score in different risk groups (ns: not significant, * P<0.05, ** P<0.01, *** P<0.001). (E) Time-dependent ROC curve for 1-year, 2-year and 3-year predictions (our risk model). (F) ROC analysis of the risk model, TIDE and TIS on overall survival. TIDE – tumor immune dysfunction and exclusion; ROC – receiver operating characteristic; TIS – tumor inflammation signature. Tables
Supplementary Table 1. Clinical information of 87 EAC cases in TCGA.Supplementary Table 2. 394 IRDEGs.Supplementary Table 3. 111 IRDEGs in MEblue module.Supplementary Table 4. The results of TIDE, dysfunction and exclusion scores.Supplementary Table 5. 4 immune-related gene signatures (IRGS).Supplementary Table 6. The overall, TP53 and MUC16 mutation rates in the low-risk and high-risk groups. In Press
Clinical Research
Body Weight and Insulin Resistance Indicators Among ChildrenMed Sci Monit In Press; DOI: 10.12659/MSM.951434
Clinical Research
Comparison of Radiographic Cervical Sagittal Alignment Parameters in Patients With Nonspecific Neck Pain, D...Med Sci Monit In Press; DOI: 10.12659/MSM.952950
Clinical Research
Combined Fibrinogen and Urinary α1-Microglobulin as Predictors of Respiratory Tract Infection in Children w...Med Sci Monit In Press; DOI: 10.12659/MSM.951066
Database Analysis
Evaluation of Salivary Total Oxidant Status (TOS) and Total Antioxidant Status (TAS) in Orthodontic Patient...Med Sci Monit In Press; DOI: 10.12659/MSM.952052
Most Viewed Current Articles
17 Jan 2024 : Review article 14,175,576
Vaccination Guidelines for Pregnant Women: Addressing COVID-19 and the Omicron VariantDOI :10.12659/MSM.942799
Med Sci Monit 2024; 30:e942799
13 Nov 2021 : Clinical Research 3,756,620
Acceptance of COVID-19 Vaccination and Its Associated Factors Among Cancer Patients Attending the Oncology ...DOI :10.12659/MSM.932788
Med Sci Monit 2021; 27:e932788
14 Dec 2022 : Clinical Research 2,465,966
Prevalence and Variability of Allergen-Specific Immunoglobulin E in Patients with Elevated Tryptase LevelsDOI :10.12659/MSM.937990
Med Sci Monit 2022; 28:e937990
16 May 2023 : Clinical Research 708,651
Electrophysiological Testing for an Auditory Processing Disorder and Reading Performance in 54 School Stude...DOI :10.12659/MSM.940387
Med Sci Monit 2023; 29:e940387