10 July 2025: Clinical Research
Quantitative Multi-Parameter MRI Evaluation of Hashimoto’s Thyroiditis Changes After Dietary Interventions
Ning Dai DOI: 10.12659/MSM.947862
Med Sci Monit 2025; 31:e947862


Abstract
BACKGROUND: Hashimoto’s thyroiditis is a common autoimmune disease. There are currently few studies utilizing multi-parametric magnetic resonance imaging (MRI) to investigate diffuse thyroid lesions such as Hashimoto’s thyroiditis. This study aims to explore the value of multi-parametric MRI in assessing the progression of Hashimoto’s thyroiditis.
MATERIAL AND METHODS: The study ultimately included 40 patients with Hashimoto’s thyroiditis, who were randomly and evenly assigned to an intervention group and a control group. The intervention group received dietary management, while the control group received no intervention. Laboratory and imaging tests were conducted at baseline and 6 months later.
RESULTS: After dietary management, patients with Hashimoto’s thyroiditis showed a significant reduction in thyroid T2-weighted imaging relative signal intensity (T2WI RSI) (mean: 1.69±0.35 vs 1.42±0.24, P<0.05) and water fraction (mean: 94.57±1.76 vs 93.36±1.62, P<0.001). Additionally, thyroid peroxidase antibody (TPOAb) and thyroglobulin antibody (TGAb) levels decreased significantly (TPOAb: 376.58±319.52 vs 273.55±287.63, P<0.05; TGAb: 219.06±572.54 vs 198.80±567.59, P<0.05). In contrast, no significant changes in thyroid water fraction, TPOAb, or TGAb levels were observed in the control group (P>0.05).
CONCLUSIONS: In conclusion, multi-parametric MRI offers a valuable quantitative tool for assessing Hashimoto’s thyroiditis, providing an intuitive and sensitive method to improve disease understanding and management.
Keywords: Evaluation study, Multiparametric Magnetic Resonance Imaging, Thyroiditis, Autoimmune, Radiotherapy, Autoimmune Diseases, Humans, Hashimoto disease, Magnetic Resonance Imaging, Female, Male, adult, Middle Aged, Thyroid Gland, Autoantibodies, Thyroglobulin
Introduction
Hashimoto’s thyroiditis, also known as chronic lymphocytic thyroiditis, is a common autoimmune disease and the leading cause of hypothyroidism. It is characterized by thyroid enlargement, lymphocytic infiltration, and thyroid-specific antibodies [1]. The precise mechanisms that trigger autoimmunity remain under investigation. Epidemiological data suggest that a combination of genetic susceptibility and environmental factors plays a critical role in the breakdown of immune tolerance and the onset of the disease. Identified environmental risk factors include radiation, iodine, selenium, smoking, infections, stress, and certain medications [2]. Hashimoto’s thyroiditis typically has a slow, insidious onset with non-specific early symptoms. As thyroid damage progresses, hypothyroidism develops. Elevated thyroglobulin antibody (TGAb) and thyroid peroxidase antibody (TPOAb) levels are key markers of Hashimoto’s thyroiditis, which often precede hypothyroidism. A firm, diffusely enlarged goiter with isthmus or conus involvement may suggest Hashimoto’s thyroiditis, with diagnosis further supported by elevated antibodies and fine-needle aspiration cytology [3].
Ultrasonography, typically performed following serological tests, is the preferred method for detecting thyroid lesions. If necessary, radionuclide scanning can be used as a supplementary diagnostic tool. However, ultrasonography diagnosis may vary due to the skill and experience of the examiner, the choice of probe, and the similarity between thyroid abnormalities and adjacent structures. Despite advancements in ultrasonography technology, this diagnostic instability persists, and the subjective nature of ultrasonography cannot be overlooked. Additionally, ultrasonography lacks sensitive quantitative measurement techniques, making it challenging to accurately assess the progression of Hashimoto’s thyroiditis [4].
Although the diagnosis and evaluation of Hashimoto’s thyroiditis largely depend on serological tests, including assessments of thyroid function and autoantibodies, and ultrasonography, these methods are limited in their ability to accurately track disease progression compared with in vivo tissue alterations. There remains an unmet need for a tool capable of providing sensitive and visual assessments of both structural and inflammatory changes in the thyroid. Studies have reported that magnetic resonance imaging (MRI) can distinguish signal intensity changes in normal thyroid parenchyma from diffuse thyroid lesions [5]. The Dixon method, introduced by Dixon in 1984, is a water-fat separation imaging technique based on assessment of chemical shift differences. It produces water-only and fat-only images by calculating the phase shift caused by the resonance frequency difference between fat and water. While this method is widely used in abdominal and limb imaging, its application in soft-tissue imaging of the neck remains relatively rare. Diffusion-weighted imaging (DWI) is a functional MRI technique with broad applications. It uses the diffusion of water molecules within tissues to perform quantitative lesion analysis, with its primary quantitative metric being the apparent diffusion coefficient (ADC). ADC can be quantitatively calculated by performing the sequence under different intensities of diffusion gradient magnetic field, largely influenced by the presence of diffusion barriers within the water microenvironment [6–8]. Some researchers have reported promising results. For instance, Zhu et al [9] studied the application of DWI in differentiating between benign and malignant thyroid nodules, while Liu et al [10] explored the application of DWI in differentiating benign from malignant thyroid nodules, and demonstrated that quantitative T1-mapping using 3.0 T MRI is effective in diagnosing autoimmune thyroiditis. Such tools can detect subtle microscopic changes in vivo, providing information that can help to tailor treatment. In addition, nuclear medicine is useful in the diagnosis of thyroid disorders. The study by Fischer et al showed that combining visual with semi-quantitative MIBI uptake assessment significantly improved the classification accuracy of amiodarone-induced thyrotoxicosis, particularly in distinguishing the mixed type [11].
This study focused on evaluating the utility of multi-parametric MRI in assessing the progression of Hashimoto’s thyroiditis, with the aim of providing intuitive, sensitive, and accurate imaging tools for clinical evaluation of this disease.
Material and Methods
ETHICS STATEMENT:
All participants in this study gave their written, signed informed consent. The study protocol was approved by the Ethics Review Committee of the Second Affiliated Hospital of Zhejiang Chinese Medical University (approval number 202400601).
STUDY DESIGN AND PARTICIPANTS:
The study collected and analyzed the imaging and clinical data of 40 patients who underwent thyroid MRI examinations in the radiology department of the hospital where the author is affiliated from March 10, 2024 to September 15, 2024. Forty patients were equally randomized into intervention and control groups. Inclusion criteria were patients meeting the diagnostic criteria for Hashimoto’s thyroiditis, voluntarily undergoing thyroid MRI examination, and age 18–65 years. Exclusion criteria were patients with MRI images of poor quality due to artifacts, a history of acute or chronic infectious diseases, other autoimmune diseases, trauma or surgery of the thyroid gland, claustrophobia, metal implants in the neck, severe cardiovascular or cerebrovascular diseases, tumors, significant organ insufficiency, or individuals who were pregnant or lactating.
Referring to the consensus research report of the National Academies Press in Washington, D.C. [12], and the study by Osowiecka et al [13], we developed 3 dietary management programs for patients in the intervention group. The first program was a gluten-free diet, which involved avoiding gluten-containing grains and supplementing with 100 μg of vitamin D per day. The second program was a low-calorie diet with a nutrient composition of 25% protein, 30% fat, and 45% carbohydrates, designed to meet daily micronutrient and macronutrient needs. Depending on the individual’s resting metabolic rate and energy expenditure, this diet provided 1400–1600 kcal per day, resulting in a calorie deficit of approximately 1000 kcal per day, and included supplementation with 200 μg of 1-selenomethionine and 30 μg of zinc gluconate. The third program was a low-carbohydrate diet with 50–60% protein, 25–30% fat, and 12–15% carbohydrates, emphasizing increased consumption of leafy green vegetables and lean meats while limiting eggs, dairy products, legumes, fruits, bread, pasta, thyroid hormone-containing foods, and rice. Participants in the intervention group were allowed to choose and adhere to one of these dietary programs, and all were evaluated at a follow-up visit after 6 months. Eventually, 5 patients adhered to a gluten-free regimen, 8 were maintained on calorie-restricted protocols, and 7 followed carbohydrate-controlled nutritional plans. In contrast, patients in the control group did not undergo dietary management.
The diagnosis of Hashimoto’s thyroiditis is established based on the following criteria: (1) markedly elevated serum levels of thyroid peroxidase antibody (TPOAb) and/or thyroglobulin antibody (TGAb); (2) characteristic thyroid ultrasound findings demonstrating diffuse heterogeneous changes with thyroid enlargement, heterogeneous echogenicity, and frequently accompanied by multiple hypoechoic areas or thyroid nodules; (3) thyroid dysfunction may or may not be present (not required as an essential diagnostic criterion).
The diagnostic criteria for abnormal thyroid antibodies were defined as TPOAb levels greater than 16.83 IU/mL and TGAb levels greater than 12.33 IU/mL, both of which are 3 times higher than the upper limit of the reference range. All participants underwent testing for thyroid function indicators free triiodothyronine (FT3), free thyroxine (FT4), thyroid-stimulating hormone (TSH), and thyroid autoantibodies TPOAb and TGAb prior to the examination. The reference ranges for thyroid function indices are: FT3: 2.76–6.45 pmol/L; FT4: 11.20–23.81 pmol/L; and TSH: 0.35–5.10 mIU/L. Body mass index (BMI) was calculated using the following formula:
MRI MACHINE SPECIFICATIONS:
This study employed multi-parametric magnetic resonance imaging (MRI) sequences, including T1WI, T2WI, Dixon, and DWI, with post-processing of Dixon and DWI generating in-phase, out-of-phase, water-only, fat-only, and ADC maps.
MRI scans were performed using the SIEMENS MAGNETOM Avanto 1.5 T MRI system. Patients were positioned supine with the scanning center at the 5th cervical vertebra. The transverse scanning parameters were: (1) T1-weighted imaging (T1WI): TR/TE: 524 ms/11 ms; field of view (FOV): 220 mm; slice thickness: 4 mm; inter-slice gap: 1.2 mm; number of slices: 20; number of excitations: 2. (2) T2-weighted imaging (T2WI) Dixon: TR/TE: 2410 ms/75 ms; FOV: 220 mm; slice thickness: 4 mm; inter-slice gap: 1.2 mm; number of slices: 20; number of excitations: 2. After conventional MRI scanning, DWI was obtained in axial plane by single-shot spin-echo echo-planar imaging on
MRI ANALYSIS:
MRI parameter measurements were conducted by 2 experienced radiologists on 2 separate occasions, with at least a 2-week interval between each measurement. The radiologists were blinded to the study design and the clinical information of the subjects. The transverse diameter, anteroposterior diameter, and isthmus thickness of the largest cross-sections of the right and left thyroid lobes were measured on T1WI and T2WI serial images. The sizes of the right and left lobes were expressed as the product of the transverse and anteroposterior diameters in mm2, and the isthmus thickness was recorded in mm. The regions of interest (ROIs) were delineated with irregular lines on the axial T1WI, T2WI, water-only, fat-only, and ADC images to measure signal intensity. To ensure that the ROIs were kept approximately 2 mm smaller than the thyroid gland edge, signal intensity of the sternocleidomastoid muscle at the same level was measured using a circular ROI. Since the signal intensities of T1WI and T2WI cannot be directly compared between different time points for the same examiner or between different examiners, the ratio of the signal intensities of the thyroid gland to the sternocleidomastoid at the corresponding level was used as an indicator of signal intensity, T1-weighted imaging relative signal intensity (T1WI RSI) and T2-weighted imaging relative signal intensity (T2WI RSI). This method effectively minimizes signal intensity differences caused by scanning conditions and individual variations, thus improving the consistency and reliability of the imaging data. Thyroid water-only and fat-only images were obtained by processing the Dixon sequence using a Siemens post-processing system. At the same anatomical level, the water fraction and fat fraction of the thyroid were measured by outlining ROIs and expressed as percentages. Signal intensity ratio calculation formulas:
STATISTICAL ANALYSIS:
Statistical calculations were performed using SPSS 26.0 (SPSS, Inc., Chicago, Illinois, USA) on a PC. The Shapiro-Wilk test was used to assess the normality of measurement data. Data were expressed as mean±standard deviation. An independent samples
Some laboratory test parameters exceeded the measurable range, resulting in over-limit values. Given the skewed data distribution, we opted for non-parametric rank-sum tests for baseline and intra-individual comparisons. Unlike tests based on means and variances, rank-sum tests are more resistant to outliers as they use data ranks instead of raw values. We assigned these over-limit results a value based on the detection-provided thresholds, which did not affect the sample ranks, thus minimally impacting our statistical analysis.
Results
BASELINE DATA COMPARISON:
Baseline data comparison between the intervention and control groups revealed no statistically significant differences in age, sex, BMI, laboratory parameters, or imaging-related indices (Table 1). Before the intervention, we conducted a between-group comparison among patients on gluten-free (n=5), low-calorie (n=8), and low-carbohydrate (n=7) diets within the intervention group. The results demonstrated no statistically significant differences among the 3 groups in age, BMI, laboratory parameters, or imaging indices (Table 2). FT3, FT4, and TSH levels were all within their respective normal ranges.
The FT3, FT4, and TSH levels of all patients were within the normal range. Therefore, it can be assumed that the thyroid function of the study population was essentially normal or within the compensatory range.
LABORATORY AND MRI PARAMETERS COMPARISON IN THE CONTROL GROUP:
The control group received no intervention. When comparing baseline and 6-month follow-up laboratory and imaging parameters in the control group, no statistically significant differences were found except for thyroid isthmus thickness, which was increased (P=0.019) (Table 3).
LABORATORY AND MRI PARAMETER COMPARISON IN THE INTERVENTION GROUP:
In the intervention group, thyroid autoantibody levels significantly decreased (TPOAb, P=0.016; TGAb, P=0.024), and FT3 levels also slightly decreased (P=0.077), remaining within normal ranges. Additionally, the T2-weighted imaging relative signal intensity (T2WI RSI) and water fraction of the thyroid gland significantly decreased (T2WI RSI mean, P<0.001; water fraction mean, P<0.001), while fat fraction increased (fat fraction mean, P=0.030). However, there were no statistically significant changes in thyroid size (including right and left lobes and isthmus) or T1-weighted imaging relative signal intensity (T1WI RSI) (Table 4, Figures 1–3). Subsequently, we analyzed the change values (Δ) between pre- and post-intervention measurements across different dietary management regimens to evaluate treatment efficacy. The results showed no significant differences in the changes (Δ) of these indicators (age, BMI, thyroid function parameters, thyroid autoantibodies, or MRI parameters) among the dietary regimens (P>0.05) (Table 5).
Discussion
STUDY LIMITATIONS AND FUTURE PROSPECTS:
First, this study was a single-center study with a relatively small sample size, which limits the generalizability of these results. Large-scale, multi-center studies are needed to confirm these results. Second, thyroid pathology was not performed in this study due to ethical constraints, and puncture biopsy only reflects localized changes in the sampled area. In contrast, MRI allows a comprehensive, noninvasive assessment of the entire thyroid gland and enables precise MRI-guided puncture and case examination when high-risk or difficult-to-interpret changes are detected. Third, while the sternocleidomastoid muscle was used to standardize signal intensity in this study, measurement errors were unavoidable due to the complex magnetic environment of the neck. Future advancements in thyroid-specific detection coils and homogenization techniques could enhance multi-parametric quantitative MRI (eg, T1- and T2-mapping), enabling more precise assessments and deeper insights into Hashimoto’s thyroiditis mechanisms.
Conclusions
Our findings indicate that dietary management effectively alleviates Hashimoto’s thyroiditis. Additionally, combining multi-parametric MRI sequences offers a valuable quantitative approach for assessing the condition. This approach bridges the gap in traditional testing methods, offering an intuitive, sensitive, and accurate assessment tool that enhances understanding and management of disease progression.
Figures
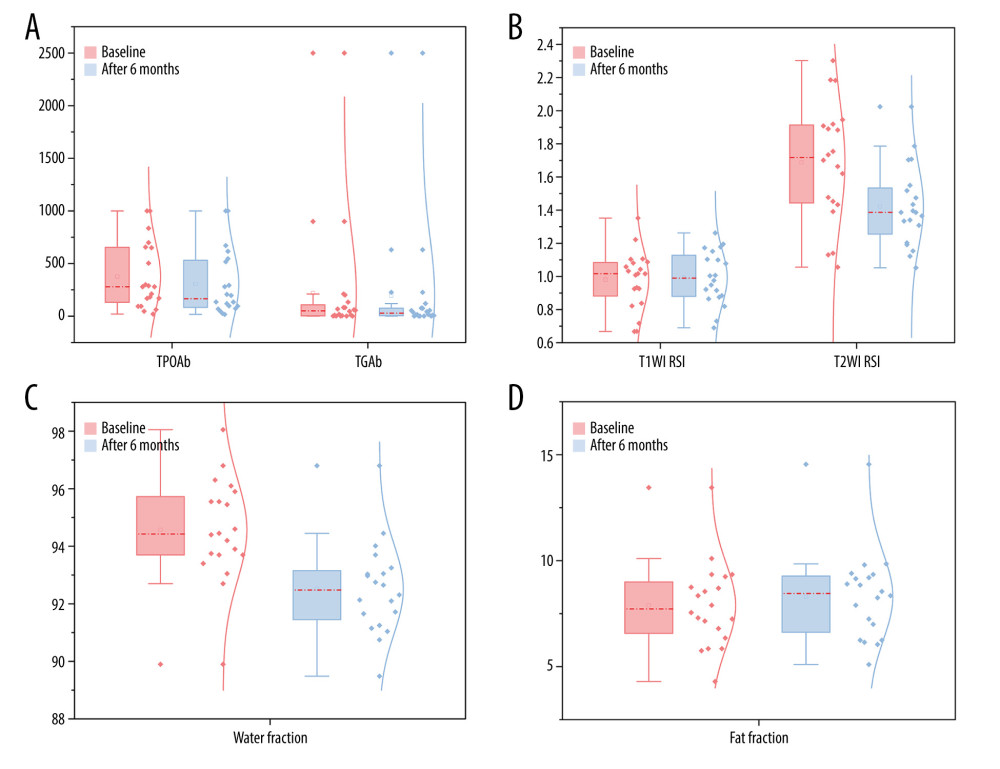 Figure 1. Statistically significant differences (P<0.05) were observed in thyroid antibody levels thyroid peroxidase antibody (TPOAb) and thyroglobulin antibody (TGAb) (A), T2-weighted imaging relative signal intensity (T2WI RSI) (B), water fraction (C), and fat fraction (D) in the intervention group between baseline and after 6 months. This figure was generated using OriginPro 2024 (64-bit) SR1 software (OriginLab Corporation).
 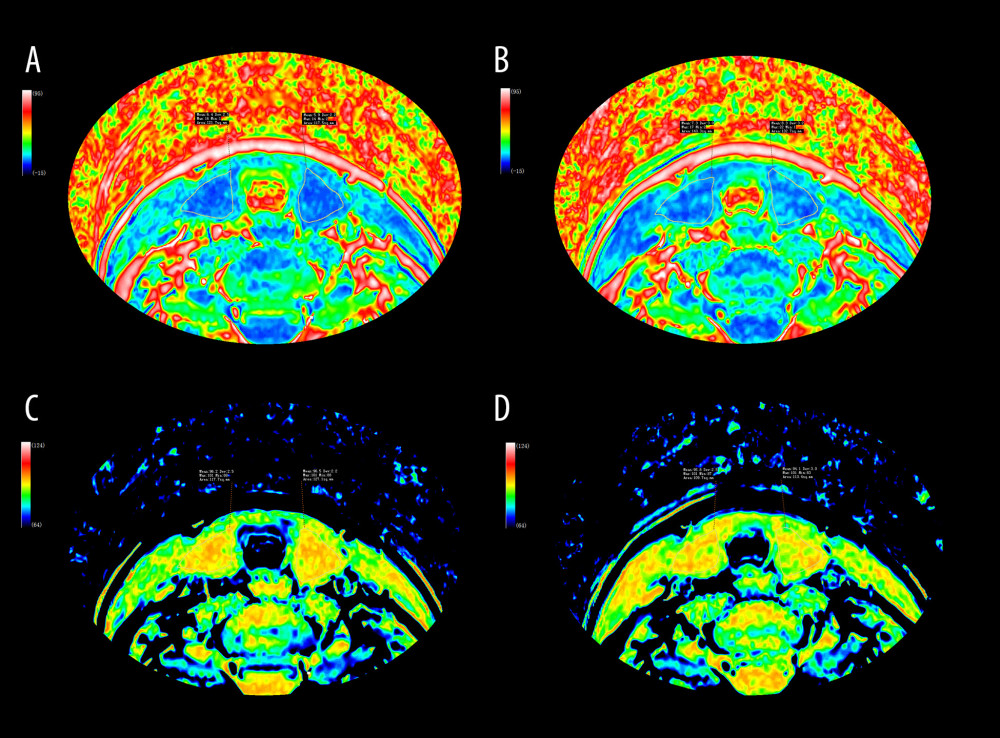 Figure 2. Fat-only (A, B) and water-only (C, D) images were generated through computational analysis. Images A and C depict the thyroid before dietary management, while images B and D illustrate the thyroid after 6 months of dietary management. The images and associated data demonstrate that, in patients with Hashimoto’s thyroiditis, there was a reduction in thyroid water fraction (C, D), along with decreased inflammation, following 6 months of dietary management. Additionally, statistical results indicate an increase in thyroid fat fraction (A, B). This figure was edited using Adobe Photoshop 2022 (version 23.0.0; Adobe Systems Incorporated).
 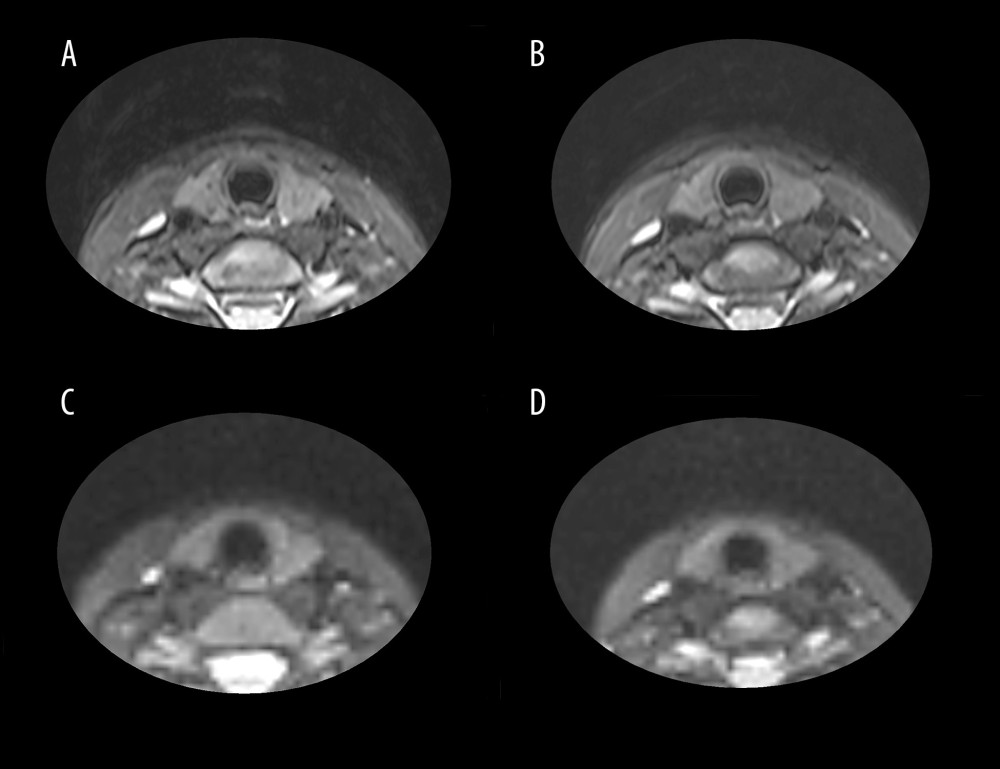 Figure 3. The figure above shows T2WI Dixon (A, B) and DWI (C, D) images from a representative patient. Images A and C demonstrate thyroid morphology prior to dietary intervention, while images B and D show the corresponding changes after 6 months of dietary management. All images were processed using Adobe Photoshop 2022 (version 23.0.0; Adobe Systems Incorporated).
 Tables
Table 1. Comparison of baseline characteristics.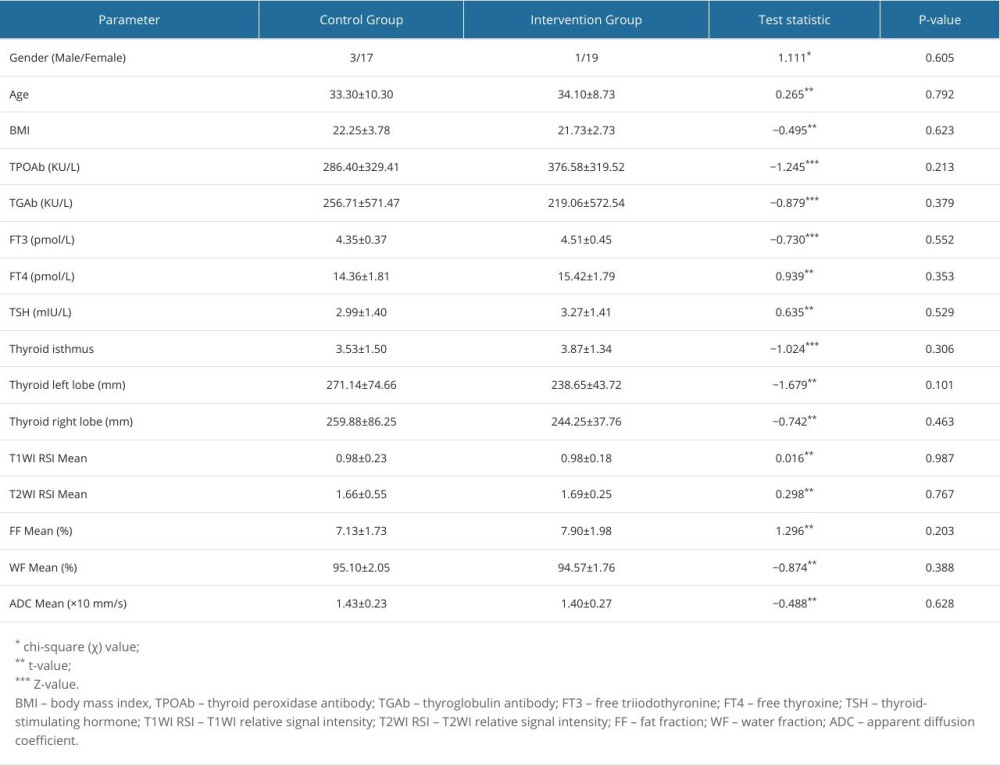 Table 2. Comparative pre-intervention analysis of patients with different dietary management programs in the intervention group.
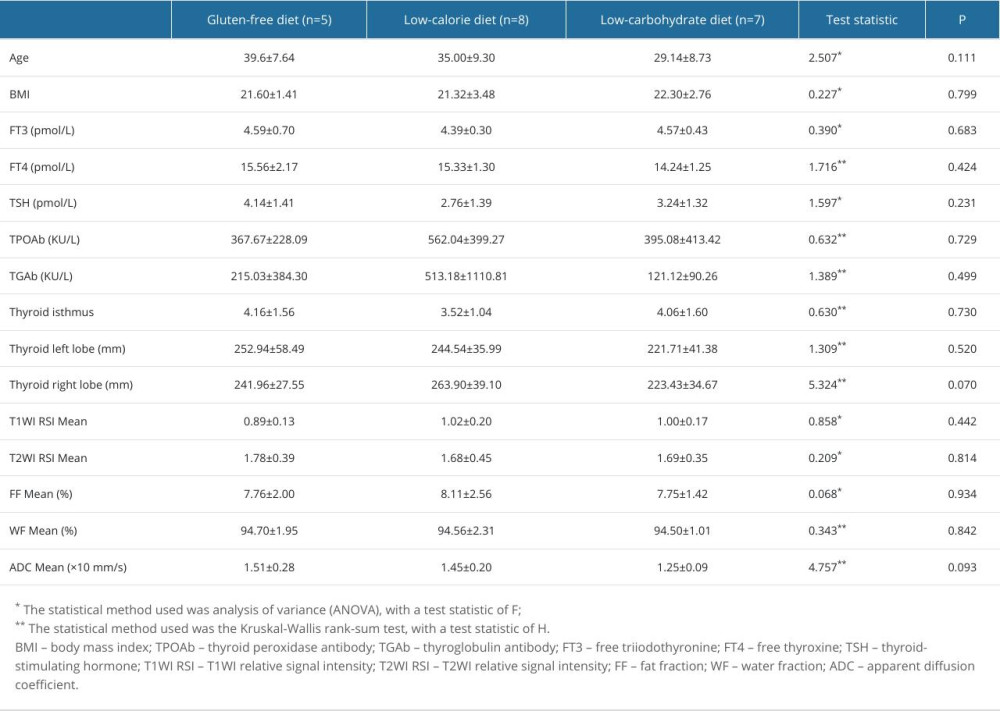 Table 3. Comparison of laboratory and imaging indicators before and after 2 examinations in the control group.
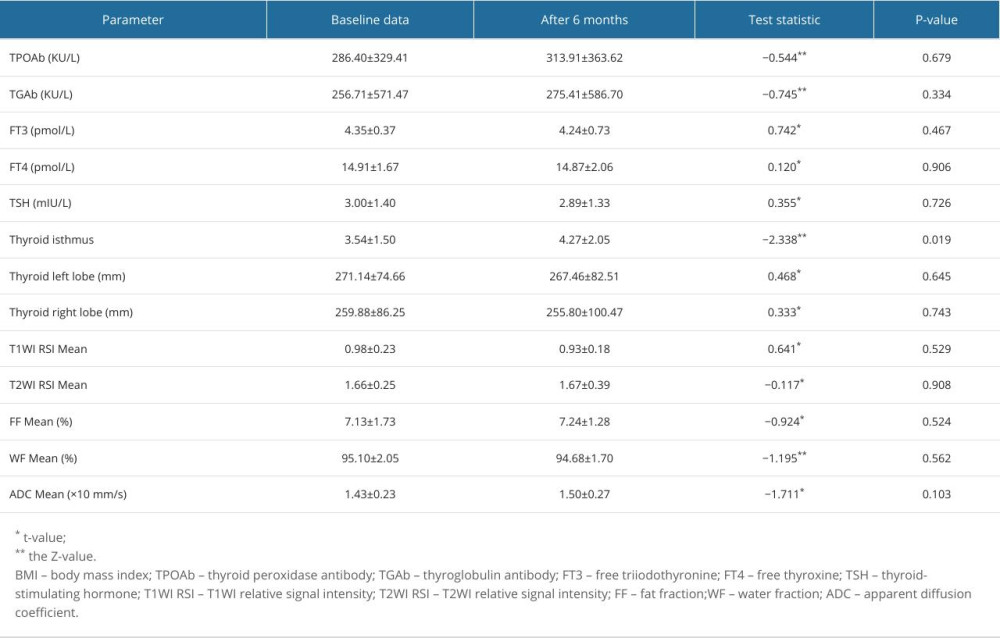 Table 4. Comparison of laboratory and imaging indicators before and after 2 examinations in the intervention group.
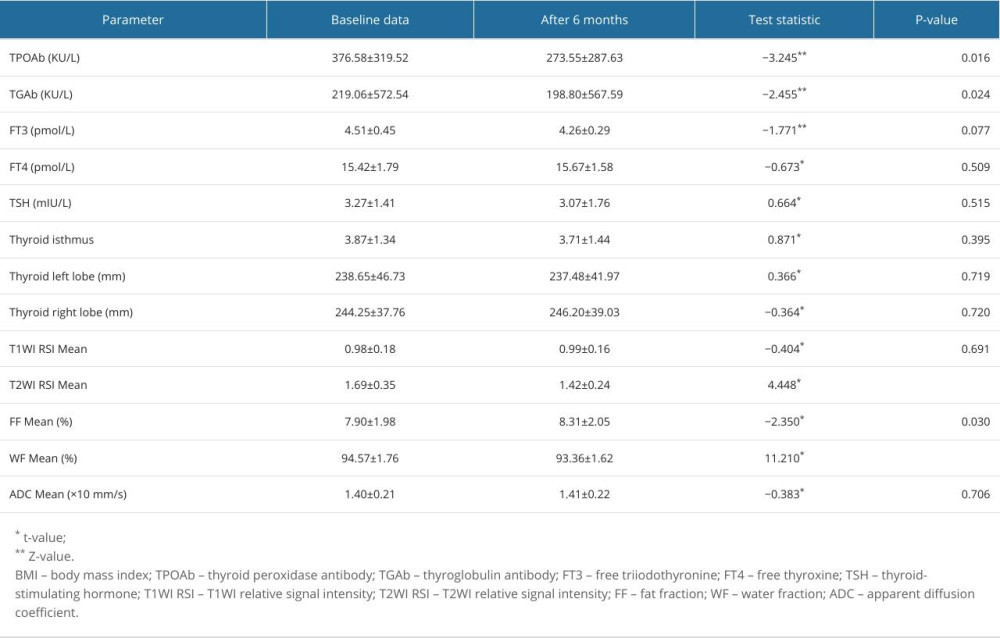 Table 5. Comparative post-intervention analysis of patients in the intervention group with different dietary management programs.
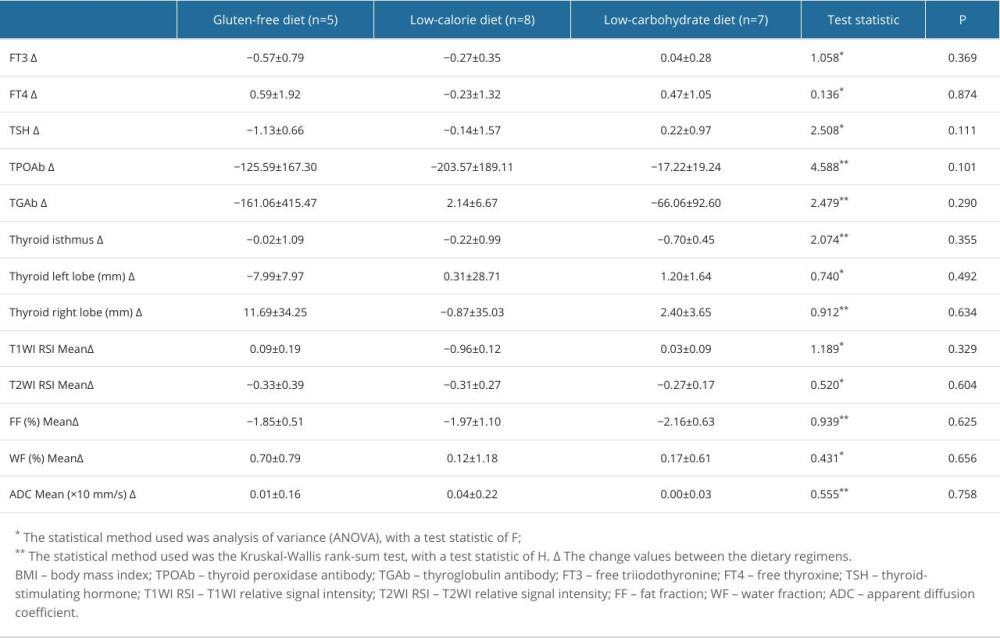
References
1. Ralli M, Angeletti D, Fiore M, Hashimoto’s thyroiditis: An update on pathogenic mechanisms, diagnostic protocols, therapeutic strategies, and potential malignant transformation: Autoimmun Rev, 2020; 19(10); 102649
2. Antonelli A, Ferrari SM, Corrado A, Autoimmune thyroid disorders: Autoimmun Rev, 2015; 14(2); 174-80
3. Caturegli P, De Remigis A, Rose NR, Hashimoto thyroiditis: Clinical and diagnostic criteria: Autoimmun Rev, 2014; 13(4–5); 391-97
4. Dobruch-Sobczak K, Jędrzejowski M, Jakubowski W, Trzebińska A, Errors and mistakes in ultrasound diagnostics of the thyroid gland: J Ultrason, 2014; 14(56); 61-73
5. Kang T, Kim DW, Lee YJ, Magnetic resonance imaging features of normal thyroid parenchyma and incidental diffuse thyroid disease: A single-center study: Front Endocrinol, 2018; 9; 746
6. Waseda Y, Yoshida S, Takahara T, Utility of computed diffusion-weighted MRI for predicting aggressiveness of prostate cancer: J Magn Reson Imaging, 2017; 46(2); 490-96
7. Nishie A, Tajima T, Asayama Y, Diagnostic performance of apparent diffusion coefficient for predicting histological grade of hepatocellular carcinoma: Eur J Radiol, 2011; 80(2); e29-33
8. Lotfalizadeh E, Ronot M, Wagner M, Prediction of pancreatic neuroendocrine tumour grade with MR imaging features: Added value of diffusion-weighted imaging: Eur Radiol, 2017; 27(4); 1748-59
9. Zhu X, Wang J, Wang Y-C, Quantitative differentiation of malignant and benign thyroid nodules with multi-parameter diffusion-weighted imaging: World J Clin Cases, 2022; 10(24); 8587-98
10. Liu J, Chang X, Wang Q, Magnetic resonance T1-mapping quantitatively assesses the severity of thyroid destruction in patients with autoimmune thyroiditis: Front Endocrinol, 2022; 13; 1028588
11. Fischer L, Girotto N, Ilić Tomaš M, Enhanced differentiation of amiodarone-induced thyrotoxicosis types using semi-quantitative 99mTc-MIBI uptake analysis: Aa pilot study: Med Sci Monit, 2024; 30; e945444
12. Medicine Io: Dietary reference intakes for energy, carbohydrate, fiber, fat, fatty acids, cholesterol, protein, and amino acids, 2005, Washington, DC, The National Academies Press
13. Osowiecka K, Myszkowska-Ryciak J, The influence of nutritional intervention in the treatment of Hashimoto’s thyroiditis – a systematic review: Nutrients, 2023; 15(4); 1041
14. Ostrowska L, Gier D, Zyśk B, The influence of reducing diets on changes in thyroid parameters in women suffering from obesity and Hashimoto’s disease: Nutrients, 2021; 13(3); 862
15. Krysiak R, Szkróbka W, Okopień B, The effect of gluten-free diet on thyroid autoimmunity in drug-naïve women with Hashimoto’s thyroiditis: A pilot study: Exp Clin Endocrinol Diabetes, 2019; 127(7); 417-22
16. Esposito T, Lobaccaro JM, Esposito MG, Effects of low-carbohydrate diet therapy in overweight subjects with autoimmune thyroiditis: Possible synergism with ChREBP: Drug Des Devel Ther, 2016; 10; 2939-46
17. Kökten T, Hansmannel F, Ndiaye NC, Calorie restriction as a new treatment of inflammatory diseases: Adv Nutr, 2021; 12(4); 1558-70
18. Piticchio T, Frasca F, Malandrino P, Effect of gluten-free diet on autoimmune thyroiditis progression in patients with no symptoms or histology of celiac disease: A meta-analysis: Front Endocrinol, 2023; 14; 1200372
19. Procaccini C, de Candia P, Russo C, Caloric restriction for the immunometabolic control of human health: Cardiovasc Res, 2024; 119(18); 2787-800
20. Ramos-Lopez O, Martinez-Urbistondo D, Vargas-Nuñez JA, Martinez JA, The role of nutrition on meta-inflammation: Insights and potential targets in communicable and chronic disease management: Curr Obes Rep, 2022; 11(4); 305-35
21. Steckhan N, Hohmann C-D, Kessler C, Effects of different dietary approaches on inflammatory markers in patients with metabolic syndrome: A systematic review and meta-analysis: Nutrition, 2016; 32(3); 338-48
22. Ülker MT, Çolak GA, Baş M, Erdem MG, Evaluation of the effect of gluten-free diet and Mediterranean diet on autoimmune system in patients with Hashimoto’s thyroiditis: Food Sci Nutr, 2024; 12(2); 1180-88
23. Czarnocka B, Janota-Bzowski M, McIntosh RS, Immunoglobulin G kappa antithyroid peroxidase antibodies in Hashimoto’s thyroiditis: Epitope-mapping analysis: J Clin Endocrinol Metab, 1997; 82(8); 2639-44
24. Prummel MF, Wiersinga WM, Thyroid peroxidase autoantibodies in euthyroid subjects: Best Pract Res Clin Endocrinol Metab, 2005; 19(1); 1-15
25. Jin B, Wang S, Fan Z, Pathogenesis markers of Hashimoto’s disease – a mini review: Front Biosci (Landmark Ed), 2022; 27(10); 297
26. Vargas-Uricoechea H, Molecular mechanisms in autoimmune thyroid disease: Cells, 2023; 12(6); 918
27. Pandit AA, Vijay Warde M, Menon PS, Correlation of number of intrathyroid lymphocytes with antimicrosomal antibody titer in Hashimoto’s thyroiditis: Diagn Cytopathol, 2003; 28(2); 63-65
28. Caturegli P, De Remigis A, Chuang K, Hashimoto’s thyroiditis: Celebrating the centennial through the lens of the Johns Hopkins hospital surgical pathology records: Thyroid, 2013; 23(2); 142-50
29. Xue H, Yang Y, Zhang Y, Macrophage migration inhibitory factor interacting with Th17 cells may be involved in the pathogenesis of autoimmune damage in Hashimoto’s thyroiditis: Mediators Inflamm, 2015; 2015; 621072
30. Nakaguro M, Diagnostic clues and pitfalls in salivary gland fine-needle aspiration cytology: Semin Diagn Pathol, 2024; 41(4); 207-11
31. Ollitrault A, Charbonneau F, Herdan M-L, Dixon-T2WI magnetic resonance imaging at 3 tesla outperforms conventional imaging for thyroid eye disease: Eur Radiol, 2021; 31(7); 5198-205
32. Lins CF, Salmon CEG, Nogueira-Barbosa MH, Applications of the Dixon technique in the evaluation of the musculoskeletal system: Radiol Bras, 2021; 54(1); 33-42
33. Mikoś H, Mikoś M, Obara-Moszyńska M, Niedziela M, The role of the immune system and cytokines involved in the pathogenesis of autoimmune thyroid disease (AITD): Endokrynol Pol, 2014; 65(2); 150-55
34. González-Amaro R, Marazuela M, T regulatory (Treg) and T helper 17 (Th17) lymphocytes in thyroid autoimmunity: Endocrine, 2016; 52(1); 30-38
35. Li Y, Liu H, He C, IL-9-producing Th9 cells participate in the occurrence and development of iodine-induced autoimmune thyroiditis: Biol Trace Elem Res, 2023; 201(11); 5298-308
36. Santaguida MG, Gatto I, Mangino G, BREG cells in Hashimoto’s thyroiditis isolated or associated to further organ-specific autoimmune diseases: Clin Immunol, 2017; 184; 42-47
37. Menzilcioglu MS, Duymus M, Gungor G, The value of real-time ultrasound elastography in chronic autoimmune thyroiditis: Br J Radiol, 2014; 87(1044); 20140604
38. Franchi-Abella S, Elie C, Correas J-M, Ultrasound elastography: Advantages, limitations and artefacts of the different techniques from a study on a phantom: Diagn Interv Imaging, 2013; 94(5); 497-501
39. Sigrist RMS, Liau J, Kaffas AE, Chammas MC, Willmann JK, Ultrasound elastography: Review of techniques and clinical applications: Theranostics, 2017; 7(5); 1303-29
40. Ma R, Geng Y, Gan L, Quantitative T1 mapping MRI for the assessment of extraocular muscle fibrosis in thyroid-associated ophthalmopathy: Endocrine, 2022; 75(2); 456-64
41. Nauffal V, Klarqvist MDR, Hill MC, Noninvasive assessment of organ-specific and shared pathways in multi-organ fibrosis using T1 mapping: Nat Med, 2024; 30(6); 1749-60
42. Klaus JB, Goerke U, Klarhöfer M, MRI Dixon fat-corrected look-locker T1 mapping for quantification of liver fibrosis and inflammation – a comparison with the non-fat-corrected shortened modified look-locker inversion recovery technique: Invest Radiol, 2024; 59(11); 754-60
43. Ozturk T, Bozgeyik Z, Ozturk F, The role of diffusion weighted MR imaging for differentiation between Graves’ disease and Hashimoto thyroiditis: Eur Rev Med Pharmacol Sci, 2015; 19(15); 2798-803
44. Shimobayashi M, Albert V, Woelnerhanssen B, Insulin resistance causes inflammation in adipose tissue: J Clin Invest, 2018; 128(4); 1538-50
45. Roy PK, Islam J, Lalhlenmawia H, Prospects of potential adipokines as therapeutic agents in obesity-linked atherogenic dyslipidemia and insulin resistance: Egyptian Heart J, 2023; 75(1); 24
46. Cai Y, Liu P, Xu Y, Biomarkers of obesity-mediated insulin resistance: Focus on microRNAs: Diabetol Metab Syndr, 2023; 15(1); 167
47. Ragusa F, Fallahi P, Elia G, Hashimotos’ thyroiditis: Epidemiology, pathogenesis, clinic and therapy: Best Pract Res Clin Endocrinol Metab, 2019; 33(6); 101367
48. Hueper K, Gutberlet M, Bräsen JH, Multiparametric functional MRI: Non-invasive imaging of inflammation and edema formation after kidney transplantation in mice: PLoS One, 2016; 11(9); e0162705
49. Le Bihan D, Turner R, Douek P, Patronas N, Diffusion MR imaging: Clinical applications: Am J Roentgenol, 1992; 159(3); 591-99
50. Qayyum A, Diffusion-weighted imaging in the abdomen and pelvis: concepts and applications: Radiographics, 2009; 29(6); 1797-810
51. Ahlawat S, Fayad LM, Diffusion weighted imaging demystified: The technique and potential clinical applications for soft tissue imaging: Skeletal Radiol, 2018; 47(3); 313-28
52. Ge Q, Zhang X, Wang L, Quantitative evaluation of activity of thyroid-associated Ophthalmopathy using short-tau inversion recovery (STIR) sequence: BMC Endocr Disord, 2021; 21(1); 226
Figures
Figure 1. Statistically significant differences (P<0.05) were observed in thyroid antibody levels thyroid peroxidase antibody (TPOAb) and thyroglobulin antibody (TGAb) (A), T2-weighted imaging relative signal intensity (T2WI RSI) (B), water fraction (C), and fat fraction (D) in the intervention group between baseline and after 6 months. This figure was generated using OriginPro 2024 (64-bit) SR1 software (OriginLab Corporation).Figure 2. Fat-only (A, B) and water-only (C, D) images were generated through computational analysis. Images A and C depict the thyroid before dietary management, while images B and D illustrate the thyroid after 6 months of dietary management. The images and associated data demonstrate that, in patients with Hashimoto’s thyroiditis, there was a reduction in thyroid water fraction (C, D), along with decreased inflammation, following 6 months of dietary management. Additionally, statistical results indicate an increase in thyroid fat fraction (A, B). This figure was edited using Adobe Photoshop 2022 (version 23.0.0; Adobe Systems Incorporated).Figure 3. The figure above shows T2WI Dixon (A, B) and DWI (C, D) images from a representative patient. Images A and C demonstrate thyroid morphology prior to dietary intervention, while images B and D show the corresponding changes after 6 months of dietary management. All images were processed using Adobe Photoshop 2022 (version 23.0.0; Adobe Systems Incorporated). Tables
Table 1. Comparison of baseline characteristics.Table 2. Comparative pre-intervention analysis of patients with different dietary management programs in the intervention group.Table 3. Comparison of laboratory and imaging indicators before and after 2 examinations in the control group.Table 4. Comparison of laboratory and imaging indicators before and after 2 examinations in the intervention group.Table 5. Comparative post-intervention analysis of patients in the intervention group with different dietary management programs.Table 1. Comparison of baseline characteristics.Table 2. Comparative pre-intervention analysis of patients with different dietary management programs in the intervention group.Table 3. Comparison of laboratory and imaging indicators before and after 2 examinations in the control group.Table 4. Comparison of laboratory and imaging indicators before and after 2 examinations in the intervention group.Table 5. Comparative post-intervention analysis of patients in the intervention group with different dietary management programs. In Press
Clinical Research
Analysis of the Clinical Characteristics and Endoscopic Features of Phytobezoar-Induced Ulcers and Gastric ...Med Sci Monit In Press; DOI: 10.12659/MSM.952191
Clinical Research
Effect of Indirect Co-Culture With Gingival Mesenchymal Stem Cells on Cytokine Secretion in Primary Oral Sq...Med Sci Monit In Press; DOI: 10.12659/MSM.952439
Clinical Research
Comparison of Sleep Architecture in Individuals Aged 65 to 80 Years With and Without Mild Cognitive Impairm...Med Sci Monit In Press; DOI: 10.12659/MSM.952493
Clinical Research
Effects of Single-Bout Endurance Exercise Intensity on Peripheral Neurotrophic Factors in Patients With Isc...Med Sci Monit In Press; DOI: 10.12659/MSM.952089
Most Viewed Current Articles
17 Jan 2024 : Review article 14,176,514
Vaccination Guidelines for Pregnant Women: Addressing COVID-19 and the Omicron VariantDOI :10.12659/MSM.942799
Med Sci Monit 2024; 30:e942799
13 Nov 2021 : Clinical Research 3,760,677
Acceptance of COVID-19 Vaccination and Its Associated Factors Among Cancer Patients Attending the Oncology ...DOI :10.12659/MSM.932788
Med Sci Monit 2021; 27:e932788
14 Dec 2022 : Clinical Research 2,466,264
Prevalence and Variability of Allergen-Specific Immunoglobulin E in Patients with Elevated Tryptase LevelsDOI :10.12659/MSM.937990
Med Sci Monit 2022; 28:e937990
16 May 2023 : Clinical Research 708,906
Electrophysiological Testing for an Auditory Processing Disorder and Reading Performance in 54 School Stude...DOI :10.12659/MSM.940387
Med Sci Monit 2023; 29:e940387