13 February 2022: Clinical Research
Gas Chromatography and Flame-Ionization Detection of Non-Cholesterol Sterols as Indicators of Cholesterol Absorption and Synthesis in 158 Chinese Individuals with Normolipidemia, Hyperlipidemia, and Familial Hypercholesterolemia
Zhi-Zhao Li1DE*, Qi-Hui Wang2C, Yang Liu2C, lvya Wang3A, Zhen-Qiu Yu3A, Qiong Huang4B, Jing Zhang5BDOI: 10.12659/MSM.934471
Med Sci Monit 2022; 28:e934471
Abstract
BACKGROUND: There are limited studies on the effects of cholesterol homeostasis in populations at high risk for cardiovascular disease. We aimed to use gas chromatography and flame-ionization detection (GC-FID) of non-cholesterol sterols as indicators of cholesterol absorption and synthesis. Sterol indicators of cholesterol absorption included campesterol, stigmasterol, and sitosterol. Sterol indicators of cholesterol synthesis included squalene, 7-lathosterol, and desmosterol.
MATERIAL AND METHODS: A total of 158 participants were enrolled in 3 groups: healthy control (n=64), hyperlipidemia (n=69), and familial hypercholesterolemia (FH, n=25). Age, sex, blood pressure, blood glucose, and lipoprotein were collected, and cholesterol absorption and synthesis markers were determined by GC-FID.
RESULTS: All 6 cholesterol concentration indicators, except squalene, were significantly different among the 3 groups (all P<0.05); whereas in the ratio to cholesterol (%, sterols/cholesterol), only desmosterol and lathosterol were significantly different (P<0.05). Multifactorial regression analysis showed that triglycerides, total cholesterol, and desmosterol were independent risk factors affecting the development of hyperlipidemia (P<0.05). The efficacy of the ROC curve for the diagnosis of dyslipidemia was also higher for all 3 indices (Model 1, AUC=0.960). Model 1 was superior to Model 2 for the 6 indicators of cholesterol. For the FH and dyslipidemia groups, the 6-indicator model (Model 3) was shown to have a good diagnostic value (AUC=1.000).
CONCLUSIONS: The 6 sterol indicators of cholesterol absorption and synthesis had a dynamic course in all study participants. Desmosterol was an indicator of dyslipidemia. The combined use of the 6 sterol indicators differentiated between healthy individuals and patients with dyslipidemia and FH.
Keywords: Absorption, Metabolism, Cholesterol, synthesis, Case-Control Studies, China, Chromatography, Gas, Female, Humans, Hyperlipidemias, Hyperlipoproteinemia Type II, Male, Prevalence, Risk Factors, sterols
Background
Dyslipidemia is an important risk factor for atherosclerotic cardiovascular disease; however, the rate of lipid reduction in dyslipidemia is low. Cholesterol in the body comes from absorption and synthesis, and detecting the characteristics of absorption and synthesis of cholesterol is important for understanding individual differences in cholesterol metabolism and guiding clinical drug use [1]. Various markers of cholesterol uptake and synthesis maintain a steady-state of its metabolism through negative regulatory mechanisms that provide a better picture of cholesterol metabolic function than do conventional lipids. Studies have shown inconsistent lipoprotein abnormalities across different patterns of cholesterol homeostasis. The 24-dehydrocholesterol/sitosterol ratio can be used to assess patient dyslipidemia and to guide treatment after disease progression [2]. A study showed that abnormal concentrations of low synthetic and high absorption markers of cholesterol in the blood reflect an impaired homeostatic environment, which is an important independent prognostic factor for the prevalence of cardiovascular disease in the population. Therefore, it is crucial to capture the pattern of cholesterol homeostasis in different populations of patients with cardiovascular disease [3]. The Scandinavian Simvastatin Survival Study [4] showed that a reduction in major coronary events in one-third of patients come from the cholestanol/cholesterol ratio and that cholesterol synthesis markers are decreased and cannot be explained from baseline lipids. The gas chromatography and flame-ionization detection (GC-FID) method has good accuracy and precision in the determination of squalene and 5 non-cholesterol sterols, with good stability at 12 h [5]. Therefore, this study aimed to use GC-FID of non-cholesterol sterols as indicators of cholesterol absorption and synthesis in 158 Chinese individuals with normolipidemia, hyperlipidemia, and familial hypercholesterolemia. Sterol indicators of cholesterol absorption included campesterol, stigmasterol, and sitosterol. Sterol indicators of cholesterol synthesis included squalene, 7-lathosterol, and desmosterol.
Material and Methods
STUDY GROUPS:
Sixty-nine patients with hyperlipidemia, including 30 men and 39 women, were selected from the outpatient department of Beijing Anzhen Hospital, affiliate of Capital Medical University. The average patient age was 50.3±5.9 years. Dyslipidemia was defined as total cholesterol >5.72 mmol/L and/or triglyceride >1.7 mmol/L [6]. The control group consisted of 64 healthy participants, including 16 men and 48 women with an average age of 49.58±7.18 years. Patients with liver, kidney, endocrine, and metabolic diseases, which affect blood lipid metabolism, were excluded. Healthy participants had normal blood lipid levels and were qualified by physical examination. Other diseases were excluded on physical examination, and the liver and kidney functions were determined to be normal. A total of 25 patients (13 males and 12 females, ranging in age from 6 to 53 years) with a clinically confirmed familial hypercholesterolemia (FH) were enrolled in the Atherosclerosis Outpatient Clinic The diagnostic criteria for familial hypercholesterolemia included (1) blood cholesterol concentration >7.3 mmol/L in adults and >6.57 mmol/L in children; (2) the occurrence of yellow tendon tumors in the patient or in first-degree relatives; (3) hypercholesterolemia in first-degree relatives; and (4) hypercholesterolemia detected in childhood in the patient’s family members. The diagnosis of FH was made by the presence of inclusion criterion 1 and any of criteria 2 and 4. Blood pressure was measured with a tabletop sphygmomanometer, and body mass index (BMI) was calculated as weight/height (kg/m2) [7].
BIOCHEMICAL INDEX DETERMINATION:
After centrifugation at 4000 r/min for 10 min, the upper plasma was collected and stored at −80°C. Total cholesterol, triglycerides, high-density lipoprotein (HDL), low-density lipoprotein cholesterol (LDL-C), and fasting plasma glucose (FPGc) were routinely detected after fasting. Each of the above factors was tested on a fully automated biochemical instrument, and the Friedewald formula was used to calculate LDL-C [8].
DETERMINATION OF CHOLESTEROL ABSORPTION AND SYNTHETIC MARKERS:
The GC-FID method, which we had established earlier, was used to detect cholesterol synthesis markers (squalene, lathosterol, and desmosterol) and absorption markers (campesterol, stigmasterol, and sitosterol) [5]. For eliminating the effects of continuous cholesterol change, the absorption rate was represented by plant sterols/cholesterol and cholesterol synthesis rate by precursor concentration of cholesterol/cholesterol (unit: μmol/mmol,%). The procedure was as follows: 1 mL of serum was kept frozen at −80°C for the determination of cholesterol absorption synthetic markers. The serum underwent saponification by alkaline alcohol solution, extraction by hexane, and silylation before treatment on the machine; the data were analyzed by GC-FID. The conditions for detection included a HP-5 quartz capillary column (30 m×0.32 mm×0.25 μm); an initial column temperature of 150°C was held for 3 min, a programmed ramp-up rate of 30°C/min to 250°C, then to 280°C at 5°C/min, was held for 30 min; the hydrogen FID temperature was 290°C; and the inlet temperature was 290°C. The inlet pressure was 15 psi, the non-split mode was used, and the injection volume was 1 μL (increasing). In this study, the relationship between cholesterol absorption and synthesis was investigated in terms of the ratio of campesterol/cholesterol, ratio of sitosterol/cholesterol, and relationship between 7-lathosterol/cholesterol.
REAGENTS:
Assay kits for total cholesterol, triglycerides, high-density lipoprotein, blood glucose, and alanine aminotransferase (ALT) were obtained from the Zhongsheng Co. Cholesterol, 5A-cholestane, desmosterol, lathosterol, squalene, campesterol, stigmasterol, and sitosterol were obtained from Sigma-Aldrich. KOH (analytical pure), anhydrous ethanol (chromatographic pure), and n-hexane (chromatographic pure) were obtained from Beijing Chemical Reagent Company. The HMDS: TMCS: pyridine ratio was 3: 1: 9 and was obtained from Supelco Co. The experimental water used was ultrapure water obtained from Millipore.
EQUIPMENT:
The following equipment and devices were used: a CRONY 630 semi-automatic biochemical analyzer (CRONY Instruments, Italy); high-speed centrifuge (Shanghai Medical Analysis Instrument Factory); gas chromatograph 7890A (Agilent); electronic balance CP225D (Sartorius, accurate to 0.00001 g); nitrogen blower N-EavPTM111 (Organomation Associates, Inc); centrifuge TDL-60C (Shanghai Anting Scientific Instrument Factory); Hh-4 digital display constant temperature water bath (Jiangsu Jintan Ronghua Instrument Manufacturing Co); LTD.KQ3200 ultrasonic cleaner (Kunshan Ultrasonic Instrument Co); LTD.DHC-90a electric thermostatic drying oven (Shanghai Jinghong Experimental Equipment Co); and LTD.GHK-500 type hydrogen and air generator (Beijing Oriental Jinghuayuan Technology Co, Ltd).
STATISTICAL METHODS:
The mean±standard deviation was used to express continuous data that conformed to a normal distribution. For data with a non-normal distribution, we used the median (25%, 75%) to express the data. For the comparison of 3 and more sets of continuous data, the chi-squared test was used; for the comparison of 2 sets of continuous data, the
Results
COMPARISON OF BASIC GROUP DATA:
A total of 158 participants were included in this study. There were 64 healthy participants in the control group, with 16 (25.0%) men and 48 (75.0%) in women; 69 patients in the simple dyslipidemia group, with 30 (43.5%) men and 39 (56.5%) women; and 25 patients in the familial hypercholesterolemia group, with 13 (52.0%) males and 12 (48.0%) females. The age distribution of healthy individuals and patients with simple dyslipidemia was 51.0 (45.0, 55.0) years and 52.0±5.8 years, respectively, with no significant difference between the 2 groups (z=−0.043, P=0.966). The age data of patients with familial hypercholesterolemia were incomplete, and only the approximate range of 6 to 53 years was known. The BMI values of healthy individuals and patients with simple dyslipidemia were 24.33 (21.66, 27.69), and 26.01±3.58, respectively, with no significant difference between the 2 groups (P=0.066). Among the lipid-related parameters, HDL-C, LDL-C, triglycerides, and total cholesterol were significantly different overall between the 3 groups (all P<0.05). The 2-way comparison showed that there was a statistically significant difference between the 2 groups (all P<0.05), except for the HDL-C comparison between the control group and the 2 patient groups (P=0.570). Detailed results are shown in Table 1.
CONCENTRATION AND RATIO OF CHOLESTEROL SYNTHESIS AND ABSORPTION MARKERS TO CHOLESTEROL IN THE 3 GROUPS:
Subsequently, we compared and analyzed the concentrations and ratios of cholesterol synthesis and absorption markers to cholesterol in healthy participants and patients with dyslipidemia and FH. The results showed that in the concentration distribution of 5 cholesterol markers (except for squalene [mg/dL]), the comparisons among the 3 groups showed overall statistically significant differences (all P<0.05). Moreover, the sum of the 6 indicators was also statistically different among the 3 groups (P<0.001). Among sterols/cholesterol (%), only desmosterol (%) and lathosterol (%) were significantly different among the 3 groups (P<0.001). Detailed results are shown in Table 2.
CORRELATION ANALYSIS OF CHOLESTEROL SYNTHESIS AND ABSORPTION MARKERS:
We then performed a correlation analysis of the ratios of cholesterol absorption and synthesis indicators to cholesterol concentrations in the 3 groups. The results showed that in the healthy control group, the indicators with negative correlations included desmosterol vs squalene (r=−0.264, P=0.035), lathosterol vs campesterol (r=−0.400, P=0.001), and lathosterol vs sitosterol (r=−0.255, P=0.042). Positive correlations were found for campesterol vs sitosterol (r=0.715, P<0.001) and desmosterol vs lathosterol (r=0.262, P=0.037) in the control and dyslipidemia groups (Figure 1A–1E).
In the dyslipidemia group, positive correlations included lathosterol vs desmosterol (r=0.520, P<0.001) and campesterol vs sitosterol (r=0.943, P<0.001). Negative correlations were observed for desmosterol vs campesterol (r=−0.261, P=0.031), lathosterol vs campesterol (r=−0.511, P<0.001), and lathosterol vs sitosterol (r=0.495, P<0.001) (Figure 1F–1J).
In the FH group, the indicators with significantly different correlations were all positive. Among the indicators with correlations were desmosterol vs lathosterol (r=0.555, P=0.004), campesterol vs stigmasterol (r=0.986, P<0.001), campesterol vs sitosterol (r=0.998, P<0.001), and stigmasterol vs sitosterol (r=0.989, P<0.001) (Figure 1K–1N).
THE RESULTS OF MULTIFACTORIAL REGRESSION ANALYSIS:
We performed a multifactorial regression analysis on the control group and dyslipidemia group. The results showed that triglycerides (mmol/L; P<0.001), total cholesterol (mmol/L; P=0.002), and desmosterol (%, P=0.011) were independent risk factors for dyslipidemia in the patients. Details are shown in Table 3.
ROC CURVE RESULTS FOR HEALTHY CONTROL AND DYSLIPIDEMIA GROUPS:
We used ROC curves to investigate the diagnostic value of with triglycerides (mmol/L), total cholesterol (mmol/L), and desmosterol (%) in the dyslipidemia group. We also used logistic regression analysis to construct a joint diagnostic model, Model 1, for the 3 groups; it was also compared with Model 2, which was constructed by combining 6 catabolic and synthetic markers of cholesterol with the ratio of cholesterol (%). In this study, triglycerides (mmol/L) had the best diagnostic value (AUC=0.833, sensitivity=72.46%, specificity=100%) when a single factor diagnosis was performed. However, all 3 indicators were not as good as the diagnostic value of Model 1 (AUC=0.960, sensitivity=86.76%, specificity=95.31%), and there were statistically significant differences between Model 1 and the other 3 groups. A model consisting of 6 synthetic and catabolic markers of cholesterol had low diagnostic value (AUC=0.728, sensitivity=77.94%, specificity=62.50%). Details are shown in Table 4 and Figure 2.
RESULTS OF THE ROC CURVE FOR THE DYSLIPIDEMIA AND FH GROUPS:
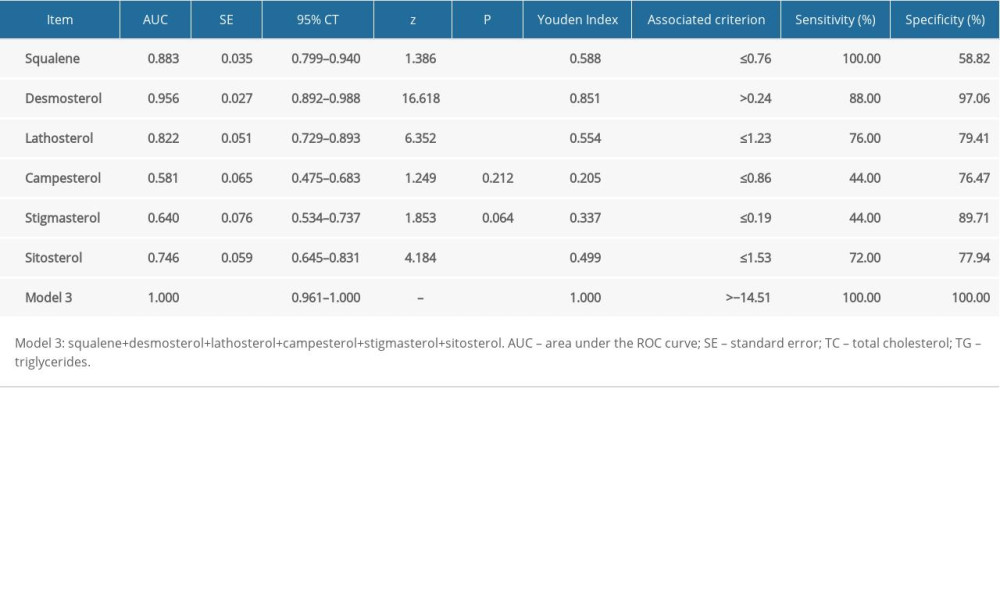
We performed statistical analysis of the diagnostic value of the 6 synthetic and absorption markers of cholesterol in the dyslipidemia and FH groups. Except for campesterol (%) and stigmasterol (%), the results showed above-moderate diagnostic levels for the other 4 indicators (Table 5). Model 3, which was constructed with the 6 markers, had a near-perfect diagnostic value (AUC=1.000, sensitivity=100.00%, specificity=100.00%) (Figure 3).
Discussion
DISTRIBUTION OF MARKERS OF CHOLESTEROL ABSORPTION AND SYNTHESIS AND INDIVIDUAL DIFFERENCES IN CHOLESTEROL METABOLISM:
Cholestanol, a marker of cholesterol absorption, exists in small amounts with cholesterol in the organism and is reduced by cholesterol contact. Like cholesterol, phytosterols are absorbed in the small intestine but are difficult to esterify. The phytosterols absorbed by intestinal mucosal cells are secreted back into the intestinal cavity, and their absorption rate is much lower than that of cholesterol [10,11]. The rate of bile excretion is faster than that of cholesterol, so the concentration of phytosterols in the body is much lower than that of cholesterol. The cholesterol synthesis markers are the precursors of cholesterol biosynthesis, which is constantly biotransformed, and the concentration is also low. Therefore, the structure of non-cholesterol sterol in serum is similar to that of cholesterol, but the content of non-cholesterol sterol is much lower than that of cholesterol. The results of the present study are consistent with the report by Baila-Rueda et al [12], in which the sum average value of 6 non-cholesterol sterols was 0.995 mg/dL (0.814, 1.171), which is about 0.672% (0.549%, 0.800%) of the total cholesterol in healthy individuals. Only Hamilton et al [13] reported that the high and low values of lathosterol were measured according to circadian rhythm (5.50±1.52 [SD] umol/L, 6.18±1.80 [SD] umol/L), and the values were much higher in infants. The value of lathosterol (5.6±2.2 [SD] umol/L) in the present experiment was within this range. In addition, the value of lathosterol/cholesterol in the present experiment was 153±0.58 umol/mmol in ages 30 to 65 years, and in recent foreign studies was 107±58 umol/mmol in ages 12 to 18 years. A rise in cholesterol synthesis could explain the difference in the decrease of cholesterol absorption with the increase of age. The mean sitosterol values of all non-cholesterol were consistent with those reported by Baila-Rueda et al [12] while the others were significantly different. This can be partly explained by environmental genetics. Studies have shown that the absorption of dietary cholesterol is highly individualized, and different countries, periods, and individuals have different dietary habits [14–16]. In addition, in the present study, the non-cholesterol steroid content was minimal, and experimental errors were partly to blame. Some people had high absorption and some people had high synthesis. Other studies have shown that patients with type 2 diabetes and metabolic syndrome have high cholesterol synthesis [17–19], while patients with type 1 diabetes and familial hypercholesterolemia have high cholesterol absorption [20–22], further explaining the characteristics of individual differences in cholesterol absorption and synthesis.
HOMEOSTASIS OF CHOLESTEROL METABOLISM AND CORRELATION BETWEEN MARKERS OF CHOLESTEROL ABSORPTION AND SYNTHESIS:
The overall cholesterol metabolic balance is regulated by dietary cholesterol absorption, endogenous cholesterol synthesis, and bile acid cholesterol secretion [5,23–24], and when any link is disturbed, this balanced relationship is destroyed. That is, in the healthy human body, cholesterol absorption and synthesis maintain a dynamic balance, when absorption increases, synthesis decreases. It is clear that absorption and synthesis change in opposite directions, maintaining the homeostasis of the internal environment. However, this self-regulation will disappear after reaching a certain high value [25]. In the present study, this was confirmed in healthy controls and in patients with hyperlipidemia and familial hypercholesterolemia. In the healthy control group, campesterol, an absorptive marker of cholesterol, was positively correlated with sitosterol, another absorptive factor; and negatively correlated with lathosterol, a synthesis factor. The synthesis factor desmosterol was positively correlated with another synthesis factor, lathosterol, which was negatively correlated with sitosterol. The various absorption and synthesis factors work together to maintain the dynamic equilibrium of cholesterol. In patients with dyslipidemia, the synthesis factor lathosterol was negatively correlated with the absorption factors campesterol and sitosterol and positively correlated with the synthesis factor desmosterol. Campesterol was negatively correlated with desmosterol and positively correlated with sitosterol. The above results show that in patients with dyslipidemia, the synthesis factor and absorption factor of cholesterol still have mutual adjustment effects. More encouragingly, this relationship disappeared in patients with familial hypercholesterolemia. In patients with FH, the results showed that the absorption factor campesterol was not only positively correlated with stigmasterol and sitosterol but was also positively correlated with the synthesis factor desmosterol (P<0.05). This showed that there was a disorder between cholesterol absorption and synthesis factor in patients with FH. The contents of squalene and the 5 non-cholesterol steroids in the hyperlipidemia group were higher than those in the healthy control group. In familial hypercholesterolemia group, the contents of the 5 non-cholesterol steroids were higher than those in the dyslipidemia group. There were statistically significant differences, except for squalene (P<0.05). The reason may be that squalene is the sterol in the metabolic production is the final metabolite of cholesterol synthesis, but is far less effective than the precursor sterol, so that in the squalene/cholesterol ratio, the synthetic inhibitor in the sterol ester does not change its high content [26–27] in type 2 diabetes and metabolic syndrome and in patients with obesity [18,28–30]. One reason for high cholesterol synthesis, in this case, is that there is no direct cholesterol consumption, but rather the excess of the remaining fatty acids initiates a large amount of cholesterol synthesis. This is possible because of the accumulation of early cholesterol metabolites such as squalene in the serum. However, this is completely different from the actual cholesterol consumption when cholesterol absorption is maladjusted. When cholesterol absorption is maladjusted, precursor sterols like lathosterol are elevated, but squalene is not. In the Scandinavian Simvastatin Survival Study, low levels of sitosterol, cholestanol, oat sterols, campesterol squalene, and squalene/cholesterol did not change even with a high dose of anti-statin therapy [31]. Synthetic markers and absorption markers of cholesterol are more sensitive to cholesterol metabolism than each marker, which has been pointed out in previous studies on cholesterol synthesis [32]. Moreover, recent studies have shown that increased cholesterol synthesis and absorption is a major cause of coronary heart disease [33].
In this study, we also found that in healthy people and patients with hyperlipidemia, in addition to triglycerides (mmol/L) and total cholesterol (mmol/L), desmosterol (%) was an independent factor affecting the risk of hyperlipidemia in patients. Also, in patients with hyperlipidemia and familial hypercholesterolemia, the model constructed by the 6 factors of cholesterol can be used for the differential diagnosis of these 2 groups of patients. This is consistent with recent studies which have reported that it suggests the existence of different lipoprotein abnormalities according to various patterns of cholesterol homeostasis. The desmosterol/β-sitosterol ratio could be used for estimating an individual propensity toward dyslipidemia development and direct future treatment [2].
This study has some limitations, including (1) the small sample size of this experiment limits the conclusions of this study to some extent; (2) the study needs to be further developed in different disease populations; (3) the participants in this study were from a single center, and a multicenter study is needed to make the conclusions more reliable; and (4) GC-FID is much more complex than routine lipid testing and needs to be simplified so that it can be carried out in large numbers.
Conclusions
There are individual differences between absorption and synthesis of cholesterol and diverse characteristics in different individuals and patients. In the healthy population and in patients with hyperlipidemia, absorption synthesis changes in the opposite direction up to a point where this relationship disappears, as in healthy individuals with hyperlipidemia, whereas in FCH, this relationship disappears. Different people have different characteristics of cholesterol absorption and synthesis; therefore, lipid-lowering drugs can be selected according to the characteristics of absorption and synthesis to achieve a therapeutic effect. In this study of 158 Chinese individuals with normolipidemia, hyperlipidemia, and familial hypercholesterolemia, the 6 sterol indicators of cholesterol absorption and synthesis had a dynamic course in all study participants. Desmosterol was an indicator of dyslipidemia. The combined use of the 6 sterol indicators differentiated between healthy individuals and patients with dyslipidemia and FH.
The results of this study may aid understanding of the characteristics of cholesterol absorption and synthesis in various populations and patients with various diseases, and aid in selecting cholesterol absorption or synthesis inhibitors to achieve therapeutic effect according to the situation, thereby providing a new vision for the treatment of lipid-regulating diseases.
Data Availability
All data associated with this study are presented in the paper, and all figures and tables have associated raw data. Any materials that can be shared will be released via a material transfer agreement. The images are original with no duplication and have not been previously published in whole or in part. Written informed consent was obtained from each patient. This study was approved by the Ethics Committee of Anzhen Hospital.
Figures
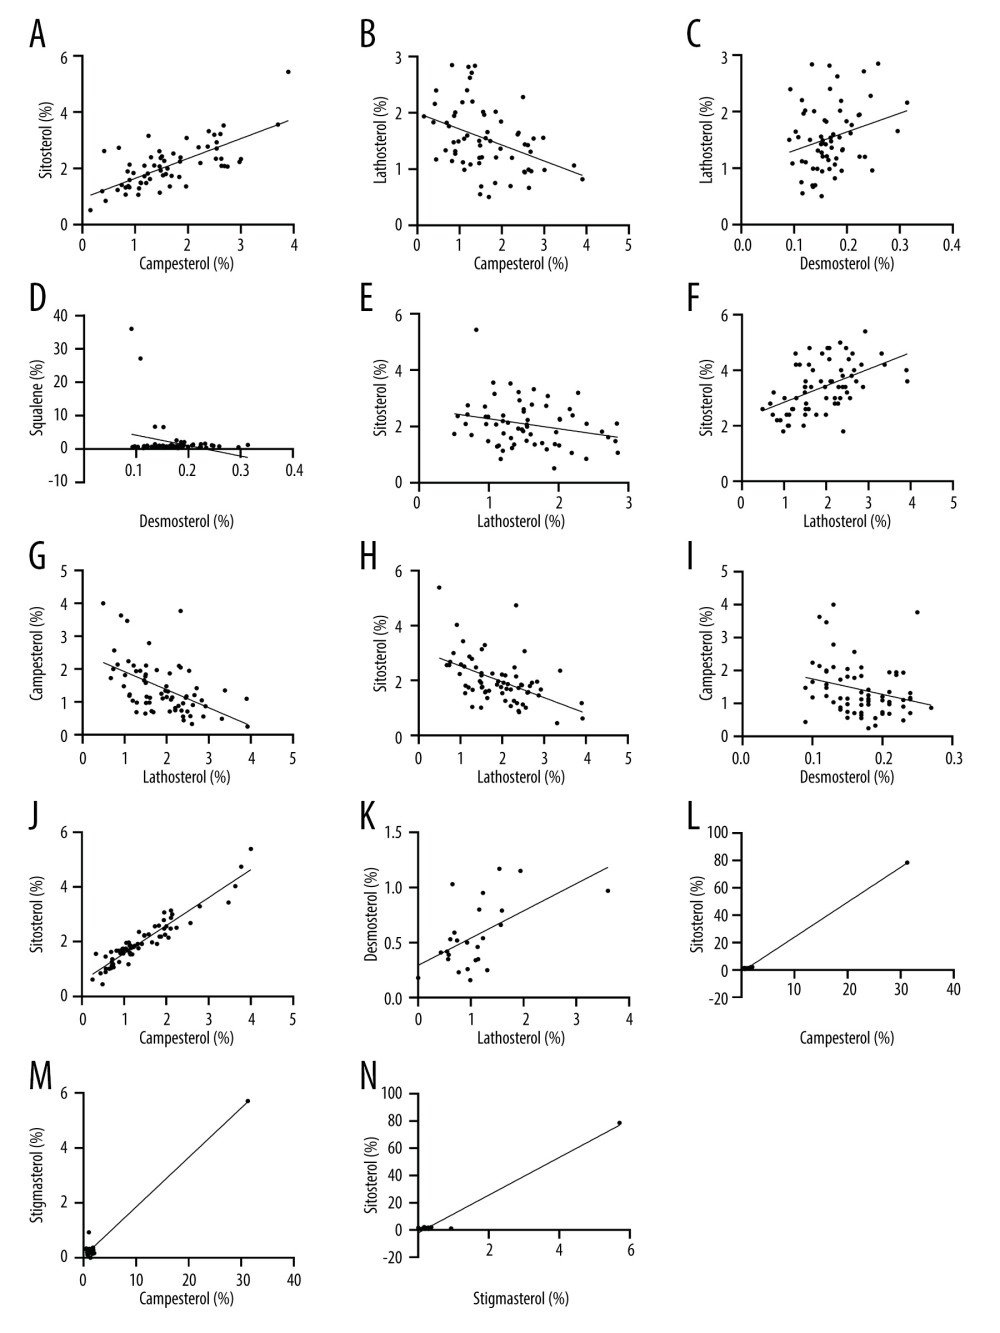 Figure 1. Correlation of cholesterol absorption factors and synthesis factors in the 3 groups(A–E) Health group; (F–J) hyperlipidemia group; (K–N) familial hypercholesterolemia group. (A) campesterol (%) vs sitosterol (%); (B) campesterol (%) vs lathosterol (%); (C) desmosterol (%) vs Lathosterol (%); (D) desmosterol (%) vs squalene (%); (E) lathosterol (%) vs sitosterol (%). (F) lathosterol (%) vs desmosterol (%); (G) lathosterol (%) vs campesterol (%); (H) lathosterol (%) vs sitosterol (%); (I) desmosterol (%) vs campesterol (%); (J) campesterol (%) vs sitosterol (%); (K) lathosterol (%) vs desmosterol (%); (L) campesterol (%) vs sitosterol (%); (M) campesterol (%) vs stigmasterol (%); (N) stigmasterol (%) vs sitosterol (%).
 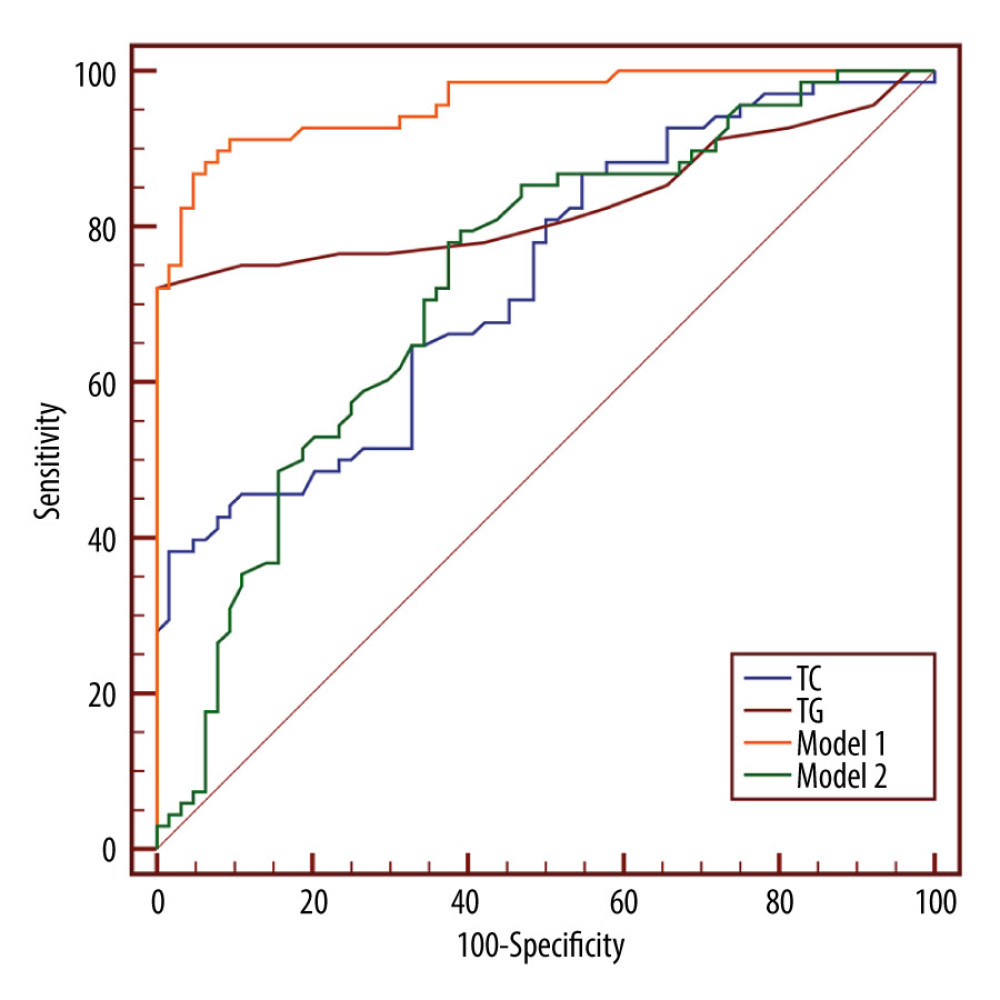 Figure 2. Receiver operating characteristic curve comparing the dyslipidemia group and healthy groupModel 1: total cholesterol + triglycerides + desmosterol (%); Model 2: squalene (%) + desmosterol (%) + lathosterol (%) + campesterol (%) + stigmasterol (%) + sitosterol (%).
 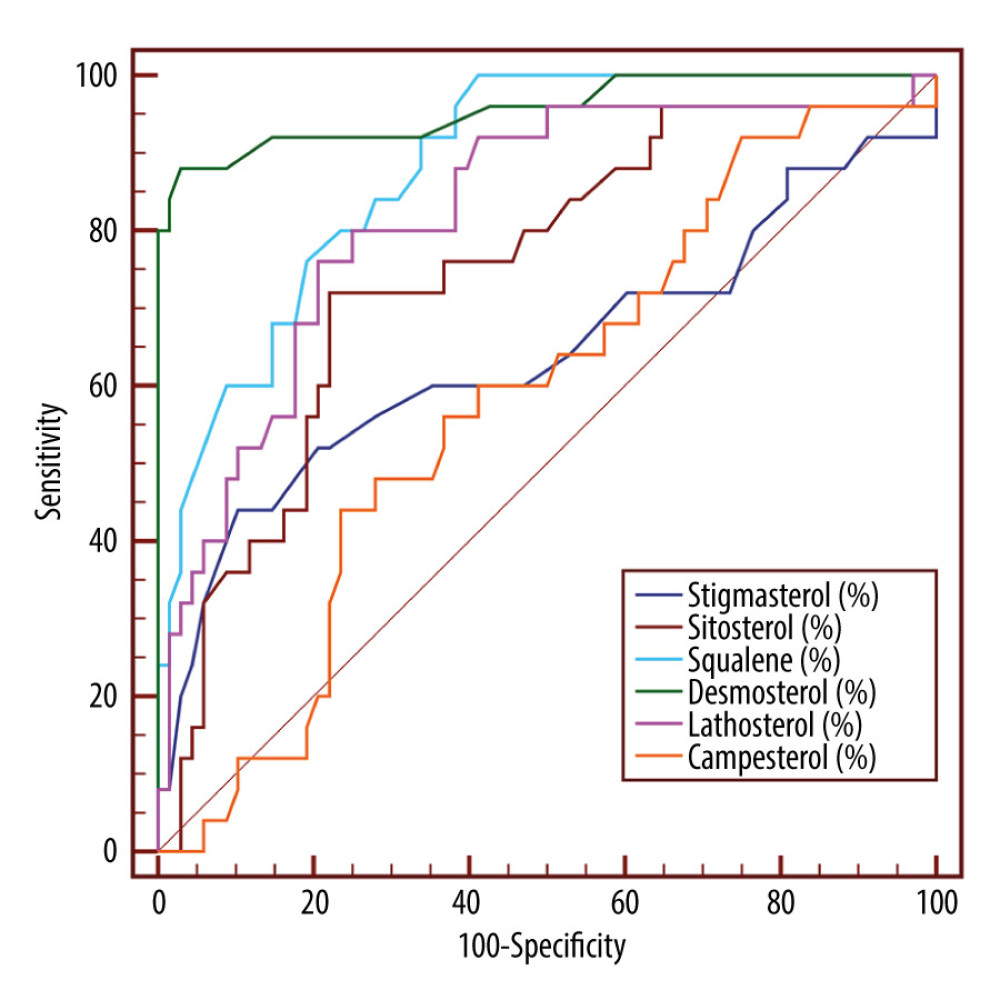 Figure 3. Receiver operating characteristic curve comparing familial hypercholesterolemia group and dyslipidemia group.
 Tables
Table 1. Levels of high-density lipoprotein cholesterol, low-density lipoprotein cholesterol, triglycerides, total cholesterol, and fasting plasma glucose and blood pressure in healthy group and dyslipidemia and familial hypercholesterolemia groups.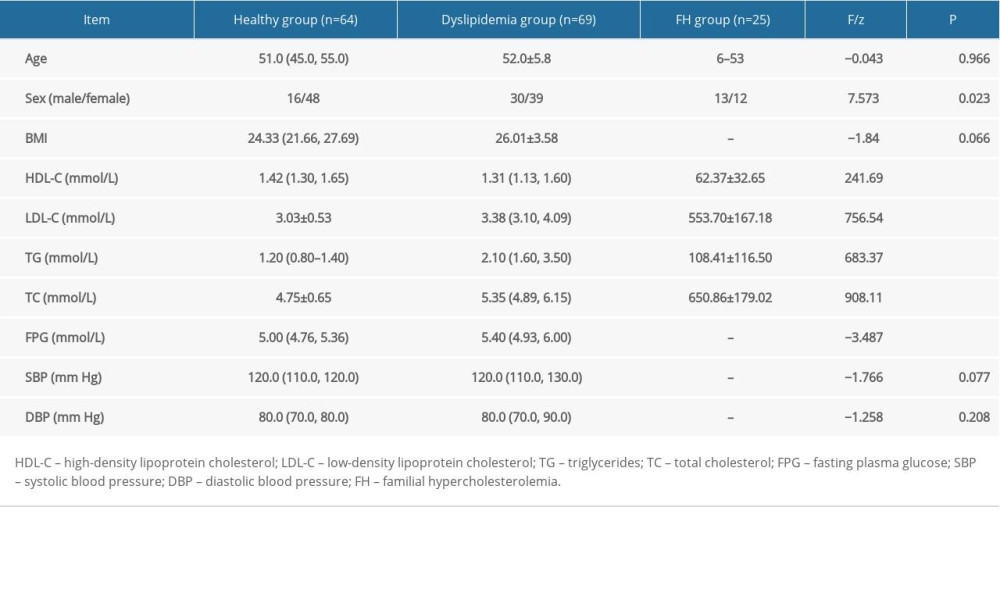 Table 2. Concentration and ratio of cholesterol synthesis and absorption markers to cholesterol in healthy group and dyslipidemia and familial hypercholesterolemia groups.
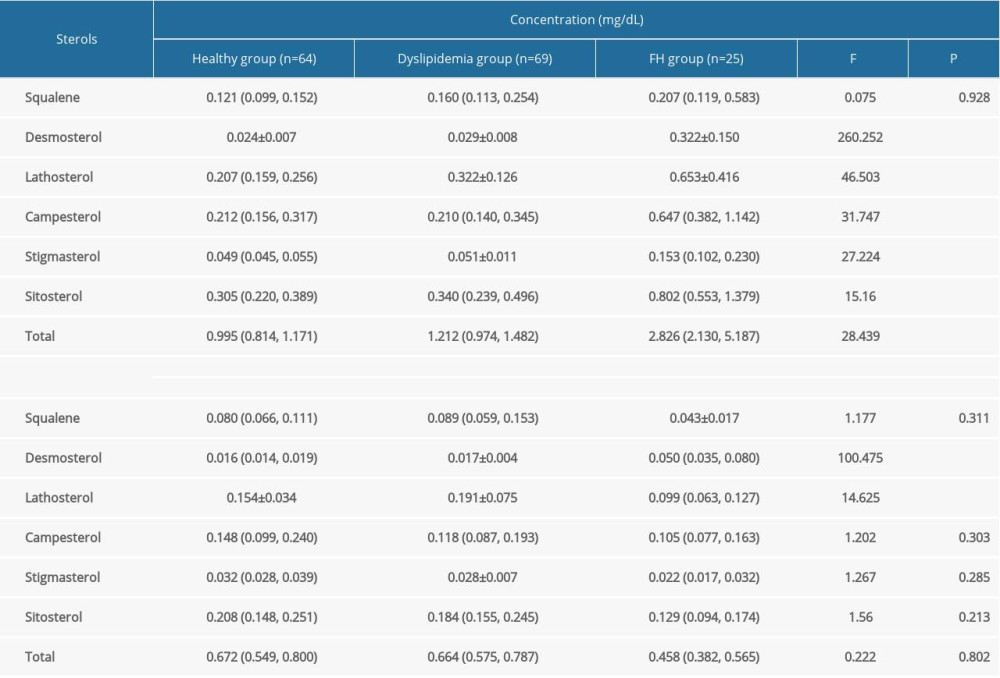 Table 3. Results of multifactorial regression analysis.
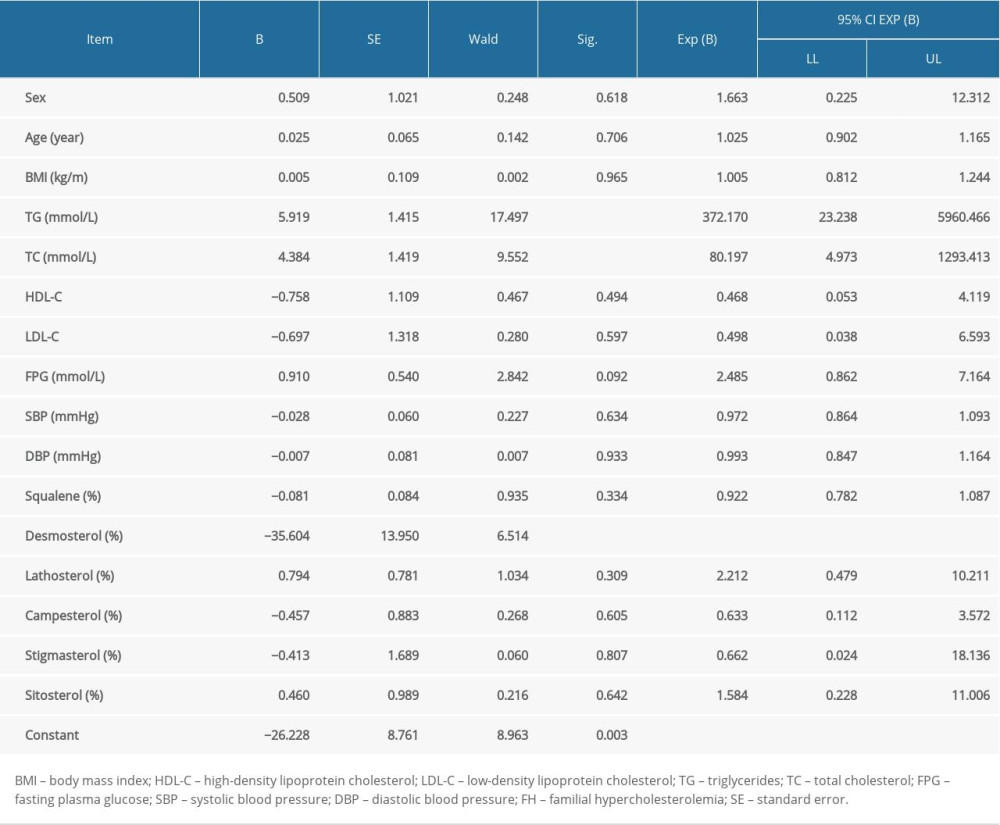 Table 4. Results of receiver operating characteristic curve for healthy group (n=64) and dyslipidemia group (n=69).
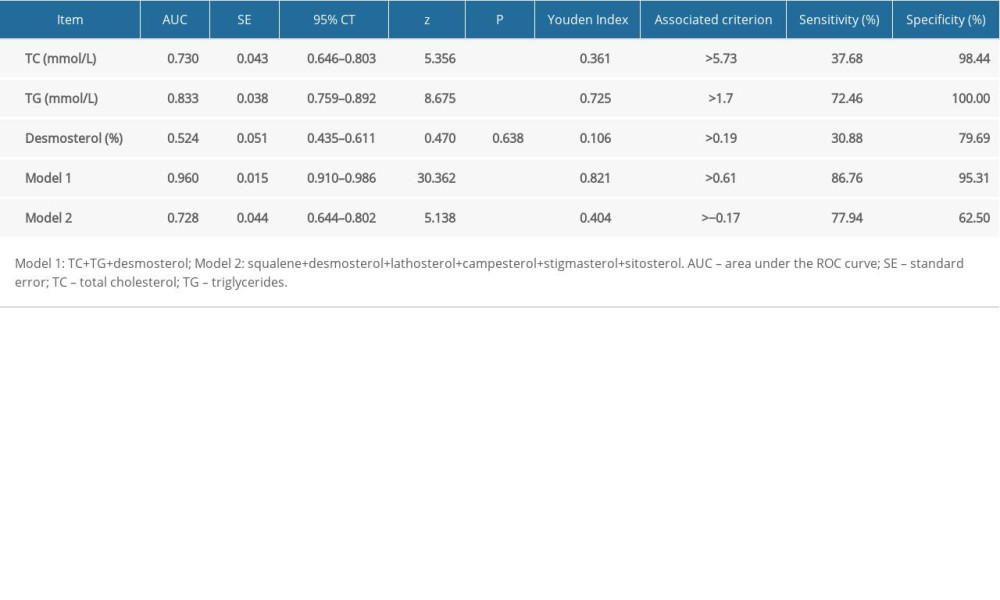 Table 5. Results of receiver operating characteristic curve for dyslipidemia group (n=69) and familial hypercholesterolemia group (n=25).
References
1. Mensah GA, Brown DW, An overview of cardiovascular disease burden in the United States: Health Affairs, 2007; 26(1); 38-48
2. Gojkovic T, Vladimirov S, Spasojevic-Kalimanovska V, Can non-cholesterol sterols and lipoprotein subclasses distribution predict different patterns of cholesterol metabolism and statin therapy response?: Clin Chem Lab Med, 2017; 55(3); 447-57
3. Matthan NR, Pencina M, LaRocque JM, Alterations in cholesterol absorption/synthesis markers characterize Framingham offspring study participants with CHD: J Lipid Res, 2009; 50(9); 1927-35
4. , Randomised trial of cholesterol lowering in 4444 patients with coronary heart disease: The Scandinavian Simvastatin Survival Study (4S): Lancet, 1994; 344(8934); 1383-89
5. Wang QH, Yang L, Zhagn JHSimultaneous determination of squalene and five non-cholesterol steroids in human serum by gas chromatography: Modern Biomedical Advances, 2009; 9(4); 721-25 [in Chinese]
6. Zhao W, Ye P, Hu DY, Zhao SP, Re-analysis of DYSIS-China cross-sectional survey according to “Chinese guidelines for the prevention and treatment of dyslipidemia in adults (2016 revision)”: Chin J Cardiovasc Med, 2020; 25(1); 55-61
7. Peng DQ, Zhao SPCurrent status and progress in the treatment of familial hypercholesterolemia in China: Chinese Circulation Journal, 2020; 35(4); 411-16 [in Chinese]
8. Handelsman Y, Jellinger PS, Guerin CK, Consensus statement by the American Association of Clinical Endocrinologists and American College of Endocrinology on the management of dyslipidemia and prevention of cardiovascular disease algorithm – 2020 executive summary: Endocr Pract, 2020; 26(10); 1196-224
9. Assmann G, Kannenberg F, Ramey DR, Effects of ezetimibe, simvastatin, atorvastatin, and ezetimibe-statin therapies on non-cholesterol sterols in patients with primary hypercholesterolemia: Curr Med Res Opin, 2008; 24(1); 249-59
10. Zhu JD, Mi MT, Research progress of phytosterols in lowering blood cholesterol: Chongqing Medical Journal, 2006(019); 1798-800 [in Chinese]
11. Lu JX, Zheng ZG, Xu ZMAdvances in research on hypolipidemic mechanism of phytosterols: Zhongguo Zhong Yao Za Zhi, 2019; 44(21); 4552-59 [in Chinese]
12. Baila-Rueda L, Mateo-Gallego R, Perez-Calahorra S, Effect of different fat-enriched meats on non-cholesterol sterols and oxysterols as markers of cholesterol metabolism: Results of a randomized and cross-over clinical trial: Nutr Metab Cardiovasc Dis, 2015; 25(9); 853-59
13. Hamilton JJ, Synnes A, Innis SM, Plasma cholesterol and lathosterol levels in term infants in the early neonatal period: Pediatr Res, 1992; 31(4 Pt 1); 396-400
14. Nissinen MJ, Gylling H, Miettinen TA, Effects of dietary cholesterol and fat on serum non-cholesterol sterols according to different apolipoprotein E subgroups among healthy men: Br J Nutr, 2008; 100(2); 373-79
15. Gylling H, Miettinen TA, Inheritance of cholesterol metabolism of probands with high or low cholesterol absorption: J Lipid Res, 2002; 43(9); 1472-76
16. Meng H, Matthan NR, Angellotti E, Pittas AG, Lichtenstein AH, Exploring the effect of vitamin D3 supplementation on surrogate biomarkers of cholesterol absorption and endogenous synthesis in patients with type 2 diabetes – randomized controlled trial: Am J Clin Nutr, 2020; 112(3); 538-47
17. Simonen P, Gylling H, Miettinen TA, The validity of serum squalene and non-cholesterol sterols as surrogate markers of cholesterol synthesis and absorption in type 2 diabetes: Atherosclerosis, 2008; 197(2); 883-88
18. Gylling H, Hallikainen M, Kolehmainen M, Cholesterol synthesis prevails over absorption in metabolic syndrome: Transl Res, 2007; 149(6); 310-16
19. Semova I, Levenson AE, Krawczyk J, Markers of cholesterol synthesis are elevated in adolescents and young adults with type 2 diabetes: Pediatr Diabetes Nov, 2020; 21(7); 1126-31
20. Gylling H, Laaksonen DE, Atalay M, Markers of absorption and synthesis of cholesterol in men with type 1 diabetes: Diabetes Metab Res Rev, 2007; 23(5); 372-77
21. Ketomäki A, Gylling H, Siimes MA, Squalene and noncholesterol sterols in serum and lipoproteins of children with and without familial hypercholesterolemia: Pediatr Res, 2003; 53(4); 648-53
22. Baila-Rueda L, Cenarro A, Lamiquiz-Moneo I, Cholesterol oversynthesis markers define familial combined hyperlipidemia versus other genetic hypercholesterolemias independently of body weight: J Nutr Biochem, 2018; 53; 48-57
23. Zhu B, Zhou AR, Biochemistry: Chin J Biochem Mol Biol, 2001; 2
24. Mashnafi S, Plat J, Mensink RP, Baumgartner S, Non-cholesterol sterol concentrations as biomarkers for cholesterol absorption and synthesis in different metabolic disorders: A systematic review: Nutrients, 2019; 11(1); 124
25. Miettinen TA, Gylling H, Viikari J, Synthesis and absorption of cholesterol in Finnish boys by serum non-cholesterol sterols: The cardiovascular risk in Young Finns Study: Atherosclerosis, 2008; 200(1); 177-83
26. Miettinen T, Vanhanen H, Ojala J-P, Tikkanen M, Non-cholesterol sterols and faecal elimination of cholesterol during statin and fibrate treatment: Atherosclerosis, 1992; 97; S73-80
27. Gylling H, Rajaratnam RA, Vartiainen E, Changes in serum level and metabolism of cholesterol with plant stanol esters in postmenopausal women with and without coronary artery disease: Menopause, 2006; 13(2); 286-93
28. Miettinen TA, Gylling H, Cholesterol absorption efficiency and sterol metabolism in obesity: Atherosclerosis, 2000; 153(1); 241-48
29. Simonen PP, Gylling HK, Miettinen TA, Diabetes contributes to cholesterol metabolism regardless of obesity: Diabetes Care, 2002; 25(9); 1511-15
30. Simonen PP, Gylling H, Miettinen TA, Body weight modulates cholesterol metabolism in non-insulin dependent type 2 diabetics: Obes Res, 2002; 10(5); 328-35
31. Miettinen TA, Gylling H, Effect of statins on noncholesterol sterol levels: Implications for use of plant stanols and sterols: Am J Cardiol, 2005; 96(1); 40-46
32. Miettinen TA, Tilvis RS, Kesäniemi YA, Serum plant sterols and cholesterol precursors reflect cholesterol absorption and synthesis in volunteers of a randomly selected male population: Am J Epidemiol, 1990; 131(1); 20-31
33. Nunes VS, Bensenor IM, Lotufo PA, The coronary artery calcium score is linked to plasma cholesterol synthesis and absorption markers: Brazilian Longitudinal Study of Adult Health: Biosci Rep, 2020; 40(7); BSR20201094
Figures
 Figure 1. Correlation of cholesterol absorption factors and synthesis factors in the 3 groups(A–E) Health group; (F–J) hyperlipidemia group; (K–N) familial hypercholesterolemia group. (A) campesterol (%) vs sitosterol (%); (B) campesterol (%) vs lathosterol (%); (C) desmosterol (%) vs Lathosterol (%); (D) desmosterol (%) vs squalene (%); (E) lathosterol (%) vs sitosterol (%). (F) lathosterol (%) vs desmosterol (%); (G) lathosterol (%) vs campesterol (%); (H) lathosterol (%) vs sitosterol (%); (I) desmosterol (%) vs campesterol (%); (J) campesterol (%) vs sitosterol (%); (K) lathosterol (%) vs desmosterol (%); (L) campesterol (%) vs sitosterol (%); (M) campesterol (%) vs stigmasterol (%); (N) stigmasterol (%) vs sitosterol (%).
 Figure 2. Receiver operating characteristic curve comparing the dyslipidemia group and healthy groupModel 1: total cholesterol + triglycerides + desmosterol (%); Model 2: squalene (%) + desmosterol (%) + lathosterol (%) + campesterol (%) + stigmasterol (%) + sitosterol (%).
 Figure 3. Receiver operating characteristic curve comparing familial hypercholesterolemia group and dyslipidemia group.
 Tables
 Table 1. Levels of high-density lipoprotein cholesterol, low-density lipoprotein cholesterol, triglycerides, total cholesterol, and fasting plasma glucose and blood pressure in healthy group and dyslipidemia and familial hypercholesterolemia groups.
 Table 2. Concentration and ratio of cholesterol synthesis and absorption markers to cholesterol in healthy group and dyslipidemia and familial hypercholesterolemia groups.
 Table 3. Results of multifactorial regression analysis.
 Table 4. Results of receiver operating characteristic curve for healthy group (n=64) and dyslipidemia group (n=69).
 Table 5. Results of receiver operating characteristic curve for dyslipidemia group (n=69) and familial hypercholesterolemia group (n=25).
 Table 1. Levels of high-density lipoprotein cholesterol, low-density lipoprotein cholesterol, triglycerides, total cholesterol, and fasting plasma glucose and blood pressure in healthy group and dyslipidemia and familial hypercholesterolemia groups.
 Table 2. Concentration and ratio of cholesterol synthesis and absorption markers to cholesterol in healthy group and dyslipidemia and familial hypercholesterolemia groups.
 Table 3. Results of multifactorial regression analysis.
 Table 4. Results of receiver operating characteristic curve for healthy group (n=64) and dyslipidemia group (n=69).
 Table 5. Results of receiver operating characteristic curve for dyslipidemia group (n=69) and familial hypercholesterolemia group (n=25).
 In Press
07 Mar 2024 : Clinical Research
Knowledge of and Attitudes Toward Clinical Trials: A Questionnaire-Based Study of 179 Male Third- and Fourt...Med Sci Monit In Press; DOI: 10.12659/MSM.943468
08 Mar 2024 : Animal Research
Modification of Experimental Model of Necrotizing Enterocolitis (NEC) in Rat Pups by Single Exposure to Hyp...Med Sci Monit In Press; DOI: 10.12659/MSM.943443
18 Apr 2024 : Clinical Research
Comparative Analysis of Open and Closed Sphincterotomy for the Treatment of Chronic Anal Fissure: Safety an...Med Sci Monit In Press; DOI: 10.12659/MSM.944127
08 Mar 2024 : Laboratory Research
Evaluation of Retentive Strength of 50 Endodontically-Treated Single-Rooted Mandibular Second Premolars Res...Med Sci Monit In Press; DOI: 10.12659/MSM.944110
Most Viewed Current Articles
17 Jan 2024 : Review article
Vaccination Guidelines for Pregnant Women: Addressing COVID-19 and the Omicron VariantDOI :10.12659/MSM.942799
Med Sci Monit 2024; 30:e942799
14 Dec 2022 : Clinical Research
Prevalence and Variability of Allergen-Specific Immunoglobulin E in Patients with Elevated Tryptase LevelsDOI :10.12659/MSM.937990
Med Sci Monit 2022; 28:e937990
16 May 2023 : Clinical Research
Electrophysiological Testing for an Auditory Processing Disorder and Reading Performance in 54 School Stude...DOI :10.12659/MSM.940387
Med Sci Monit 2023; 29:e940387
01 Jan 2022 : Editorial
Editorial: Current Status of Oral Antiviral Drug Treatments for SARS-CoV-2 Infection in Non-Hospitalized Pa...DOI :10.12659/MSM.935952
Med Sci Monit 2022; 28:e935952


