26 January 2024: Lab/In Vitro Research
CTRP13 Mitigates Endothelial Cell Ferroptosis via the AMPK/KLF4 Pathway: Implications for Atherosclerosis Protection
Jie Du123ABCDEF, Jianjun Wu12ABC, Youqi Zhang12CDF, Qi Liu12CDF, Xing Luo12ABD, Xingtao Huang12ABC, Xuedong Wang12ABC, Fan Yang12AEF, JingBo Hou12ABCDEFG*DOI: 10.12659/MSM.942733
Med Sci Monit 2024; 30:e942733


Abstract
BACKGROUND: C1q/tumor necrosis factor-related protein 13 (CTRP13) preserves endothelial function and possesses anti-oxidation activity. However, its effects on ferroptosis of human umbilical vein endothelial cells (HUVECs) remain unclear. We investigated the effects of CTRP13 on HUVEC ferroptosis induced by oxidized low-density lipoprotein (ox-LDL) and explored the underlying mechanisms of CTRP13 against ferroptosis via the AMPK/KLF4 pathway.
MATERIAL AND METHODS: Cell Counting Kit-8 assay was used to evaluate cell viability. Lactate dehydrogenase activity and malondialdehyde content analysis were performed to evaluate the cell membrane integrity and lipid peroxidation. Mito-Tracker, JC-1, and 2’,7’-dichlorofluorescein di-acetate were used to evaluate the biological activity of mitochondria, mitochondrial membrane potential, and reactive oxygen species (ROS) in endothelial cells. The ferroptosis indicator expressions, recombinant solute carrier family 7, member 11, glutathione peroxidase 4 (GPX4), and acyl-CoA synthetase long-chain family member 4 were examined using real-time reverse transcription-polymerase chain reaction and Western blot. Immunofluorescence staining detected GPX4 location in endothelial cells.
RESULTS: The results demonstrate that CTRP13 (450 ng/mL) prevented HUVEC ferroptosis by inhibiting ROS overproduction and mitochondrial dysfunction, and CTRP13 accelerated antioxidant enzyme expression levels, such as heme oxygenase 1, superoxide dismutase 1, and superoxide dismutase 2, compared with the ox-LDL (100 µg/mL) group for 48 h. Additionally, CTRP13 treatment increased p-AMPK/AMPK expression by 47.65% (P<0.05) while decreasing Krüppel-like factor 4 expression by 37.43% (P<0.05) in ox-LDL-induced HUVECs and elucidated the protective effect on endothelial dysfunction from ferroptosis.
CONCLUSIONS: These findings provide new insights for understanding the effects and mechanism of CTRP13 on preventing endothelial cell ferroptosis.
Keywords: atherosclerosis, KLF4 Protein, Human, endothelial cells, Ferroptosis, C1QL3 Protein, Human
Background
Atherosclerosis cardiovascular disease has become a global public health concern because it causes the death of more people than all cancers combined and is one of the leading causes of morbidity and mortality worldwide [1]. Atherosclerosis characteristics include lipid substance accumulation, pro-inflammatory response in macrophages, endothelial cell injury, and arterial wall sclerosis. Recent evidence demonstrates that atherosclerosis begins long before clinical manifestations, with onsets that can be traced back to adolescence or early adulthood [2]. New anti-atherosclerosis agents are required to supplement our current arsenal of anti-atherosclerosis drugs and provide therapeutic options for all patients at high risk for atherosclerosis.
The mechanism of atherosclerosis remains to be established. Some scholars believe hyperlipidemia and inflammation-induced endothelial dysfunction are crucial initiating factors and key links to atherosclerosis development. Extensive research has demonstrated that endothelial dysfunction is a common feature of atherosclerosis. Endothelial dysfunction results from increased oxidative stress and nitric oxide (NO) reduction [3–5]. Ferroptosis is a new type of regulatory cell death characterized primarily by lipid peroxidation and iron dependence but lacks the typical apoptosis and necrosis manifestations [6]. Ferroptosis participates in various pathological processes, including cancers, atherosclerosis, and cardiomyopathy. Our previous studies revealed that high glucose or oxidized low-density lipoprotein (ox-LDL) stimulation reduces endothelial NO synthase (eNOS)/NO bioavailability and inhibits the AMP-activated kinase (AMPK) pathway in cardiomyocytes and human umbilical vein endothelial cells (HUVECs) [7,8]. However, little is known about how ferroptosis impacts HUVECs, particularly under ox-LDL conditions.
In contrast to other cell death pathways, ferroptosis has shrunken mitochondria, increased membrane density, and decreased or disappeared mitochondrial ridges. Ferroptosis is a non-apoptotic cell death characterized by an imbalance of iron metabolism and lipid peroxidation [9]. Recent evidence suggests elevated extracellular glutamate levels present in atherosclerosis-inhibited system xc transportation (xCT), triggering ferroptosis [10]. Abundant experimental data support that ferroptosis inhibition can attenuate lipid peroxidation and endothelial dysfunction in endothelial cells. Lv et al indicated that treating HUVECs with ox-LDL or the ferroptosis inducer erastin and estradiol inhibited iron death in HUVECs by activating the NRF2/glutathione peroxidase 4 (GPX4) pathway [11]. Liu et al found that HUVECs phagocytized large qualities of γ-Fe2O3 and Fe3O4 nanoparticles, increasing intracellular iron levels. They further observed the disrupted cystine/glutamate reverse transporter and GPX4 signaling in γ-Fe2O3 and Fe3O4 nanoparticle-challenged HUVECs. The γ-Fe2O3 and Fe3O4 nanoparticles could also cause mitochondrial fusion and fission dysregulation and activate lipid peroxidation and iron metabolism-related genes in a P53-dependent manner [12]. Bai et al demonstrated that ferroptosis inhibition alleviates atherosclerosis by attenuating lipid peroxidation and endothelial dysfunction in mouse aortic endothelial cells [13]. Vascular endothelial cells play an essential role, forming the barrier between blood and tissues, regulating blood vessel function, and maintaining a stable internal environment [14]. Oxidative stress and mitochondrial dysfunction can cause endothelial dysfunction in the initial atherosclerosis stage. Moreover, iron overload causes endothelial dysfunction by aggravating the abnormal mitochondria structure and oxidation reaction in endothelial cells [13]. Whether ferroptosis is related to endothelial dysfunction is an interesting remaining question. Hence, in this study, we investigated the regulatory mechanism and important role of ferroptosis on endothelial dysfunction.
C1q/tumor necrosis factor-related protein 13 (CTRP13), an adipokine secreted by adipocytes, has many systemic effects and important roles in developing atherosclerosis and cardiovascular diseases. CTRP13 has a restored mitochondrial calcium ion balance, lowering reactive oxygen species (ROS) production [15]. Recent studies have discovered that CTRP13 significantly recovered NO production and eNOS coupling in the aortae of diabetic mice and high glucose-treated HUVECs. These findings showed that CTRP13 treatment reversed the downregulation of GCH1 and the ratio of eNOS dimers to monomers in the renal arteries of patients with diabetes [4]. Soudabeh et al demonstrated that lower circulating levels of CTRP13 increased the risk of coronary artery disease and type 2 diabetes mellitus [16]. To the best of our knowledge, the molecular mechanism and pharmacological action of CTRP13 in endothelial cell ferroptosis remains uninvestigated.
Krüppel-like factor 4 (KLF4) is a zinc finger-containing transcription factor, the expression of which is connected with growth arrest. KLF4 participates in the regulation of processes including cell proliferation, differentiation, invasion, and migration [17,18]. Studies have shown that the knockdown of KLF4 by siRNA enhances the proliferation inhibitory effect of Polyphyllin III by promoting ferroptosis in breast cancer [19]. However, it remains unknown whether KLF4 mediates endothelial cell ferroptosis. AMPK is a serine/threonine kinase [20,21]. Accumulating evidence indicates that AMPK acts as an important regulator in the pathogenesis of cardiovascular diseases [22,23]. Kurabayashiet et al indicated that dysregulation of Elovl6-driven long-chain fatty acid metabolism induces phenotypic switching of vascular smooth muscle cells via ROS production and AMPK/KLF4 signaling, which leads to growth arrest and downregulation of vascular smooth muscle cell marker expression [24].
This study aimed to investigate the effects of CTRP13 on HUVECs ferroptosis induced by ox-LDL and to explore the underlying mechanisms of CTRP13 against ferroptosis via activating the AMPK/KLF4 pathway.
Material and Methods
CELL CULTURE AND TREATMENT:
HUVECs were obtained from Science Cell Research Laboratories (Carlsbad, CA, USA), and the purity of HUVECs was more than 89.67%, which was confirmed by immunofluorescence identification (iCell Bioscience Inc, Shanghai, China). Cells were cultured in Dulbecco’s modified Eagle medium (DMEM) supplemented with 10% fetal bovine serum (Gibco, Life Technologies, Waltham, MA, USA), 100 U/mL penicillin, and 0.1 mg/mL streptomycin (Gibco, Grand Island, NY, USA). The cells were cultured in an incubator under 5% CO2 at 37°C, and the culture medium was exchanged every 2 days. The cells within 7 passages were used for in vitro study. The cells were treated with trypsin (Beyotime Biotechnology, Shanghai, China) and seeded in plates for reagent intervention. Ox-LDL (YB-002) was obtained from Yiyuan Biotechnology, Guangzhou, China. HUVECs were cultured in DMEM containing ox-LDL (0–200 μg/mL) for ox-LDL treatment for 24 or 48 h [25].
CHEMICALS AND REAGENTS:
CTPR13 (purity >99.37%) was purchased from R&D Systems (9115-TN) and reconstituted at 500 μg/mL in water. Ferrostatin-1 (Fer-1) was purchased from Sigma (SML0583), and a 5-mmol/L stock solution was prepared in dimethyl sulfoxide (Sigma, St. Louis, MO). APTO (HY-16291, MedChem Express) was used as an inducer of KLF4. Primary antibodies against GPX4, recombinant solute carrier family 7, member 11 (SLC7A11), acyl-CoA synthetase long-chain family member 4 (ACSL4), heme oxygenase 1 (HO-1), and KLF4 were obtained from Abcam (Cambridge, MA, USA). Primary antibodies against phosphor-specific anti-AMPK (Thr172), AMPK, superoxide dismutase 1 (SOD-1), and SOD-2 were obtained from Cell Signaling Technology (Danvers, MA, USA; 1: 1000 dilution). β-actin, Goat anti-Rabbit IgG, and HRP Goat anti-Mouse IgG were provided by ZSGB-BIO (Beijing, China). Biological reagents, such as JC-1, Mito-Tracker Red, and 2′,7′-dichlorofluorescein di-acetate (DCFH-DA), were obtained from Beyotime Biotechnology, China. Nucleic acid sequences were obtained from Integrated DNA Technologies (Genewiz, IA, USA).
REVERSE TRANSCRIPTION-QUANTITATIVE POLYMERASE CHAIN REACTION:
Total cellular RNA was extracted using TRIzol reagent (Invitrogen, CA, USA). Real-time reverse transcription-polymerase chain reaction (RT-PCR) was performed using the SYBR Premix reagent (cat# 1725125, BIO-RAD) and ABI Fast 7500 Real-time PCR System (Applied Biosystems, South San Francisco, CA). The 2(−ΔΔCt) method was used to calculate relative fold changes with GAPDH as the internal control. Primers for real-time RT-PCR are listed in Table 1.
CELL COUNTING KIT-8 ASSAY:
Cell Counting Kit-8
TRANSMISSION ELECTRON MICROSCOPY:
HUVECs were seeded in 6-well plates. After treatment, the cells were digested with trypsin and re-suspended in phosphate-buffered saline (PBS) twice. The samples were obtained by centrifuging at 3000 rpm. The supernatant was removed and fixed with 2.5% glutaraldehyde overnight at 4°C. Finally, the mitochondria ultrastructure was observed using transmission electron microscopy.
HOECHST/PROPIDIUM IODIDE STAINING:
Hoechst/propidium iodide
MEASUREMENT OF LACTATE DEHYDROGENASE ACTIVITY:
The culture supernatant was obtained after centrifugation and assayed for lactate dehydrogenase (LDH) activity (Beyotime, Shanghai, China, C0017). Then, 120 μL of supernatant from each well was added to the corresponding well of a new 96-well plate. The absorbance was measured at 490 nm.
IRON CONTENT ASSAY:
Intracellular iron ion levels were examined using an iron assay kit (TC1015, Leagene, Beijing, China) according to the manufacturer’s instructions. Briefly, the supernatant was centrifuged at a low speed, mixed, and incubated at 37°C for 10 min. Then, the absorbance was measured at 562 nm.
MEASUREMENT OF INTRACELLULAR OXIDATIVE STRESS LEVELS:
Total ROS production was detected using the fluorescence probe DCFH-DA (S0033S, Beyotime, Shanghai, China) according to the manufacturer’s instructions. DCFH-DA was diluted in serum-free medium at 1: 1000 to a final concentration of 10 mM and incubated in the cells at 37°C for 20 min. Then, the absorbance was measured at 488 and 525 nm. A commercially available malondialdehyde (MDA) assay kit (Beyotime Institute of Biotechnology) was used to measure lipid peroxidation parameters by detecting MDA content, following the instructions for when cells undergo oxidative stress. The γ-glutamyl-cysteinyl-glycine (GSH) level was measured according to the manufacturer’s instructions (Beyotime, China).
IMMUNOFLUORESCENCE:
The HUVECs were fixed with 4% paraformaldehyde for 15 min and blocked with 5% bovine serum albumin for 30 min. Then, the cells were incubated overnight at 4°C with anti-GPX4 antibody (1: 200; Abcam; Cambridge, MA, USA), followed by incubation with horseradish peroxidase (HRP)-conjugated secondary antibody (Amresco) for 1 h at room temperature in the dark. The nuclei were stained with 4′,6-diamidino-2-phenylindole (DAPI) for 5 min. Subsequently, the stained cells were observed and photographed using a fluorescence microscope (Olympus, Japan).
MITOCHONDRIAL MEMBRANE POTENTIAL ASSAY:
Mito-Tracker staining (C1049B, Beyotime Institute of Biotechnology) specifically labeled mitochondria within live cells utilizing the mitochondrial membrane potential. JC-1 (C2003S, Beyotime Institute of Biotechnology), whose emission of red and green fluorescence relies on mitochondrial membrane potential, was an ideal fluorescence probe to detect mitochondrial membrane potential. After cell washing, JC-1 staining solution was added, thoroughly mixed, and incubated at 37°C for 20 min, and then stained cells were observed and photographed using a fluorescence microscope.
WESTERN BLOTTING:
After different treatments, the HUVECs were washed twice with cold PBS. Total cellular proteins were extracted using radioimmunoprecipitation assay buffer (RIPA) buffer. Protein concentrations were determined using a bicinchoninic acid protein assay kit (Beyotime Institute of Biotechnology). Equal amounts of proteins were separated using 10% sodium dodecyl sulfate-polyacrylamide gel electrophoresis (SDS-PAGE). The separated proteins were transferred onto polyvinylidene difluoride membranes (Millipore, Billerica, MA, USA). Then, the membranes were blocked with 5% skimmed milk in TBST at room temperature for 1 h. The blots were incubated at 4°C overnight with the following primary antibodies from Abcam: anti-GPX4 (1: 5000), anti-SLC7A11 (1: 1000), anti-ACSL4 (1: 10000), anti-HO-1 (1: 2000), anti-KLF4 (1: 1000), and anti-β-actin (1: 1000), and with the following primary antibodies from Cell Signaling Technology: anti-p-AMPK (1: 1000), anti-AMPK (1: 1000), anti-SOD-1(1: 1000), and anti-SOD-2 (1: 1000). Then, the blots were incubated with HRP-conjugated secondary antibodies (1: 5000) for 1 h at room temperature. Subsequently, blots were developed using enhanced chemiluminescence (Model 6600; Tanon, Shanghai, China).
STATISTICAL ANALYSIS:
The data were analyzed using GraphPad Prism version 7.0 (GraphPad Software Inc. San Diego, CA, USA). Differences between 2 groups were analyzed using the
Results
OX-LDL INDUCED HUVECS FERROPTOSIS IN A DOSE-DEPENDENT MANNER:
We used ox-LDL (0–200 μg/mL) for 24 or 48 h to induce endothelial cell ferroptosis and to explore the effect of ox-LDL on HUVECs. The CCK8 results showed that treatment with ox-LDL in a dose- and time-dependent manner markedly reduced the cell viability in HUVECs (Figure 1A, 1B). Hoechst/PI staining was used to evaluate the integrity of the cellular membrane. The results indicated that the number of PI-positive cells was higher in the ox-LDL group (100 μg/mL) for 48 h than in the control group (Figure 1C). HUVEC mitochondria of the ox-LDL-induced group (100 μg/mL) for 48 h showed morphological characteristics of ferroptosis, such as shrinkage, membrane density increasing, and mitochondrial ridges decreasing or disappearing (Figure 1D). These results indicated that the cellular viability of HUVECs was significantly decreased following treatment with 100 μg/mL ox-LDL at 48 h. Our results revealed that the ferroptosis protein ACSL4 expression level was increased after ox-LDL stimulation, compared with the control (Figure 1E, 1F). Meanwhile, GPX4 and SLC7A11 expressions were reduced in the ox-LDL group (Figure 1G, 1H). These results suggested that ox-LDL induced HUVECs ferroptosis.
CTRP13 SUPPRESSED OX-LDL-INDUCED HUVEC FERROPTOSIS:
We treated HUVECs with different CTRP13 concentrations for 48 h to further confirm whether CTRP13 was involved in ferroptosis responses. CTRP13 had no significant toxic effect on HUVECs at concentrations below 1200 ng/mL, compared with the control group (Figure 2A). HUVECs had approximately 45% viability at 1200 ng/mL after being cultured with 100 μg/mL ox-LDL (Figure 2B). Viability at 150, 300, and 450 ng/mL CTRP13 was consistent with a previous report [26]. Then, we treated HUVECs with 100 μg/mL ox-LDL at indicated time points. The results revealed that 450 ng/mL CTRP13 unregulated GPX4/SLC7A11 protein and mRNA levels, compared with an ox-LDL group (Figure 2C–F, 2H, 2I). Conversely, CTRP13 treatment of 450 ng/mL significantly blocked ACSL4 signal activity in the ox-LDL group (Figure 2G). The results indicated that 450 ng/mL CTRP13 significantly inhibited HUVEC ferroptosis.
CTRP13 INHIBITED OX-LDL-INDUCED HUVEC LIPID PEROXIDATION AND MITOCHONDRIAL DYSFUNCTION:
We detected LDH release in the supernatant to explore whether CTRP13 pre-treatment could ameliorate cellular membrane integrality. The results indicated that ox-LDL significantly increased LDH release, and CTRP13 attenuated this effect (Figure 3A). Moreover, CTRP13 treatment inhibited MDA and GSH (Figure 3B, 3C). The iron content was lower in the CTRP13 treatment group (Figure 3D) than in the ox-LDL group. ROS-mediated lipid peroxidation was the key step that induced ferroptosis. The CTRP13 and Fer-1 group significantly decreased ROS levels, compared with the ox-LDL group (Figure 3E, 3F). Also, we detected a dramatic improvement in mitochondrial membrane potential. The mito-tracker results reduced many mitochondrial membranes and fissions, compared with the control, while CTRP13 and Fer-1 alleviated this effect (Figure 3G, 3H).
CTRP13 REVERSED THE DOWNREGULATION OF MULTIFARIOUS ANTIOXIDANT PROTEINS:
CTRP13 accelerated antioxidant enzyme expression levels, such as HO-1, SOD-1, and SOD-2, compared with the ox-LDL group (Figure 4A–4E). Moreover, JC-1 staining revealed that adding CTRP13 restored mitochondrial membrane potential (Figure 4F, 4G). The immunofluorescence images indicated an extensive increase of GPX4 mean intensity in aggregates with CTRP13 and Fer-1, compared with the ox-LDL group (Figure 4H, 4I).
FERROPTOSIS PROTECTIVE EFFECT OF CTRP13 WAS ATTENUATED BY INHIBITING AMPK/KLF4 PATHWAY:
We examined the AMPK phosphorylation levels and KLF4 expression to elucidate the molecular ferroptosis mechanism induced by CTRP13. The p-AMPK/AMPK expression ratio decreased, and KLF4 expression increased in the HUVECs treated with ox-LDL (Figure 5A–5C). However, these changes were more pronounced in the HUVECs treated with ox-LDL or compound C (CC, 5 μmol/L), a potent and selective AMPK inhibitor. Ferroptosis biomarker proteins GPX4 and SLC7A11 expressions were decreased in the compound C group. In contrast, compound C groups had significantly increased ACSL4 and KLF4 levels, compared with the ox-LDL group. APTO (5 μmol/L), a KLF4 activator, did not affect AMPK phosphorylation, while APTO attenuated the anti-ferroptosis effect of CTRP13 (Figure 5D–5F).
CTRP13 RESTORED MITOCHONDRIAL FUNCTIONING BY COUNTERACTING AGAINST OX-LDL EFFECTS ON THE AMPK/KLF4 PATHWAY:
Next, we examined whether the AMPK/KLF4 pathway was responsible for the mitochondrial functioning of CTRP13 by inhibiting AMPK, the upstream activator of KLF4. DCFH and JC-1 staining indicated that compound C and APTO increased ROS and mitochondrial dysfunction (Figure 6A–6D). Expectedly, immunofluorescence staining revealed compound C and APTO diminished GPX4 expression (Figure 6E, 6F).
Hence, these results suggested that CTRP13 most likely protected ox-LDL-induced HUVEC ferroptosis by activating the AMPK/KLF4 pathway and upregulating various antioxidant enzymes (Figure 7).
Discussion
STUDY LIMITATIONS:
This study had potential limitations. First, using HUVECs instead of human aortic endothelial cells may be less reflective of actual aortic endothelial cell activity. Second, in vitro and in vivo experiments with endothelial cells are required for future studies to confirm the vascular protective effect of CTRP13 on ox-LDL-induced ferroptosis.
Conclusions
Our study showed that CTRP13 inhibited HUVEC ferroptosis induced by ox-LDL. CTRP13 depressed ROS production and decreased cell ferroptosis. We elucidated the molecular basis of the AMPK/KLF4-mediated induction of CTRP13 expression that inhibits ferroptosis. From a therapeutic perspective, these results provide a preliminary understanding of the pharmacological action of CTRP13 and can have important translational value in the treatment of endothelial dysfunction-accelerated atherosclerosis.
Figures
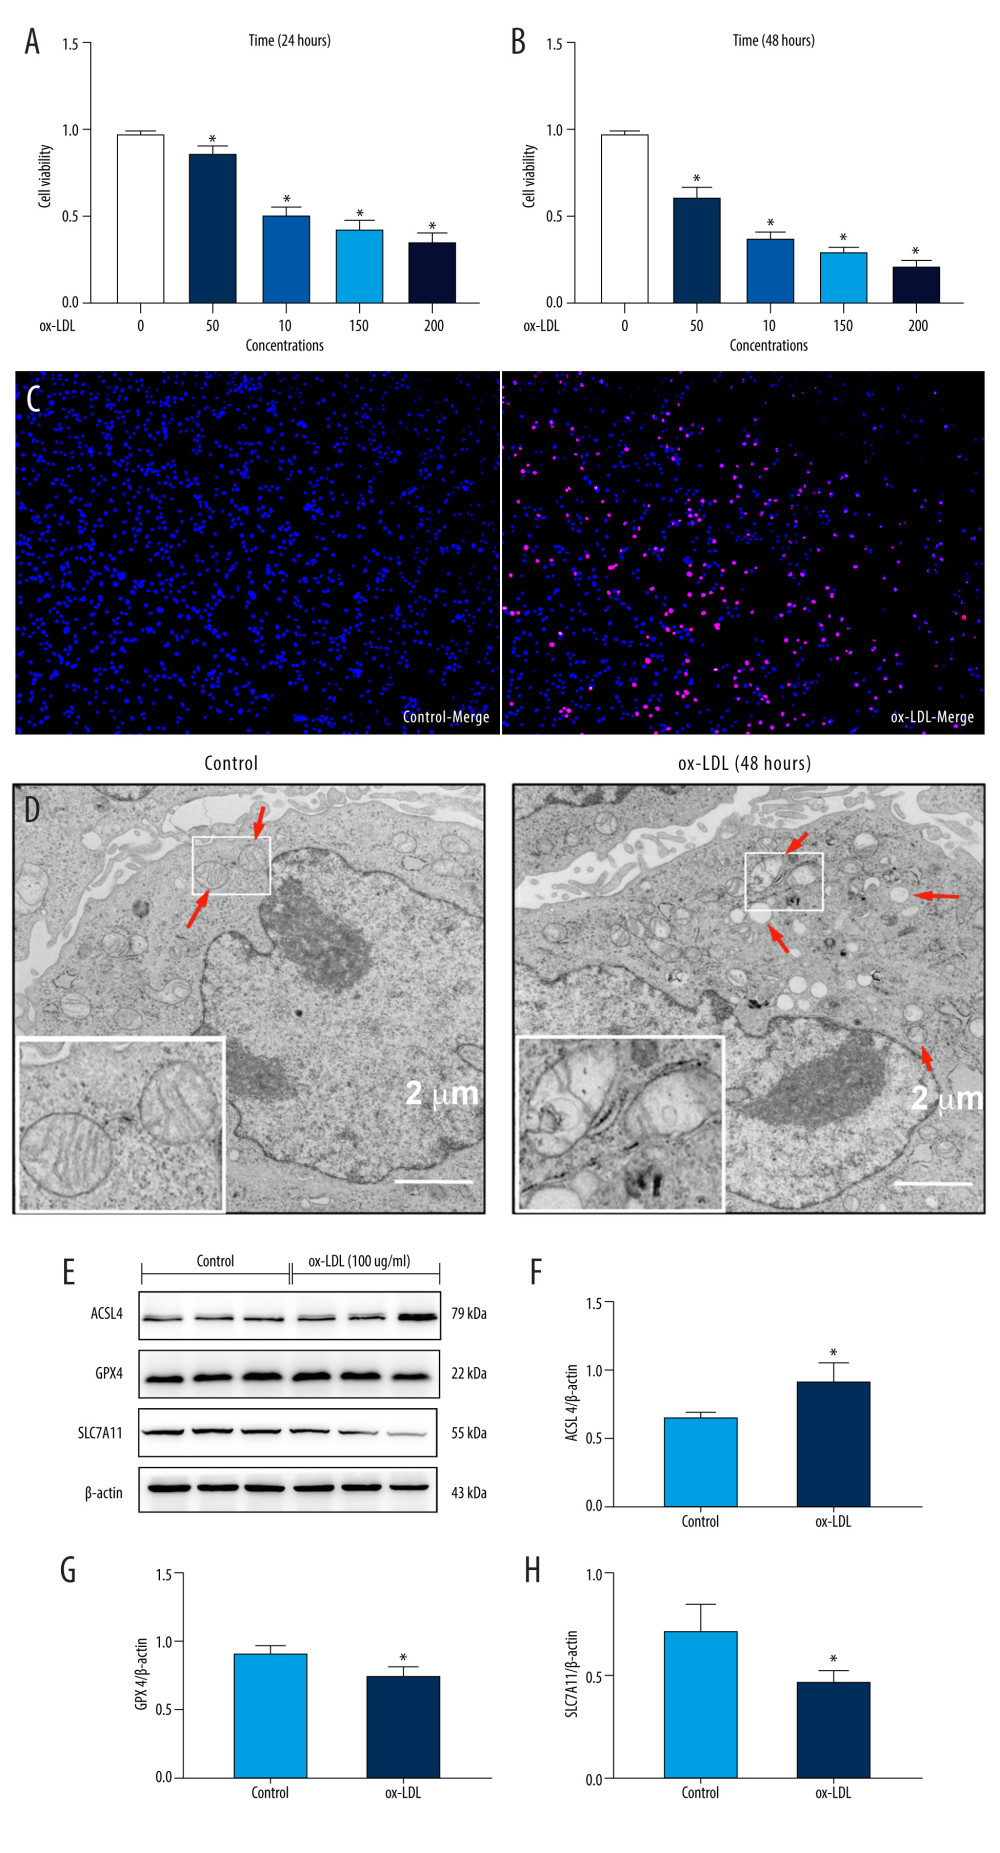 Figure 1. Oxidized low-density lipoprotein (ox-LDL) induced human umbilical vein endothelial cell (HUVEC) ferroptosis in a dose-dependent manner. (A, B) HUVEC metabolic activity was analyzed using Cell Counting Kit-8 (CCK-8) assay following treatment with ox-LDL (0–200 μg/mL; n=4). Statistical power=0.929356, effect size(r)=0.830181. (C) Hoechst/propidium iodide (PI) staining images were captured using fluorescence microscopy (Hoechst in blue, and PI in red; scale bars=100 μm). (D) The microscopic morphology of HUVECs under transmission electron microscope. (E) acyl-CoA synthetase long-chain family member 4 (ACSL4), glutathione peroxidase 4 (GPX4), and recombinant solute carrier family 7, member 11 (SLC7A11) protein expression levels were measured using Western blot analysis. (F–H) The results were normalized to controls, and histograms represent the relative intensities of ACSL4, GPX4, and SLC7A11. The data are expressed as the mean±SD (n=3–4 per group). Statistical power=0.913357, effect size(r)=0.804728. * P<0.05 vs the control group. # P<0.05 vs the ox-LDL group. Fluorescent images were evaluated using Olympus fluorescence microscopy with cellSens Dimension software (Version 1.3 rev, Olympus, Tokyo, Japan), and the positive cells was measured by Image Pro Plus 6.0 (Media Cybernetics, Rockville, MD, USA). Transmission electron microscopy (Talos L120C G2, FEI, Czech) was adopted to observe the morphology of HUVECs. The relative protein levels were quantified by Image J software (NIH, Bethesda, MD, USA). GraphPad Prism 9.0 software (La Jolla, USA) was used to analyze the data.
 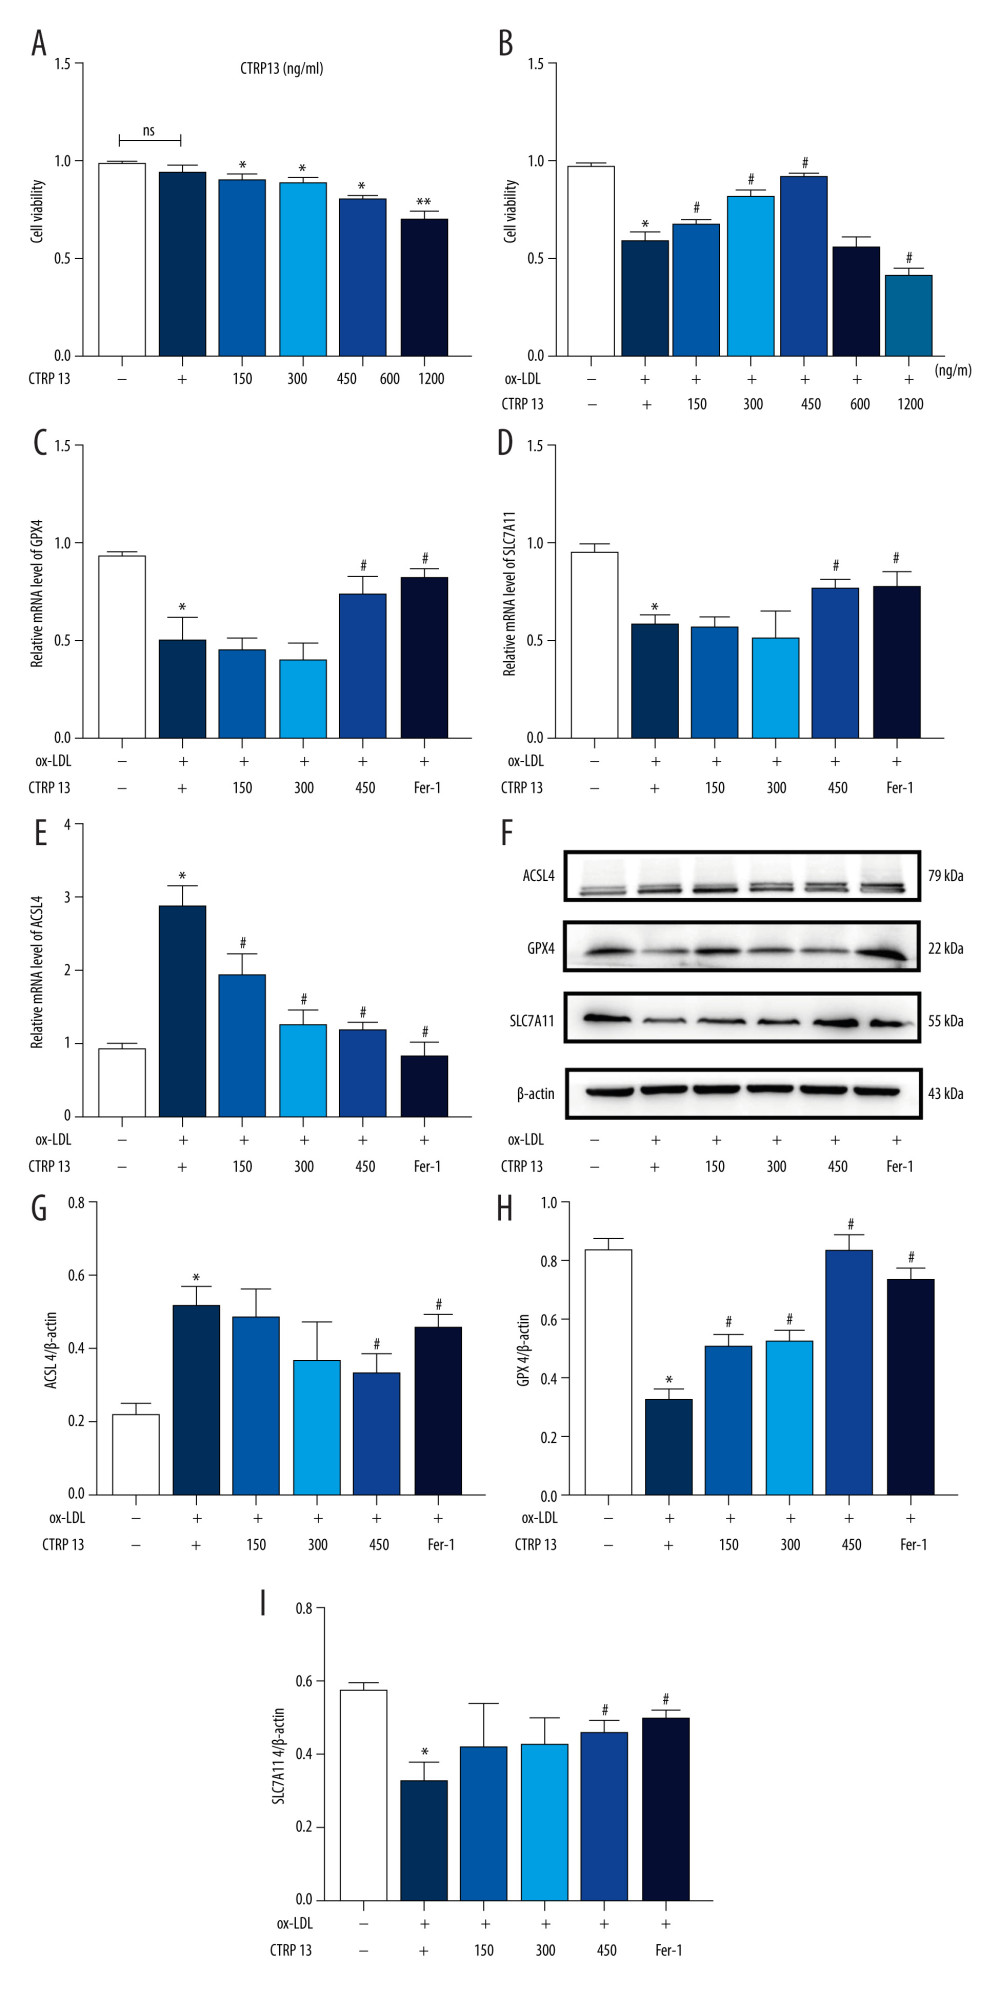 Figure 2. C1q/tumor necrosis factor-related protein 13 (CTRP13) suppressed oxidized low-density lipoprotein (ox-LDL)-induced human umbilical vein endothelial cell (HUVEC) ferroptosis. (A) Quantification of HUVEC viability following different doses of CTRP13 treatment. (B) Quantification of HUVEC viability following different doses of CTRP13 treatment following co-incubation with or without ox-LDL 100 μg/mL. (C–E) Acyl-CoA synthetase long-chain family member 4 (ACSL4), glutathione peroxidase 4 (GPX4), and recombinant solute carrier family 7, member 11 (SLC7A11) mRNA expressions. (F) Protein expression levels were measured using Western blot analysis. The following groups were assessed: Control; ox-LDL; ox-LDL+CTRP13150 ng/mL; ox-LDL+CTRP13 300 ng/mL; ox-LDL+CTRP13 450 ng/mL); ox-LDL+Fer-1, HUVECs were pre-treated with ox-LDL 100 μg/mL. (G–I) Quantitative analysis of ferroptosis-associated protein expression. The data are expressed as the mean±SD (n=3–4 per group). Statistical power=0.953772, effect size(r)=0.858954. * P<0.05 vs the control group. # P<0.05 vs the ox-LDL group. The relative protein levels were quantified by Image J software (NIH, Bethesda, MD, USA). GraphPad Prism 9.0 software (La Jolla, USA) was used to analyze the data.
 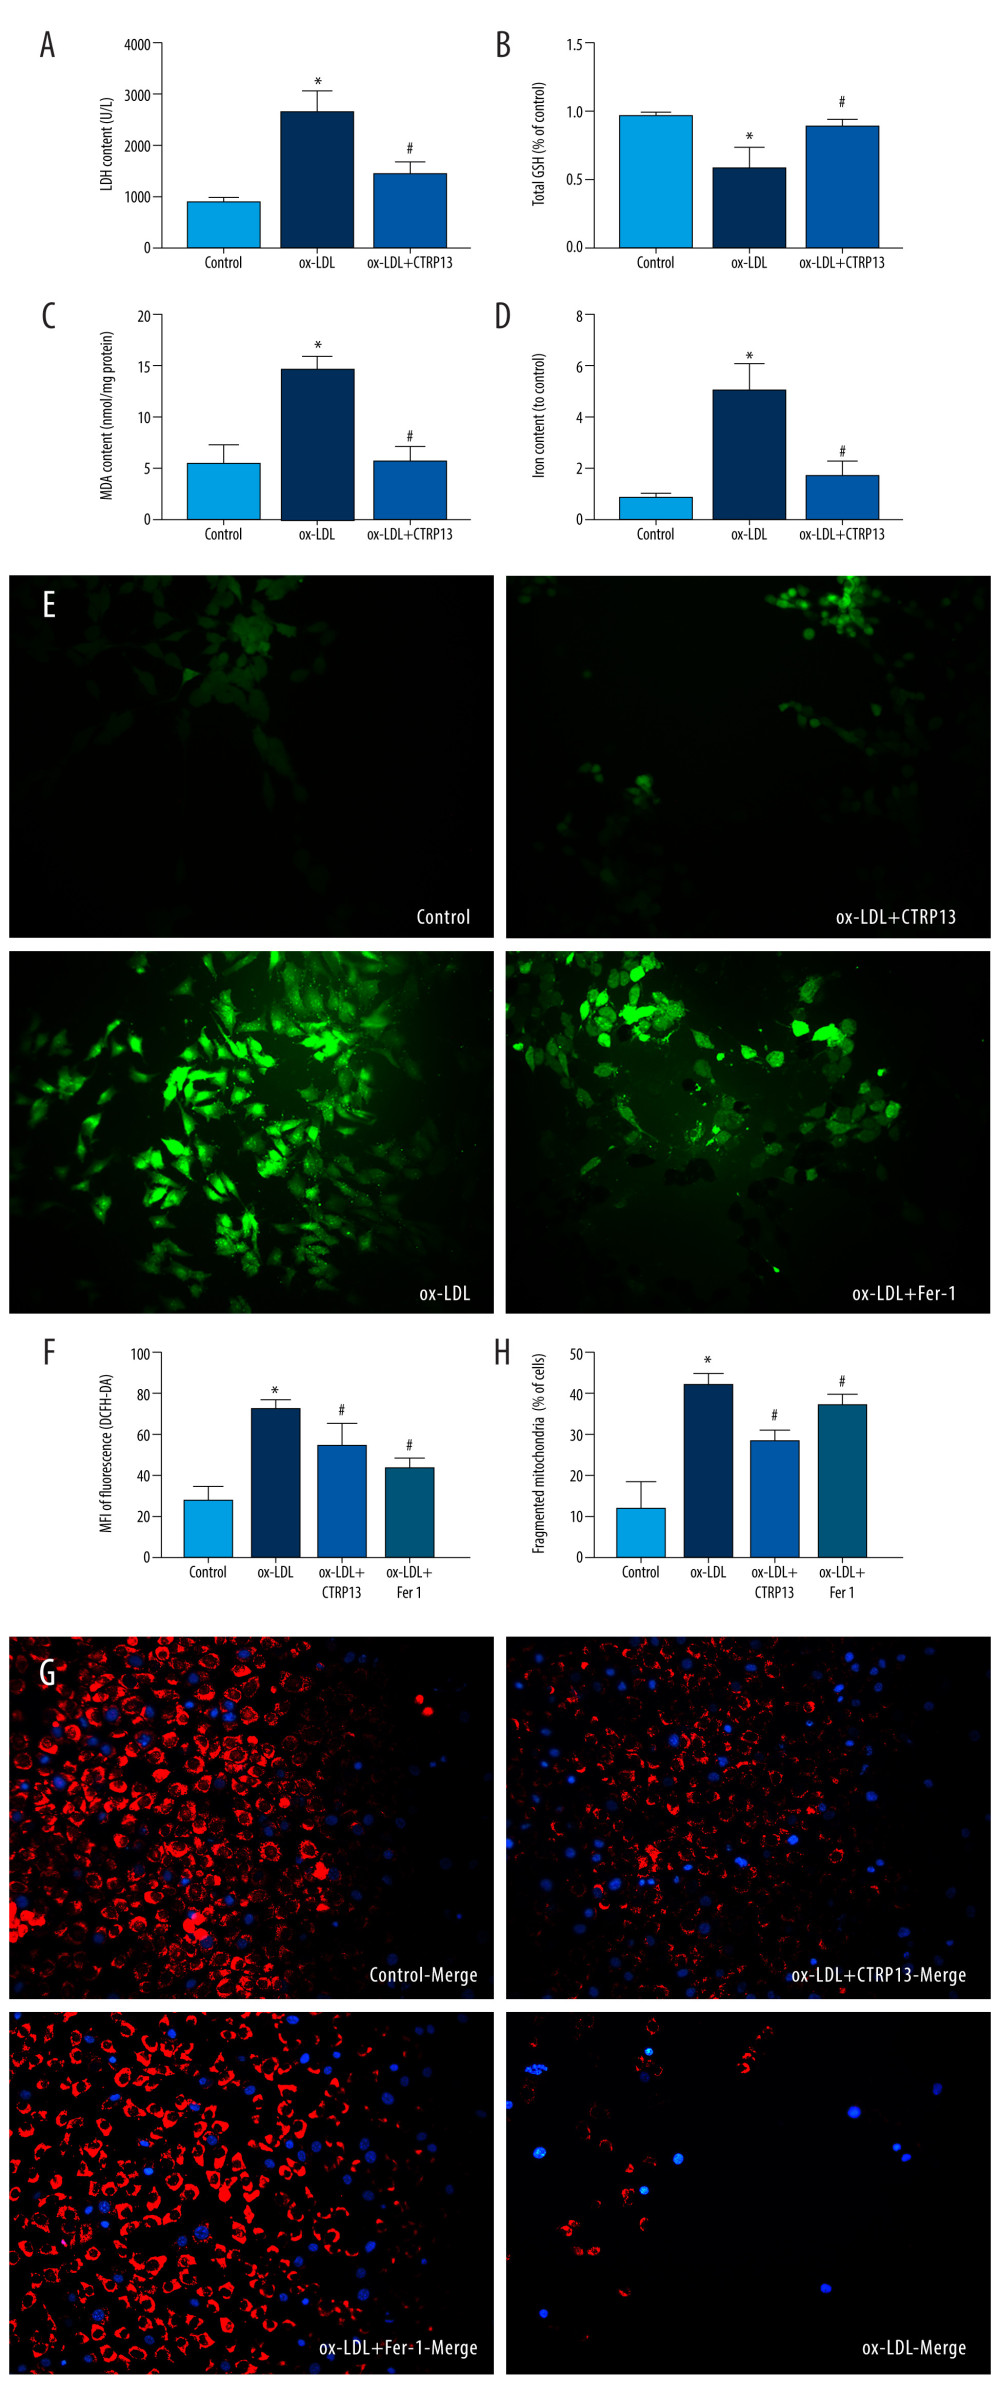 Figure 3. C1q/tumor necrosis factor-related protein 13 (CTRP13) inhibited oxidized low-density lipoprotein (ox-LDL)-induced human umbilical vein endothelial cell (HUVEC) lipid peroxidation and mitochondrial dysfunction. (A) Lactate dehydrogenase (LDH) level in cell supernatant was evaluated using a cytotoxicity detection LDH kit. (B, C) Total γ-glutamyl-cysteinyl-glycine (GSH) and malondialdehyde (MDA) indicators were measured using assay kits in endothelial cells. (D) The iron levels in endothelial cells were measured using commercial kits. (E) Representative fluorescent images present reactive oxygen species (ROS) levels. (F) Quantification of intracellular ROS levels. (G) Mito-tracker for labeling mitochondria in endothelial cells. (H) Quantification of fragmented mitochondria levels. A representative image from 3 separate experiments was illustrated. The images were captured at ×100 magnification. * P<0.05 vs the control group. # P<0.05 vs the ox-LDL group. Fluorescent images were evaluated using Olympus fluorescence microscopy with cellSens Dimension software (Version 1.3 rev, Olympus, Tokyo, Japan), and the positive cells were measured by Image Pro Plus 6.0 (Media Cybernetics, Rockville, MD, USA). GraphPad Prism 9.0 software (La Jolla, CA, USA) was used to analyze the data.
 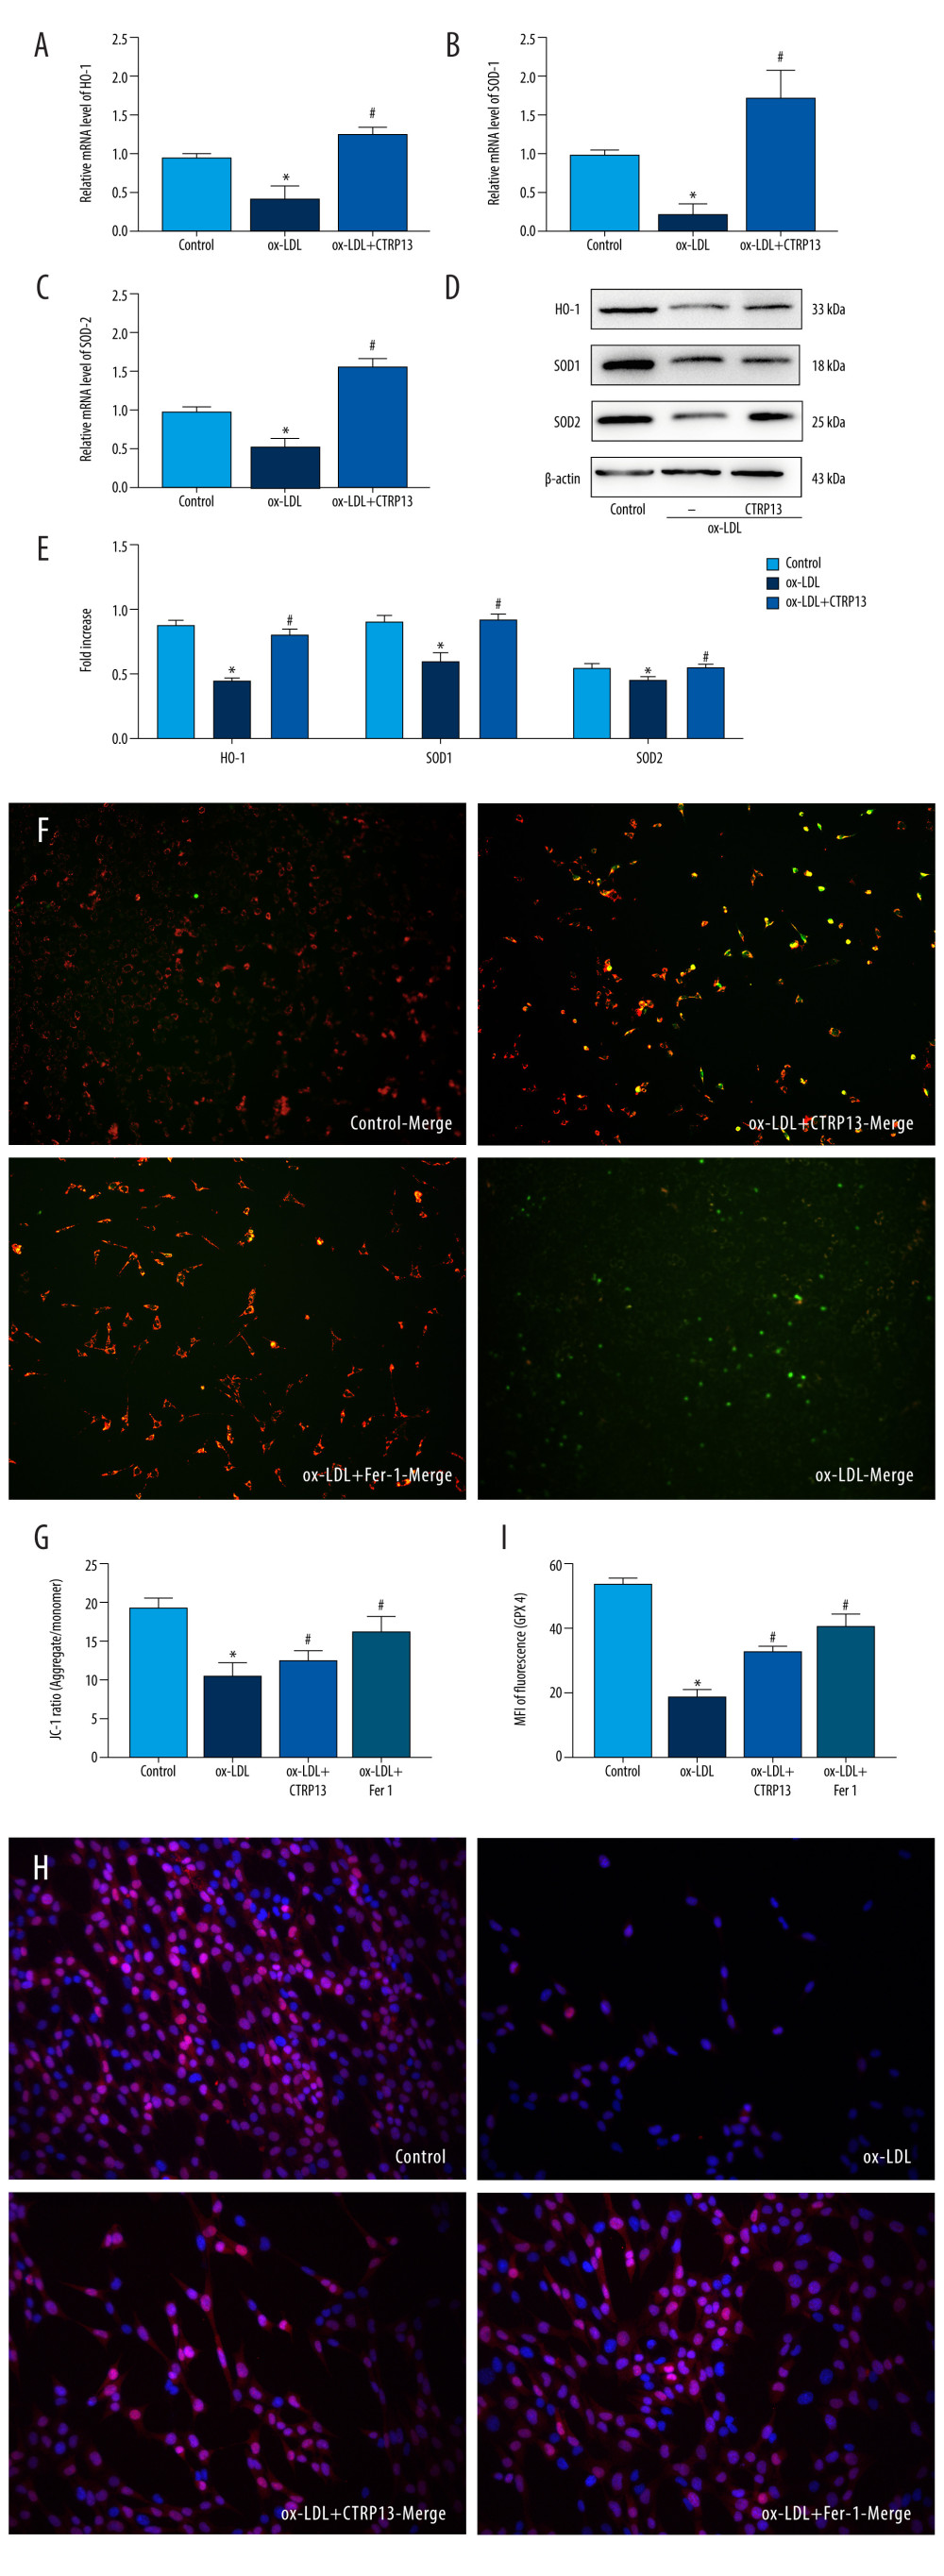 Figure 4. C1q/tumor necrosis factor-related protein 13 (CTRP13) reversed the downregulation of multifarious antioxidant proteins. (A–C) RT-PCR of the heme oxygenase 1 (HO-1), superoxide dismutase 1 (SOD-1), and superoxide dismutase 2 (SOD-2) mRNA levels. (D) Protein expression levels of antioxidant enzymes were measured using Western blot analysis. (E) Quantitative analysis of antioxidant-associated protein expression. (F) Representative fluorescent JC-1 images for testing the mitochondrial membrane potential in HUVECs, aggregates shown in green, and monomers shown in red (scale bars=100 μm). (G) Quantitative analysis of the aggregates to monomers ratio. (H, I) Intracellular glutathione peroxidase 4 (GPX4) levels were illustrated by representative immunofluorescence images. The data were expressed as the mean±SD (n=3–4 per group). Statistical power=0.982987, effect size(r)=0.918048. * P<0.05 vs the control group. # P<0.05 vs the ox-LDL group. Fluorescent images were evaluated using Olympus fluorescence microscopy with cellSens Dimension software (Version 1.3 rev, Olympus, Tokyo, Japan), and the positive cells were measured by Image Pro Plus 6.0 (Media Cybernetics, Rockville, MD, USA). The relative protein levels were quantified by Image J software (NIH, Bethesda, MD, USA). GraphPad Prism 9.0 software (La Jolla, USA) was used to analyze the data.
 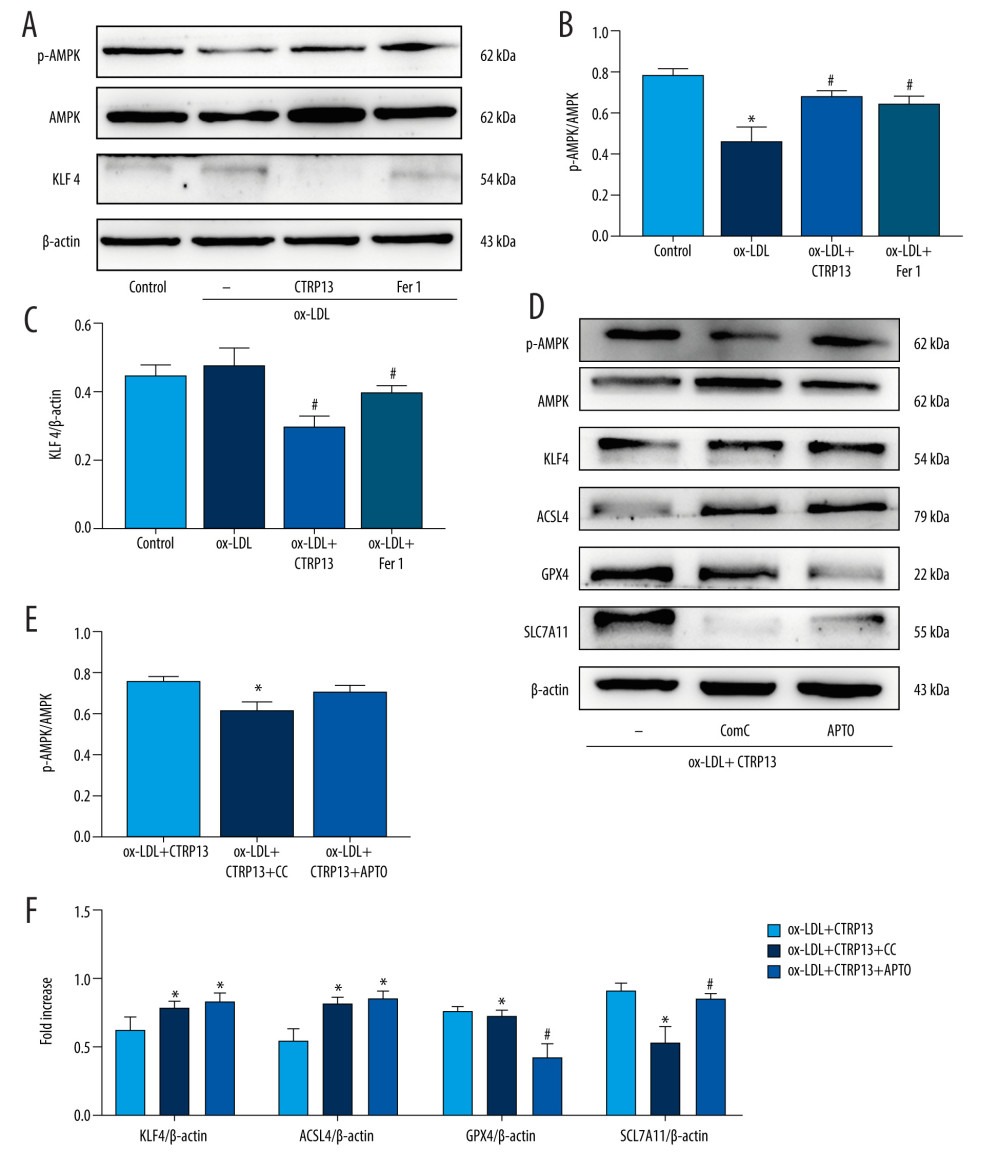 Figure 5. The ferroptosis protective effect of C1q/tumor necrosis factor-related protein 13 (CTRP13) was attenuated by inhibiting the AMPK/KLF4 pathway. (A) Protein expression levels were measured using Western blotting. The following groups were assessed: (1) Control; (2) oxidized low-density lipoprotein (ox-LDL); (3) ox-LDL+CTRP13; and (4) ox-LDL+Fer-1. (B, C) Quantitative analysis of phosphorylated AMP-activated kinase (p-AMPK), AMP-activated kinase (AMPK), and Krüppel-like factor 4 (KLF4). (D–F) The cells were treated with a combination of CTRP13 (450 ng/mL) and ox-LDL (100 μg/mL) for 24 h and subsequently incubated with compound C (5 μmol/L) or inducer of Krüppel-like factor 4 (APTO, 5 μmol/L) for another 24 h. Western blotting results (left panel) and quantitative data (right panel) for ferroptosis-associated protein and p-AMPK, AMPK, and KLF4 are presented. The data are expressed as the mean±SD (n=3–4 per group). Statistical power=0.933291, effect size(r)=0.847233. * P<0.05 vs the control group. # P<0.05 vs the ox-LDL group. The relative protein levels were quantified by Image J software (NIH, Bethesda, MD, USA). GraphPad Prism 9.0 software (La Jolla, USA) was used to analyze the data.
 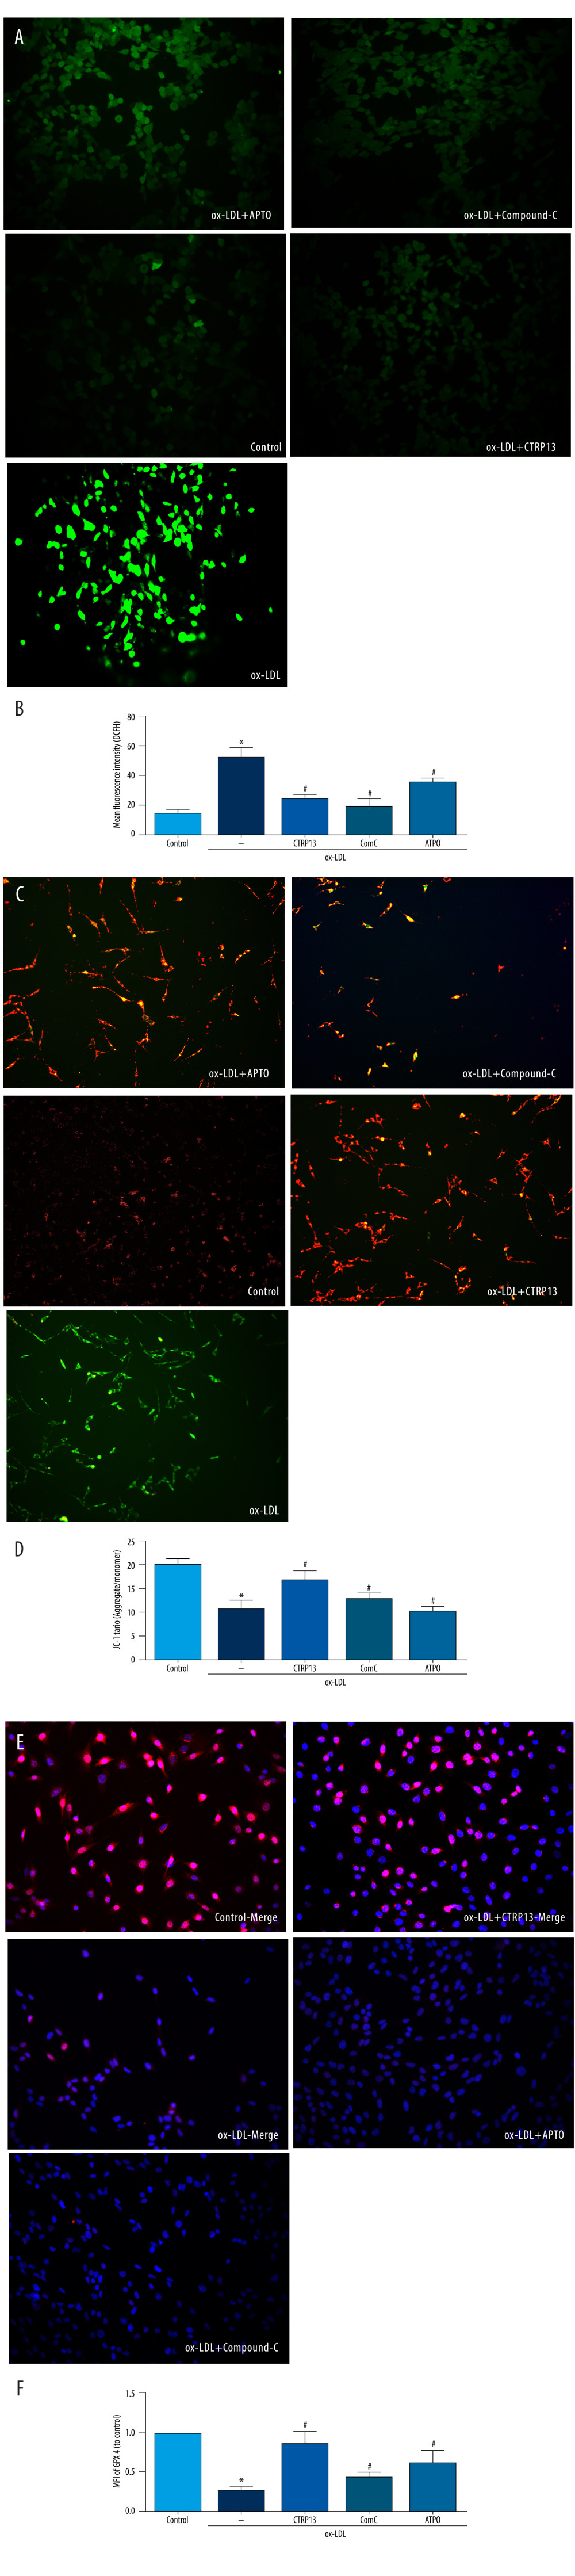 Figure 6. C1q/tumor necrosis factor-related protein 13 (CTRP13) restored mitochondrial functioning by counteracting oxidized low-density lipoprotein (ox-LDL) effects on the AMPK/KLF4 pathway. The following groups were assessed: (1) Control; (2) ox-LDL; (3) ox-LDL + CTRP13; (4) ox-LDL + CTRP13 + compound C; and (5) ox-LDL + CTRP13 + APTO. (A) Representative fluorescent images of DCFH-DA probe and (B) quantification of intracellular reactive oxygen species (ROS) levels in 5 cell groups. (C) Representative fluorescent JC-1 images for testing the mitochondrial membrane potential in human umbilical vein endothelial cells (HUVECs), aggregates shown in green, and monomers shown in red (scale bars=100 μm). (D) Quantitative analysis of the aggregates to monomers ratio. (E, F) Intracellular glutathione peroxidase 4 (GPX4) levels were depicted by representative immunofluorescence images. The data are expressed as the mean±SD (n=3–4 per group). Statistical power=0.972987, effect size(r)=0.914731. * P<0.05 vs the control group. # P<0.05 vs the ox-LDL group. Fluorescent images were evaluated using Olympus fluorescence microscopy with cellSens Dimension software (Version 1.3 rev, Olympus, Tokyo, Japan), and the positive cells were measured by Image Pro Plus 6.0 (Media Cybernetics, Rockville, MD, USA). GraphPad Prism 9.0 software (La Jolla, USA) was used to analyze the data.
 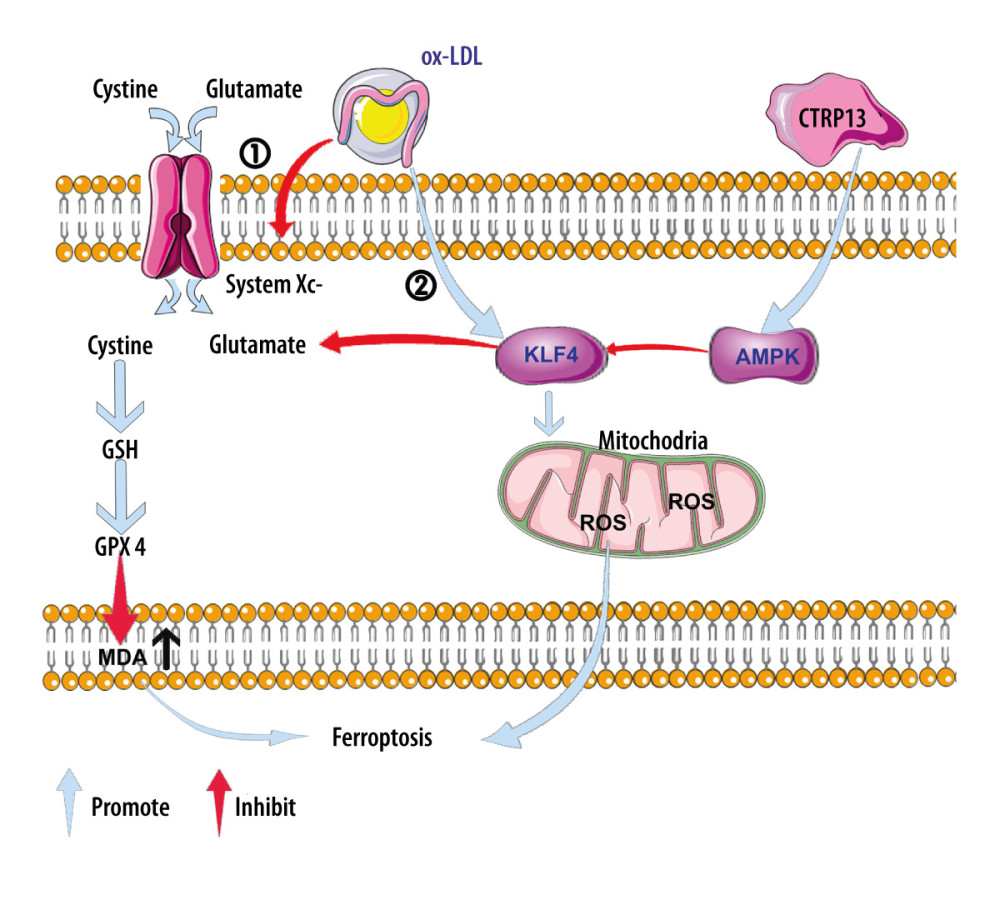 Figure 7. A schematic of the proposed mechanism by which C1q/tumor necrosis factor-related protein 13 (CTRP13) inhibited oxidized low-density lipoprotein (ox-LDL)-induced ferroptosis. Signal I: ox-LDL depresses the amino acid antiporter solute carrier family 7 member 11 (SLC7A11/xCT/system xc-), resulting in oxidative damage-induced ferroptosis, while this effect was suppressed by CTRP13 pretreatment. Signal II: ox-LDL activates the Krüppel-like factor 4 (KLF4) pathway and attenuates mitochondrial functioning due to increased production of reactive oxygen species (ROS), while ultimately, CTRP13 treatment inhibits this effect.
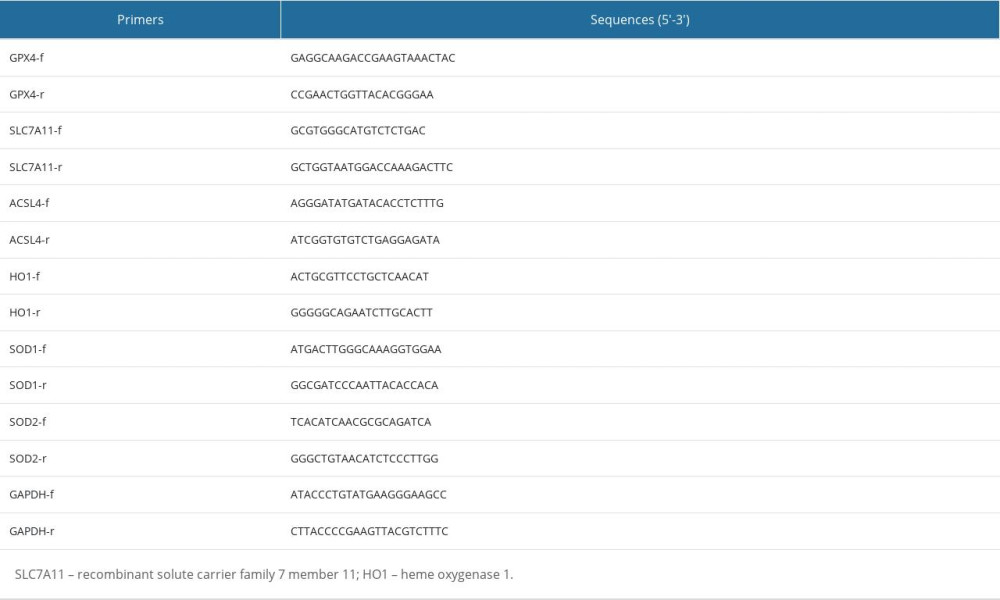
References
1. Frak W, Wojtasinska A, Lisinska W, Pathophysiology of cardiovascular diseases: new insights into molecular mechanisms of atherosclerosis, arterial hypertension, and coronary artery disease: Biomedicines, 2022; 10(8); 1938
2. Botts SR, Fish JE, Howe KL, Dysfunctional vascular endothelium as a driver of atherosclerosis: Emerging insights into pathogenesis and treatment: Front Pharmacol, 2021; 12; 787541
3. Yuan D, Chu J, Lin H, Mechanism of homocysteine-mediated endothelial injury and its consequences for atherosclerosis: Front Cardiovasc Med, 2022; 9; 1109445
4. Wang C, Chao Y, Xu W, CTRP13 preserves endothelial function by targeting GTP cyclohydrolase 1 in diabetes: Diabetes, 2020; 69(1); 99-111
5. Jiang H, Zhou Y, Nabavi SM, Mechanisms of oxidized LDL-mediated endothelial dysfunction and its consequences for the development of atherosclerosis: Front Cardiovasc Med, 2022; 9; 925923
6. Dixon SJ, Lemberg KM, Lamprecht MR, Ferroptosis: An iron-dependent form of nonapoptotic cell death: Cell, 2012; 149(5); 1060-72
7. Yang M, Lv H, Liu Q, Colchicine alleviates cholesterol crystal-induced endothelial cell pyroptosis through activating AMPK/SIRT1 pathway: Oxid Med Cell Longev, 2020; 2020; 9173530
8. Wang G, Han B, Zhang R, C1q/TNF-related protein 9 attenuates atherosclerosis by inhibiting hyperglycemia-induced endothelial cell senescence through the AMPKalpha/KLF4 signaling pathway: Front Pharmacol, 2021; 12; 758792
9. Stockwell BR, Friedmann Angeli JP, Bayir H, Ferroptosis: A regulated cell death nexus linking metabolism, redox biology, and disease: Cell, 2017; 171(2); 273-85
10. Shin CS, Mishra P, Watrous JD, The glutamate/cystine xCT antiporter antagonizes glutamine metabolism and reduces nutrient flexibility: Nat Commun, 2017; 8; 15074
11. Lv Y, Zhang S, Weng X, Estrogen deficiency accelerates postmenopausal atherosclerosis by inducing endothelial cell ferroptosis through inhibiting NRF2/GPX4 pathway: FASEB J, 2023; 37(6); e22992
12. Liu Z, Xia X, Lv X, Iron-bearing nanoparticles trigger human umbilical vein endothelial cells ferroptotic responses by promoting intracellular iron level: Environ Pollut, 2021; 287; 117345
13. Bai T, Li M, Liu Y, Inhibition of ferroptosis alleviates atherosclerosis through attenuating lipid peroxidation and endothelial dysfunction in mouse aortic endothelial cell: Free Radic Biol Med, 2020; 160; 92-102
14. Libby P, Loscalzo J, Ridker PM, Inflammation, immunity, and infection in atherothrombosis: jacc review topic of the week: J Am Coll Cardiol, 2018; 72(17); 2071-81
15. Xu W, Chao Y, Liang M, CTRP13 mitigates abdominal aortic aneurysm formation via NAMPT1: Mol Ther, 2021; 29(1); 324-37
16. Fadaei R, Moradi N, Baratchian M, Association of C1q/TNF-related protein-3 (CTRP3) and CTRP13 serum levels with coronary artery disease in subjects with and without type 2 diabetes mellitus: PLoS One, 2016; 11(12); e0168773
17. Chen X, Johns DC, Geiman DE, Krüppel-like factor 4 (gut-enriched Krüppel-like factor) inhibits cell proliferation by blocking G1/S progression of the cell cycle: J Biol Chem, 2001; 276(32); 30423-28
18. Ghaleb AM, Yang VW, Krüppel-like factor 4 (KLF4): What we currently know: Gene, 2017; 611; 27-37
19. Zhou Y, Yang J, Chen C, Polyphyllin III-induced ferroptosis in MDA-MB-231 triple-negative breast cancer cells can be protected against by KLF4-mediated upregulation of xCT: Front Pharmacol, 2021; 12; 670224
20. Kemp BE, Stapleton D, Campbell DJ, AMP-activated protein kinase, super metabolic regulator: Biochem Soc Trans, 2003; 31(Pt 1); 162-68
21. Winder WW, Hardie DG, AMP-activated protein kinase, a metabolic master switch: Possible roles in type 2 diabetes: Am J Physiol, 1999; 277(1); E1-10
22. Li T, Mu N, Yin Y, Targeting AMP-activated protein kinase in aging-related cardiovascular diseases: Aging Dis, 2020; 11(4); 967-77
23. Heidary Moghaddam R, Samimi Z, Asgary S, Natural AMPK activators in cardiovascular disease prevention: Front Pharmacol, 2021; 12; 738420
24. Sunaga H, Matsui H, Anjo S, Elongation of long-chain fatty acid family member 6 (Elovl6)-driven fatty acid metabolism regulates vascular smooth muscle cell phenotype through AMP-activated protein kinase/Krüppel-like factor 4 (AMPK/KLF4) signaling: J Am Heart Assoc, 2016; 5(12); e004014
25. Valente AJ, Irimpen AM, Siebenlist U, Chandrasekar B, OxLDL induces endothelial dysfunction and death via TRAF3IP2: Inhibition by HDL3 and AMPK activators: Free Radic Biol Med, 2014; 70; 117-28
26. Wang C, Xu W, Liang M, CTRP13 inhibits atherosclerosis via autophagy-lysosome-dependent degradation of CD36: FASEB J, 2019; 33(2); 2290-300
27. Li Q, Liu C, Deng L, Novel function of fluvastatin in attenuating oxidized low-density lipoprotein-induced endothelial cell ferroptosis in a glutathione peroxidase4- and cystine-glutamate antiporter-dependent manner: Exp Ther Med, 2021; 22(5); 1275
28. Qin X, Zhang J, Wang B, Ferritinophagy is involved in the zinc oxide nanoparticles-induced ferroptosis of vascular endothelial cells: Autophagy, 2021; 17(12); 4266-85
29. Adya R, Tan BK, Randeva HS, Differential effects of leptin and adiponectin in endothelial angiogenesis: J Diabetes Res, 2015; 2015; 648239
30. Li Y, Wang W, Chao Y, CTRP13 attenuates vascular calcification by regulating Runx2: FASEB J, 2019; 33(8); 9627-37
31. Soula M, Weber RA, Zilka O, Metabolic determinants of cancer cell sensitivity to canonical ferroptosis inducers: Nat Chem Biol, 2020; 16(12); 1351-60
32. Kuang F, Liu J, Tang D, Kang R, Oxidative damage and antioxidant defense in ferroptosis: Front Cell Dev Biol, 2020; 8; 586578
33. Scholtes C, Giguere V, Transcriptional control of energy metabolism by nuclear receptors: Nat Rev Mol Cell Biol, 2022; 23(11); 750-70
34. Xu J, Zhao L, Zhang X, Salidroside ameliorates acetaminophen-induced acute liver injury through the inhibition of endoplasmic reticulum stress-mediated ferroptosis by activating the AMPK/SIRT1 pathway: Ecotoxicol Environ Saf, 2023; 262; 115331
35. Lee H, Zandkarimi F, Zhang Y, Energy-stress-mediated AMPK activation inhibits ferroptosis: Nat Cell Biol, 2020; 22(2); 225-34
36. Song X, Zhu S, Chen P, AMPK-mediated BECN1 phosphorylation promotes ferroptosis by directly blocking system X(c)(−) activity: Curr Biol, 2018; 28(15); 2388-99e5
Figures
Figure 1. Oxidized low-density lipoprotein (ox-LDL) induced human umbilical vein endothelial cell (HUVEC) ferroptosis in a dose-dependent manner. (A, B) HUVEC metabolic activity was analyzed using Cell Counting Kit-8 (CCK-8) assay following treatment with ox-LDL (0–200 μg/mL; n=4). Statistical power=0.929356, effect size(r)=0.830181. (C) Hoechst/propidium iodide (PI) staining images were captured using fluorescence microscopy (Hoechst in blue, and PI in red; scale bars=100 μm). (D) The microscopic morphology of HUVECs under transmission electron microscope. (E) acyl-CoA synthetase long-chain family member 4 (ACSL4), glutathione peroxidase 4 (GPX4), and recombinant solute carrier family 7, member 11 (SLC7A11) protein expression levels were measured using Western blot analysis. (F–H) The results were normalized to controls, and histograms represent the relative intensities of ACSL4, GPX4, and SLC7A11. The data are expressed as the mean±SD (n=3–4 per group). Statistical power=0.913357, effect size(r)=0.804728. * P<0.05 vs the control group. # P<0.05 vs the ox-LDL group. Fluorescent images were evaluated using Olympus fluorescence microscopy with cellSens Dimension software (Version 1.3 rev, Olympus, Tokyo, Japan), and the positive cells was measured by Image Pro Plus 6.0 (Media Cybernetics, Rockville, MD, USA). Transmission electron microscopy (Talos L120C G2, FEI, Czech) was adopted to observe the morphology of HUVECs. The relative protein levels were quantified by Image J software (NIH, Bethesda, MD, USA). GraphPad Prism 9.0 software (La Jolla, USA) was used to analyze the data.Figure 2. C1q/tumor necrosis factor-related protein 13 (CTRP13) suppressed oxidized low-density lipoprotein (ox-LDL)-induced human umbilical vein endothelial cell (HUVEC) ferroptosis. (A) Quantification of HUVEC viability following different doses of CTRP13 treatment. (B) Quantification of HUVEC viability following different doses of CTRP13 treatment following co-incubation with or without ox-LDL 100 μg/mL. (C–E) Acyl-CoA synthetase long-chain family member 4 (ACSL4), glutathione peroxidase 4 (GPX4), and recombinant solute carrier family 7, member 11 (SLC7A11) mRNA expressions. (F) Protein expression levels were measured using Western blot analysis. The following groups were assessed: Control; ox-LDL; ox-LDL+CTRP13150 ng/mL; ox-LDL+CTRP13 300 ng/mL; ox-LDL+CTRP13 450 ng/mL); ox-LDL+Fer-1, HUVECs were pre-treated with ox-LDL 100 μg/mL. (G–I) Quantitative analysis of ferroptosis-associated protein expression. The data are expressed as the mean±SD (n=3–4 per group). Statistical power=0.953772, effect size(r)=0.858954. * P<0.05 vs the control group. # P<0.05 vs the ox-LDL group. The relative protein levels were quantified by Image J software (NIH, Bethesda, MD, USA). GraphPad Prism 9.0 software (La Jolla, USA) was used to analyze the data.Figure 3. C1q/tumor necrosis factor-related protein 13 (CTRP13) inhibited oxidized low-density lipoprotein (ox-LDL)-induced human umbilical vein endothelial cell (HUVEC) lipid peroxidation and mitochondrial dysfunction. (A) Lactate dehydrogenase (LDH) level in cell supernatant was evaluated using a cytotoxicity detection LDH kit. (B, C) Total γ-glutamyl-cysteinyl-glycine (GSH) and malondialdehyde (MDA) indicators were measured using assay kits in endothelial cells. (D) The iron levels in endothelial cells were measured using commercial kits. (E) Representative fluorescent images present reactive oxygen species (ROS) levels. (F) Quantification of intracellular ROS levels. (G) Mito-tracker for labeling mitochondria in endothelial cells. (H) Quantification of fragmented mitochondria levels. A representative image from 3 separate experiments was illustrated. The images were captured at ×100 magnification. * P<0.05 vs the control group. # P<0.05 vs the ox-LDL group. Fluorescent images were evaluated using Olympus fluorescence microscopy with cellSens Dimension software (Version 1.3 rev, Olympus, Tokyo, Japan), and the positive cells were measured by Image Pro Plus 6.0 (Media Cybernetics, Rockville, MD, USA). GraphPad Prism 9.0 software (La Jolla, CA, USA) was used to analyze the data.Figure 4. C1q/tumor necrosis factor-related protein 13 (CTRP13) reversed the downregulation of multifarious antioxidant proteins. (A–C) RT-PCR of the heme oxygenase 1 (HO-1), superoxide dismutase 1 (SOD-1), and superoxide dismutase 2 (SOD-2) mRNA levels. (D) Protein expression levels of antioxidant enzymes were measured using Western blot analysis. (E) Quantitative analysis of antioxidant-associated protein expression. (F) Representative fluorescent JC-1 images for testing the mitochondrial membrane potential in HUVECs, aggregates shown in green, and monomers shown in red (scale bars=100 μm). (G) Quantitative analysis of the aggregates to monomers ratio. (H, I) Intracellular glutathione peroxidase 4 (GPX4) levels were illustrated by representative immunofluorescence images. The data were expressed as the mean±SD (n=3–4 per group). Statistical power=0.982987, effect size(r)=0.918048. * P<0.05 vs the control group. # P<0.05 vs the ox-LDL group. Fluorescent images were evaluated using Olympus fluorescence microscopy with cellSens Dimension software (Version 1.3 rev, Olympus, Tokyo, Japan), and the positive cells were measured by Image Pro Plus 6.0 (Media Cybernetics, Rockville, MD, USA). The relative protein levels were quantified by Image J software (NIH, Bethesda, MD, USA). GraphPad Prism 9.0 software (La Jolla, USA) was used to analyze the data.Figure 5. The ferroptosis protective effect of C1q/tumor necrosis factor-related protein 13 (CTRP13) was attenuated by inhibiting the AMPK/KLF4 pathway. (A) Protein expression levels were measured using Western blotting. The following groups were assessed: (1) Control; (2) oxidized low-density lipoprotein (ox-LDL); (3) ox-LDL+CTRP13; and (4) ox-LDL+Fer-1. (B, C) Quantitative analysis of phosphorylated AMP-activated kinase (p-AMPK), AMP-activated kinase (AMPK), and Krüppel-like factor 4 (KLF4). (D–F) The cells were treated with a combination of CTRP13 (450 ng/mL) and ox-LDL (100 μg/mL) for 24 h and subsequently incubated with compound C (5 μmol/L) or inducer of Krüppel-like factor 4 (APTO, 5 μmol/L) for another 24 h. Western blotting results (left panel) and quantitative data (right panel) for ferroptosis-associated protein and p-AMPK, AMPK, and KLF4 are presented. The data are expressed as the mean±SD (n=3–4 per group). Statistical power=0.933291, effect size(r)=0.847233. * P<0.05 vs the control group. # P<0.05 vs the ox-LDL group. The relative protein levels were quantified by Image J software (NIH, Bethesda, MD, USA). GraphPad Prism 9.0 software (La Jolla, USA) was used to analyze the data.Figure 6. C1q/tumor necrosis factor-related protein 13 (CTRP13) restored mitochondrial functioning by counteracting oxidized low-density lipoprotein (ox-LDL) effects on the AMPK/KLF4 pathway. The following groups were assessed: (1) Control; (2) ox-LDL; (3) ox-LDL + CTRP13; (4) ox-LDL + CTRP13 + compound C; and (5) ox-LDL + CTRP13 + APTO. (A) Representative fluorescent images of DCFH-DA probe and (B) quantification of intracellular reactive oxygen species (ROS) levels in 5 cell groups. (C) Representative fluorescent JC-1 images for testing the mitochondrial membrane potential in human umbilical vein endothelial cells (HUVECs), aggregates shown in green, and monomers shown in red (scale bars=100 μm). (D) Quantitative analysis of the aggregates to monomers ratio. (E, F) Intracellular glutathione peroxidase 4 (GPX4) levels were depicted by representative immunofluorescence images. The data are expressed as the mean±SD (n=3–4 per group). Statistical power=0.972987, effect size(r)=0.914731. * P<0.05 vs the control group. # P<0.05 vs the ox-LDL group. Fluorescent images were evaluated using Olympus fluorescence microscopy with cellSens Dimension software (Version 1.3 rev, Olympus, Tokyo, Japan), and the positive cells were measured by Image Pro Plus 6.0 (Media Cybernetics, Rockville, MD, USA). GraphPad Prism 9.0 software (La Jolla, USA) was used to analyze the data.Figure 7. A schematic of the proposed mechanism by which C1q/tumor necrosis factor-related protein 13 (CTRP13) inhibited oxidized low-density lipoprotein (ox-LDL)-induced ferroptosis. Signal I: ox-LDL depresses the amino acid antiporter solute carrier family 7 member 11 (SLC7A11/xCT/system xc-), resulting in oxidative damage-induced ferroptosis, while this effect was suppressed by CTRP13 pretreatment. Signal II: ox-LDL activates the Krüppel-like factor 4 (KLF4) pathway and attenuates mitochondrial functioning due to increased production of reactive oxygen species (ROS), while ultimately, CTRP13 treatment inhibits this effect. In Press
08 Mar 2024 : Animal Research
Modification of Experimental Model of Necrotizing Enterocolitis (NEC) in Rat Pups by Single Exposure to Hyp...Med Sci Monit In Press; DOI: 10.12659/MSM.943443
18 Apr 2024 : Clinical Research
Comparative Analysis of Open and Closed Sphincterotomy for the Treatment of Chronic Anal Fissure: Safety an...Med Sci Monit In Press; DOI: 10.12659/MSM.944127
08 Mar 2024 : Laboratory Research
Evaluation of Retentive Strength of 50 Endodontically-Treated Single-Rooted Mandibular Second Premolars Res...Med Sci Monit In Press; DOI: 10.12659/MSM.944110
11 Mar 2024 : Clinical Research
Comparison of Effects of Sugammadex and Neostigmine on Postoperative Neuromuscular Blockade Recovery in Pat...Med Sci Monit In Press; DOI: 10.12659/MSM.942773
Most Viewed Current Articles
17 Jan 2024 : Review article
Vaccination Guidelines for Pregnant Women: Addressing COVID-19 and the Omicron VariantDOI :10.12659/MSM.942799
Med Sci Monit 2024; 30:e942799
14 Dec 2022 : Clinical Research
Prevalence and Variability of Allergen-Specific Immunoglobulin E in Patients with Elevated Tryptase LevelsDOI :10.12659/MSM.937990
Med Sci Monit 2022; 28:e937990
16 May 2023 : Clinical Research
Electrophysiological Testing for an Auditory Processing Disorder and Reading Performance in 54 School Stude...DOI :10.12659/MSM.940387
Med Sci Monit 2023; 29:e940387
01 Jan 2022 : Editorial
Editorial: Current Status of Oral Antiviral Drug Treatments for SARS-CoV-2 Infection in Non-Hospitalized Pa...DOI :10.12659/MSM.935952
Med Sci Monit 2022; 28:e935952