09 July 2023: Clinical Research
Dysregulation of Inflammation, Oxidative Stress, and Glucose Metabolism-Related Genes and miRNAs in Visceral Adipose Tissue of Women with Type 2 Diabetes Mellitus
Adam WróblewskiDOI: 10.12659/MSM.939299
Med Sci Monit 2023; 29:e939299


Abstract
BACKGROUND: Human visceral adipose tissue (VAT), now identified as an endocrine organ, plays a significant role in impaired fasting glucose and diabetes through the deregulated metabolism and adipogenesis of visceral adipocytes in obesity. Our study focuses on exploring the link between inflammation, oxidative stress, and glucose metabolism-associated genes with corresponding miRNAs in human visceral adipocytes and VAT from individuals with glucose metabolism disorders.
MATERIAL AND METHODS: We examined the expression of ATM, NFKB1, SOD2, INSR, and TIGAR, along with their related miRNAs using PCR, in two contexts: 1 – During the three-stage visceral adipogenesis under normal glucose levels (5.5 millimoles), intermittent, and chronic hyperglycemia (30 millimoles). 2 – In visceral adipose tissue from subjects (34 F, 18 M) with normal glucose metabolism, impaired fasting glucose, and type 2 diabetes mellitus.
RESULTS: Both chronic and intermittent hyperglycemia similarly influenced ATM, NFKB1, TIGAR, SOD2, INSR gene expression in visceral adipocytes, with corresponding changes in a few tested miRNAs (eg, let-7g-5p, miR-145-5p, miR-21-5p). Anthropometric and biochemical parameters led us to focus on female subjects. Our results showed transactivation of NFKB1, TIGAR, miR-10b-5p, miR-132-3p, miR-20a-5p, miR-21-5p, and miR-26a-5p exclusively in type 2 diabetes mellitus. Upregulated molecules (excluding miR-10b-5p and miR-20a-5p) positively correlated with glucose metabolism markers.
CONCLUSIONS: The genes studied may undergo miRNA interferences and hyperglycemic memory in visceral adipocytes under hyperglycemic conditions. VAT from women with type 2 diabetes mellitus, but not with impaired fasting glucose, showed transactivated miRNAs and a molecular dysregulation of TIGAR and NFKB1, possibly enhancing inflammation, oxidative stress, and disrupted glucose metabolism. These findings highlight the epigenetic and molecular disturbances in VAT related to glucose metabolism abnormalities. However, additional research is necessary to further understand their biological significance.
Keywords: Adipogenesis, Diabetes Mellitus, Type 2, Hyperglycemia, Inflammation, Intra-Abdominal Fat, MicroRNAs
Background
The burden of obesity and type 2 diabetes (T2DM) is indisputable. Projections dramatic and suggest that at least 642 million people will suffer from T2DM by 2040, thus providing a rationale for extensive research aimed at identifying biomolecules that allow for early prediction of T2DM development [1]. As evidenced by multiple studies, visceral adiposity is strongly associated with risk of prediabetes, T2DM, and gestational diabetes mellitus (GDM) [2–4]. Reduction of visceral adipose tissue (VAT) improves insulin resistance (IR) and fasting plasma glucose (FPG) more than reduction of subcutaneous adipose tissue (SAT) [5]. Reduction of VAT is also a desirable and positive side effect of a few anti-diabetic drugs under extensive investigation [6,7]. Considering the connection between T2DM and VAT, glucose metabolism abnormalities, including prediabetes (impaired glucose tolerance (IGT) and/or impaired fasting glucose (IFG)) and T2DM, are interrelated with altered (in hypertrophy and hyperplasia) adipogenesis (ADG). The latter also leads to hypoxia of white adipose tissue (AT), including VAT, both being recognized as tissues with an increasingly recognized endocrine role. While overgrown and hypoxic, VAT independently contributes to the development of IR by producing a detrimental profile of cytokines (eg, increased TNF-α, IL-6, resistin, and decreased adiponectin) into the bloodstream. Additionally, paracrine secretion of pro-inflammatory cytokines stimulates M1 macrophage infiltration and supports low-grade chronic inflammation of VAT, often induced by nuclear factor kappa β (NF-κB) signaling, which is also a target of the anti-diabetic drug metformin, which is considered to be involved in IR [8]. Importantly, inflamed VAT produces and secretes potent epigenetic modifiers – microRNAs (miRNAs). The latter are capable of affecting the expression of target genes even in distant tissues that are critical for insulin sensitivity (eg, utilizing adipocyte derived-extracellular vesicles), as observed for miR-155 and miR-34a [9,10]. All of these aforementioned aspects make VAT an especially interesting organ for epigenetic-based studies in terms of metabolic disorders.
Each fat depot is composed of inflammatory cells, adipocytes (Ads), and a reservoir of stem cells and preadipocytes [11]. Preadipocytes can replace dysfunctional mature adipocytes via starting differentiation on biological request. In this way, stem cells and preadipocytes of subjects with disturbed glucose metabolism are exposed to the detrimental impact of fluctuating and elevated glucose levels, most commonly before prediabetes or T2DM are diagnosed. Such preadipocytes differentiate and give rise to mature adipocytes with a history of exposure to hyperglycemia (HG), which is a strong inducer of epigenetic modifications. Indeed, there is great interest in finding molecules that could help estimate the risk of transition from a healthy to hyperglycemic phenotype [12].
The results of our previous investigation suggested that expression changes of some miRNAs are highly similar in female subjects with T2DM and IFG, and are predicted to be associated with inflammation, IR, and oxidative stress [13]. It was proven that untreated HG in prediabetes leads to further endothelial dysfunction and cardiovascular complications (in addition to faster progression to T2DM) [14]. Therefore, recognition of biomolecules (miRNA or mRNA) related to low-grade chronic inflammation, IR, and oxidative stress deregulated in VAT in early stages of T2DM development could be a promising solution for early diagnosis, improving global efforts in prevention of T2DM and its complications. There is broad interest in identifying biomarker molecules of among miRNAs in various diseases, including diabetic retinopathy, coronary artery disease, osteoarthritis, and multiple sclerosis [15–18].
On the other hand, understanding of epigenetic modulation of genes related to inflammation, insulin sensitivity, oxidative stress, and glucose metabolism may be a basis for development of precise epigenetic therapy in the future. Several miRNA therapeutics are already in II phase clinical trials (eg, miR-103/107 in nonalcoholic steatohepatitis and miR-132 in heart failure) or have completed phase II (eg, miR-29 in keloid disorder) [19].
Hence, we speculate that the development of IR (eg, during the IFG state, and thereafter T2DM) could be contributed to by the altered expression of miRNAs and genes associated with oxidative stress, glucose metabolism, and inflammation. To examine this role, firstly, we aimed to investigate the expression of several interconnected genes: an antioxidative gene (superoxide dismutase 2 –
Material and Methods
Studies on HPA-v Cells
CELL CULTURE AND TREATMENT: The HPA-v cell culture was managed as previously described [38]. Cell culture reagents and HPA-v cells were obtained from ScienCell Research Laboratories (Carlsbad, CA, USA). ADG of preadipocytes was performed in accordance with the specific protocol designed and validated by the manufacturer in 3 stages, including (Figure 1) proliferation (5 days), differentiation (12 days), and maturation (6 days). Preadipocytes were cultured in the following media: preadipocyte medium (PAM), preadipocyte differentiation medium (PADM), and adipocyte medium (AdM). After completion of every stage of the cell culture, HPA-v cells were harvested and processed for further analyses. The process of ADG was performed in 3 independent experiments. HPA-v cells were cultured in HG conditions during the whole ADG (chronic exposure) or during a single stage of ADG, producing 11 variants at different stages of adipocyte development (Figure 1). In HG-treated variants, a full medium (5.5 mM of glucose) was supplemented with d-(+)-Glucose (Sigma-Aldrich, Saint Louis, MO, USA) to obtain a concentration of 30 mM of glucose. In our research model, variants were denoted with letters ‘N’ or ‘H’, which reflected the glycemic conditions applied in subsequent stages of cell culture, normoglycemic (NG) conditions, or HG conditions. Variants of HG-treated HPA-v cells could be chronically (eg, H, HH, HHH) or intermittently treated cells (eg, NNH - HPA-v cells were cultured in NG conditions during preadipocyte proliferation and differentiation, whereas the cells were HG-treated during adipocyte maturation). The latter variants (with a single hit of HG) were designed to measure the impact of HG treatment on modulation of expression of miRNAs and their target genes related to inflammation, insulin sensitivity, glycolysis, oxidative stress defense, and DNA repair at a particular stage of ADG, along with the influence of glycemic normalization.
Overly normoglycemic variants (N, NN, NNN) served as a control and depicted physiological ADG. Overly hyperglycemic variants (H, HH, HHH) were designed to show changes during ADG in diabetic subjects. Finally, the research on HPA-v cells sought to investigate the impact of chronic (mimicking diabetes) and intermittent (mimicking IFG) HG, as compared to NG at a particular stage of HPA-v cell culture.
The HPA-v cell culture protocol was validated by the manufacturer and previously by our team in terms of successful ADG of cultured Ads on the basis of: i) BODIPY 505/515 staining, ii) Raman spectroscopy of lipid content, and iii) analysis of expression of the adipogenic markers (PPARγ and C/EBPα) at mRNA and protein level; showing functional competence of cultured Ads for lipid accumulation [38].
RNA ISOLATION AND RT-QPCR: Trypsinized HPA-v cells were counted for RNA isolation and approximately 6×10⁶ cells were used for RNA isolation in every studied variant. Firstly, RLT buffer and β-mercaptoethanol were used for cell lysis, and subsequently, homogenization was done by 20-gauge (0.9 mm diameter) needle pipetting (with attached RNAse-free syringe). Next, RNA was isolated from HPA-v cells using the AllPrep DNA/RNA/Protein Mini Kit (QIAGEN, Hilden, Germany) according to the manufacturer’s instructions, and its concentration and purity were measured with a Synergy HT microplate reader (Biotek, Winooski, VT, USA). Isolated RNA was stored frozen at −80°C for further processing. Reverse transcription of obtained RNA was performed in a Tgradient Thermocycler (Biometra, Göttingen, Germany) using a High-Capacity cDNA Reverse Transcription Kit (Applied Biosystems, Foster City, CA, USA) according to the manufacturer’s instructions. Expression of the studied genes was estimated by RT-qPCR method, using TaqMan Gene Expression MasterMix and TaqMan Gene Expression Assays, as shown in Table 2 (Applied Biosystems, Foster City, CA, USA). The RT-qPCR protocol included the following steps: UNG incubation (50°C, 2 min), polymerase activation (95°C, 10 min), and 40 PCR cycles comprising of denaturation (95°C, 15 s) and annealing/elongation, (60°C, 1 min). Expression profiling of the examined genes was preceded with an experimental selection of 2 out of 16 tested reference genes using TaqMan Array Human Endogenous Control Plates (Applied Biosystems, Foster City, CA, USA) and RefFinder [39], as described previously [38]. Gene expression data were normalized to the average Ct values obtained for RPLP0 (ribosomal protein lateral stalk subunit P0) and UBC (ubiquitin C).
MIRNAS SELECTION, MIRNA ISOLATION, AND RT-QPCR: Total RNA was isolated from HPA-v cells with a miRVANA Isolation Kit (Applied Biosystems, Vilnius, Lithuania) and reverse transcribed with TaqMan™ MicroRNA Reverse Transcription Kit and Custom RT Primer pool (Applied Biosystems, Foster City, CA, USA) according to the manufacturer’s instructions in a Tgradient Thermocycler (Biometra, Göttingen, Germany). To select differentially expressed miRNAs in the studied model, we performed screening with TaqMan Low-Density Arrays (TLDA) cards involving 754 miRNAs (including an internal negative control assay; Applied Biosystems, Foster City, CA, USA) in the 7900HT Fast Real-Time PCR System (Applied Biosystems; Thermo Fisher Scientific, Inc., Waltham, MA, USA) using TaqMan® Universal PCR Master Mix II, no UNG (Applied Biosystems, Foster City, CA, USA), as described previously [40]. Based on the obtained results as well as the bioinformatics analysis and literature research, we selected the miRNAs that either target the studied genes or participate in their downstream signaling. For evaluation in HPA-v cells we selected: let-7g-5p, miR-10b-5p, miR-132-3p, miR-145-5p, miR-16-5p, miR-20a-5p, miR-21-5p, miR-214-3p, miR-222-3p, miR-374a-5p, miR-93-3p, miR-99b-5p, all being depicted with their respective targets in Table 1. Expression levels of the selected miRNAs were evaluated in duplicate with custom TLDA cards and TaqMan Gene Expression Assays (as shown in Table 3). Expression of miRNA was normalized to the arithmetic average of Ct values for U6 and let-7b-5p, as identified by RefFinder, considering multiple candidate reference miRNAs [39].
STATISTICAL ANALYSES:
Statistical analyses were performed on −ΔCt values in GraphPad 6.0 software and data were presented as mean±SD. To evaluate the differences in expression of the studied genes and miRNAs, we used several statistical approaches: one-way ANOVA with Tukey’s post hoc test to detect changes during ADG in NG (‘N’ vs ‘NN’ vs ‘NNN’); chronic HG (‘H’ vs ‘HH’ vs ‘HHH’) and after exposure to HG during the preadipocyte proliferation (‘H’ vs ‘HN’ vs ‘HNN’); two-tailed
STUDY SUBJECTS AND ETHICAL ISSUES: Eighty-three unrelated Polish subjects who were at least 50 years old were enrolled into the study from among the patients admitted to the Clinical Department of General and Oncological Surgery at the Central Teaching Hospital of the Medical University of Łódź (Poland) for planned laparoscopic cholecystectomy between October 2017 and January 2020. To classify probands into particular study groups, we used additional inclusion criteria in accordance with the 2021 American Diabetes Association criteria. Subjects without history of glucose metabolism disorders, of FPG below 100 mg/dL, glycated hemoglobin (HbA1c) below 5.7% were assigned to NGM group. For the IFG group: FPG in the range of 100–125 mg/dL and HbA1c ranging from 5.7% to 6.4%. The earlier diagnosis of T2DM in medical history of the subjects, the ongoing therapy (insulin and/or metformin and/or sulfonylurea derivatives and/or flozins), and currently measured FPG and HbA1c were the basis of assignment to the T2DM group. Exclusion criteria were: neoplasms or their medical history along with acute inflammation. The participants included to the study were carefully selected to preclude differences between the 3 studied groups in terms of age, body mass index (BMI), body mass, waist-hip ratio (WHR), and waist circumference. Equal distribution of male and female subjects in each of the studied groups was not provided, possibly due to a higher frequency of cholecystectomy in women [41]. Importantly, evaluation of mRNA expression was finally conducted on 52 subjects (34 females and 18 males) (Figure 2), while miRNAs changes were measured only in 40 study subjects (13 male and 27 female probands) due to the scarcity of RNA material isolated from VAT samples in comparison to the number of planned analyses. The NGM group for miRNAs expression profiling had 5 males and 9 females, the IFG group had 5 males and 8 females, and the T2DM group had 10 females and 3 males.
The protocol of the study was approved by the Ethics Committee of the Medical University of Łódź, Poland (no. RNN/287/13/KE). All study participants were informed about the study protocol and provided written consent for the collection of a sample of visceral adipose tissue from the visceral peritoneum as well as a sample of peripheral venous blood (collected after a minimum of 8 h of overnight fasting).
BIOCHEMICAL AND ANTHROPOMETRIC MEASUREMENTS: Data collection included: height, weight, hip, and waist circumference, which were used to calculate BMI and WHR. Analysis of blood samples involved the evaluation of FPG, HbA1c, fasting insulin (FI), triglycerides (TG), total cholesterol (TC), and high-density lipoprotein cholesterol (HDL-C) levels. The Friedewald formula was used to calculate low-density lipoprotein cholesterol (LDL-C) levels. Glucose metabolism-associated parameters were used for the calculation of insulin resistance estimates such as TG to HDL-C ratio (TG/HDL) and homeostasis model assessment for insulin resistance (HOMA-IR) [42].
VAT SAMPLE COLLECTION AND ISOLATION OF RNA:
VAT samples collection took place after cholecystectomy, in an appropriate location in the visceral peritoneum, to avoid contact with the intestines and vital vessels, which minimized the risk of complications, while any observed complications were rather associated with cholecystectomy itself. The samples of VAT (about 1 g) were collected into PBS-containing sterile tubes and were immediately transported on wet ice (4°C) for preliminary processing from the operating room to the laboratory within the same building. The samples were weighed and 250 mg of fat samples were homogenized with Lysis/Binding Buffer (700 μl) and frozen at −80°C. Total RNA was isolated using the mirVana™ miRNA Isolation Kit (Invitrogen™, Carlsbad, CA, USA), as suggested by the manufacturer. The purity and concentration of isolated RNA were measured with a Pico100 Spectrophotometer (Picodrop). Only samples of RNA reaching ~ 2 (A260/A280) were chosen for expression profiling.
RT-QPCR: Expression profiling was preceded by experimental and RefFinder-based selection of 2 pairs of the most stable reference genes, using either TaqMan Array Human Endogenous Control Plates (Applied Biosystems, Foster City, CA, USA) or evaluating expression levels of numerous miRNAs and well-known reference genes (U6, RNU48, RNU44), as described earlier [13]. Our analysis indicated that PPIA and POLR2A are the most suitable references for mRNA expression profiling, while miR-93-5p and miR-17-5p were chosen for normalization of miRNA expression data. Expression levels of the selected genes and miRNAs were performed with TaqMan assays depicted in Tables 2 and 3, as described in subsections RNA isolation and RT-qPCR and miRNAs selection, miRNA isolation, and RT-qPCR of Material and Methods concerning HPA-v cells. In addition to miRNA examined in HPA-vs, we evaluated the expression of miR-26a-5p and miR-26b-5p ex vivo, which are the molecules studied previously in HPA-vs [36].
IN SILICO ANALYSIS: Functional analysis of upregulated miRNAs in VAT of T2DM female subjects was evaluated with miEAA 2.0 (WikiPathways, miRPathDB) [34] and miRSystem [43]. In over-representation analysis (ORA) involving the WikiPathways database, the result pathways were refined to those with strong experimental evidence and significantly annotated to a minimum of 4 out of 5 tested miRNAs. It was performed with P value adjustment using FDR (Benjamini-Hochberg) adjustment, and significance level P<0.05. Data are presented as a wordcloud of the top 100 categories by P value.
The miRNA enrichment analysis involving miRSystem was refined to pathways which were significantly annotated to at least 4 miRNAs. Moreover, each hit included only validated targets, the O/E ratio (observed to estimated ratio) was greater than or equal to 2, and the number of total genes in a pathway was greater than or equal to 25 and less than or equal to 500. Functional annotation included KEGG, Biocarta, Pathway Interaction Database (human only), Reactome (human only).
STATISTICAL ANALYSIS: Collected data were checked for equity of variance and normality of data distribution via Levene and Shapiro-Wilk tests, respectively. To evaluate differences among the 3 studied groups in terms of age, biochemical, and anthropometric parameters, Kruskal-Wallis one-way ANOVA with Dunn’s post hoc test was used (Supplementary Table 1). The mRNA and miRNA expression data were analyzed among the 3 studied groups based on −ΔCt values with either parametric or nonparametric one-way ANOVA (Tukey’s/Dunn’s post hoc tests) depending on the results of the Levene and Shapiro-Wilk tests. Two-way ANOVA was used to evaluate the association of expression changes of miRNAs and mRNAs of the selected genes with sex. Univariate correlation among levels of individual mRNAs, miRNAs, sex, age, and anthropometric and biochemical parameters were checked via Spearman’s rank correlation, while correlation heatmaps were generated with MultiExperimentViewer software 4.9.0 (The Perl Foundation) [44]. Analysis of covariance was performed for expression data derived from female VATs only while taking into account either age, BMI, WHR, TC, or HDL-C. Statistical analyses were performed with STATISTICA 10.0 software (StatSoft, Tulsa, OK, USA), while GraphPad Prism 6.0 software (GraphPad Software, Inc.) was used to generate graphs of expression data. P<0.05 was considered significant.
Results
In Vitro Studies
THE IMPACT OF HIGH GLUCOSE ON EXPRESSION LEVELS OF GENES AND MICRORNAS EXAMINED DURING HUMAN VISCERAL ADG (HPA-V CELLS): Firstly, we investigated expression changes of the examined genes during the progression of normoglycemic visceral ADG (N, NN, NNN), which reflected a physiological process and served as a control to measure the impact of HG. mRNA expression of ATM, TIGAR, and NFKB1 showed a similar pattern during normoglycemic ADG, being decreased in Ads cultured in NG since the differentiation stage (Figure 3). This may indicate their similar role and molecular interconnection during visceral ADG. On the other hand, the transcription of INSR, a well-known marker of ADG, was increased since the differentiation stage; whereas the SOD2 mRNA level was upregulated only in mature Ads (NNN vs NN, NNN vs N). In contrast, HG evoked a decrease of TIGAR mRNA only after the differentiation stage (HH vs H). It appears that expression of ATM, NFKB1, SOD2, and INSR is stable from preadipocytes to mature Ads during the course of ADG conducted under chronic HG (H, HH, HHH), which stays in dramatic contrast to their expression pattern observed during the physiological process (N, NN, NNN).
While comparing ADG in HG and NG, none of the examined genes was transcriptionally affected by HG at the stage of preadipocytes (H vs N). At the second stage of ADG, either chronic or intermittent HG, resulted in higher
Regarding miRNAs, we observed a decreased level of solely miR-93-3p after the differentiation stage (NN vs N; Figure 4). By contrast, 4 of the studied miRNAs manifested changes in transcriptional levels during ADG under chronic HG. Specifically, we observed upregulation of miR-145-5p and a downregulation of miR-222-3p (HHH vs H, HH vs H), along with decreased let-7g-5p and miR-16-5p exclusively after adipocyte maturation (HHH vs HH). These results indicate that HG affects a set of miRNAs, altering their physiological expression pattern during visceral ADG.
While comparing ADG in HG and NG, we found a decrease of only miR-93-3p in HG-treated preadipocytes (H vs N). Additionally, chronic, but not intermittent, HG exposure resulted in an elevation of let-7g-5p and miR-16-5p at the stage of differentiated Ads (HH vs NN). Considering mature Ads, we noticed a decrease of miR-10b-5p under chronic HG.
The impact of intermittent HG treatment was noticeable exclusively in mature Ads and resulted in reduced miRNA levels. For instance, we detected a HG-induced decrease of transcription of miR-145-5p and miR-21-5p, which was in line with the observed upregulation of
Simultaneously, we observed that mRNA expression of
Altogether, the results suggest that the expression of examined genes and some of their epigenetic regulators (miRNAs) is affected by the glycemic condition during ADG, especially in differentiated and mature Ads. The obtained results encouraged us to perform an ex vivo data evaluation in VAT of subjects with NGM, IFG, and T2DM. These 3 groups of subjects were designed in a way that precluded significant differences in age, and to some extent mitigated the impact of central and overall adiposity (WHR, BMI).
EX VIVO STUDIES – DESCRIPTION OF THE STUDY SUBJECTS:
We enrolled 52 subjects, including 34 females and 18 males, into the molecular examination study and assigned them to 3 groups: NGM (normal glucose metabolism), IFG (impaired fasting glucose), and T2DM (diabetic). Both female and male subjects were assigned to the study groups based on FPG and HbA1c levels with avoidance of significant differences in age, body mass, and BMI (Supplementary Table 1). However, the impact of adiposity was not overly eliminated, as all subjects (normal weight, overweight, obese) were assigned to the study groups accordingly to BMI criteria.
Women of all study groups were characterized by a similar distribution of adipose tissue (visceral) according to WHR (median WHR ranging from 0.90 to 0.93). We noticed that female T2DM patients had higher values of FI and HOMA-IR compared to NGM female subjects, as well as increased FI and HbA1c levels in relation to IFG female probands. This provides further confirmation that the subjects were properly classified and assigned to the study groups. We also found an increase of TG and TG/HDL in T2DM female subjects compared to NGM ones. Decreased levels of TC and LDL-C in T2DM females could possibly be caused by the recommended statin administration to treat dyslipidemia in T2DM and to prevent cardiovascular complications [45]. Surprisingly, FI and HOMA-IR were indifferent between IFG and NGM females. Differences in FI may arise from an early stage of development of the glucose metabolism disturbances in IFG, where IR has not yet induced hyperinsulinemia, which was consistent with the observation of Dulkadiroğlu et al [46].
Taking into account the description of the studied subjects: i) the studied subgroups of female subjects were well-matched in terms of age, WHR, body mass, and waist circumference; (ii) the low number of male study subjects; and (iii) the impact of adipose tissue distribution, which was not eliminated in male study subjects; we decided to focus only on analysis of gene and miRNA expression changes in female VAT samples. The results of analyses of expression of the examined genes and miRNAs and expression correlations in VAT of male study subjects are shown in Supplementary data (Supplementary Table 2 and Supplementary Figures 1, 2).
EXPRESSION CHANGES OF THE EXAMINED GENES AND MIRNAS IN VAT: In general, we observed a substantial level of overlap of gene expression levels between the female subgroups. However, we still detected increased levels of NFKB1 and TIGAR in VAT of T2DM women, as compared to either IFG or NGM group (Figure 5). Expression of several studied miRNAs (miR-10b-5p, miR-132-3p, miR-20a-5p, miR-21-5p, miR-26a-5p) was higher in T2DM as compared to the NGM group (Figure 6). The changes in expression of miR-10b-5p and miR-21-5p seemed to reflect the upregulated mRNA level of their modulatory gene, NFKB1, which was not confirmed by the analysis of correlation between NFKB1 and miRNAs. This could be associated with a (slight) tendency of miR-10b-5p expression to similarly increase in both IFG and T2DM females as compared to NGM ones (IFG vs NGM, P=0.074). While comparing IFG and NGM females, we also observed that an increase of miR-145-5p nearly reached statistical significance (P=0.0558, post hoc IFG vs NGM=0.050). These results, in line with our previous research, could indicate that the expression of distinct miRNAs varies depending on the severity of hyperglycemia (IFG vs T2DM). Finally, our observations may suggest a NF-κB-dependent modulation of transcription of miR-10b-5p and miR-21-5p in VAT of T2DM subjects.
CORRELATION ANALYSIS AMONG EXPRESSION OF THE EXAMINED GENES AND MIRNAS IN VAT: Next, we compared miRNAs and mRNAs expression detected in all of the female VAT samples via correlation analysis (Figure 7). We found 6 significant correlations among mRNAs and miRNAs, which could imply their regulatory relationship. Expression of exclusively one of the upregulated miRNAs, miR-21-5p, showed a moderate positive correlation with the level of SOD2 (r=0.42), its well-known target gene, and with TIGAR. We also noticed an emerging potent and positive correlation between the expression of SOD2 and miR-145-5p (r=0.67), both being unchanged in VAT of T2DM females. The only negative correlation was found between levels of TIGAR and miR-16-5p; however, similarly to the above-mentioned correlation with miR-21-5p, it has not been mechanistically validated so far. Finally, let-7g-5p and miR-374a-5p manifested slight and positive correlations with their direct targets, INSR and ATM, respectively.
We also found that
Considering the upregulated miRNAs, we detected several moderate-to-strong positive correlations between the levels of: miR-26a-5p and miR-10b-5p; miR-132-3p and miR-214-3p; along with a pronounced correlation between miR-132-3p and miR-21-5p. This suggests that they might be either commonly regulated by an upstream factor or they might regulate similar biological phenomena in VAT.
CORRELATION ANALYSIS OF EXPRESSION OF THE EXAMINED GENES AND MIRNAS WITH AGE AND CLINICAL PARAMETERS IN VAT: Firstly, levels of miR-99b-5p and NFKB1 demonstrated either a positive or negative slight correlative relationship with age, respectively (Figure 8). As we expected, none of the tested molecules was correlated with body mass and BMI. However, levels of miR-99b-5p and TIGAR showed a slight positive correlation with WHR, while miR-16-5p was negatively correlated with this parameter. Taking into account the other detected correlations, such as the ones related to glucose metabolism and IR (eg, FPG, FI, TG/HDL, HOMA-IR), the above-mentioned molecules might be especially associated with VAT accumulation and resultant metabolic repercussions. Additionally, the levels of nearly all of the upregulated genes or miRNAs in VAT of T2DM females, except for NFKB1, had at least a moderate positive correlation with FPG levels. The expression of NFKB1, TIGAR, miR-132-3p, miR-21-5p, and miR-26a-5p was positively correlated with at least 3 out of 4 examined indicators of glucose metabolism and IR (FPG, FI, HOMA-IR, HbA1c). By contrast, miR-10b-5p and miR-20a-5p were correlated with FPG and/or HbA1c levels, but were uncorrelated with parameters of IR. This could suggest their slightly different role in molecular signaling of VAT, as compared to 3 upregulated miRNAs (miR-21-5p, miR-132-3p, and miR-26a-5p) found to be broadly connected with IR. In particular, miR-21-5p was moderately and positively correlated with all of the measured indicators of glucose metabolism and IR. The latter observation is especially interesting as miR-21-5p can be modulated by NF-κB, or target NFKB1 and SOD2, which are genes involved in inflammation and antioxidative defense.
Considering the parameters of lipid metabolism, we found a moderate positive correlation between TG levels and miR-21-5p or miR-26a-5p and a weak correlation between TG and
Expression of let-7g-5p, miR-145-5p, miR-214-3p, miR-222-3p, miR-93-3p, and
ANALYSIS OF COVARIANCE:
As we observed several prominent correlation coefficients, we decided to perform multivariate analyses taking into account several parameters (age, BMI, WHR, TC, and HDL-C). Other parameters were either correlated with FPG and HbA1c (being strictly associated with assignment to the study group, eg, TG) or redundant, such as body mass or waist or hip circumference, making BMI and WHR representative values. In most cases, the difference in gene expression was still significant. Specifically,
IN SILICO ANALYSIS OF THE SET OF 5 UPREGULATED MIRNAS IN VAT OF FEMALE T2DM SUBJECTS: To recognize the potential biological phenomena regulated by 5 miRNAs upregulated in VAT of diabetic women (miR-10b-5p, miR-132-3p, miR-20a-5p, miR-21-5p, miR-26a-5p), we performed a functional analysis. The silico tool, miEAA, indicated the association of examined miRNAs with the phenomena typically associated with HG-afflicted VAT (ADG, cell cycle, and its control, miRNA Regulation of DNA Damage Response, DNA damage response only ATM dependent) (Table 4). These data are consistent with several top results generated by the miRSystem, also showing association with p53 pathway and downstream insulin signaling of pathways (PI3K/Akt) (Supplementary Table 3). Altogether, these results may suggest a contribution of 5 upregulated miRNAs to the signaling associated with DNA damage along with the regulation of ADG.
EXPRESSION OF THE EXAMINED GENES AND MIRNAS IN VAT – TWO-WAY ANOVA ANALYSIS:
In addition to analyses conducted for samples collected from female subjects, we performed a preliminary analysis regarding the impact of sex. Two-way ANOVA with Tukey’s post hoc test demonstrated that the miR-21-5p level was significantly upregulated when comparing female T2DM to NGM subjects (
Discussion
In the current study we demonstrated that the expression pattern of inflammation-, oxidative stress- and glucose metabolism-related genes is greatly changed during physiological visceral ADG. To the best of our knowledge, we may be one of the first teams to evaluate the expression pattern of
We mainly aimed to determine the impact of hyperglycemic conditions on the expression of the studied genes along with their targeting miRNAs. ADG of the studied HPA-v cells was functionally validated using Raman spectroscopy and lipid droplet staining in our previous report [38]. In contrast to normoglycemic ADG, HG stabilized the expression of all of the examined genes, except for
Taken together, the detected changes in gene expression suggest that chronic HG can elicit: (i) reactive oxygen species (ROS) accumulation; (ii) ATM expression increase along with its potential activation; (iii) antioxidative defense via blunting glycolysis and increasing glucose influx into the phosphopentose pathway (PPP) via the ATM/p53/TIGAR pathway to produce NADPH needed for reduction of glutathione; and (iv) activation of NF-κB and initial induction of
Thus, on the basis of the analysis of gene expression in Ads, one could speculate about: (i) a coregulatory relationship among
Among the miRNAs analyzed in Ads, many of the observed expression changes (induced by either chronic or intermittent HG) were convergent with their putative targets. Moreover, the expression changes of
Our in vitro experiment suggested the existence of metabolic memory, which is achieved, at least in part, through epigenetic mechanisms. This encouraged us to evaluate our results in VAT of NGM, IFG, and T2DM subjects. To accomplish our aim, we determined whether the level of dysglycemia observed in IFG is sufficient to induce the expression changes observed in diabetic subjects. Preliminary analysis of subjects’ anthropometric and biochemical parameters revealed that the results respecting male subjects could be affected by the not overly eliminated impact of adipose tissue distribution. Additionally, considering the low number of male subjects and the fine balance of age, WHR, body mass, waist circumference in the female subgroups, we decided to focus mainly on female subjects in our ex vivo experiment. The observed upregulations of
Contrary to our expectations, we did not observe any miRNA to be changed in IFG subjects. However, we observed a trend of increased miR-145-5p in IFG subjects as compared to NGM ones, which was partially in line with a similar reduction of miR-145-5p level in all single-HG hit variants, along with the unchanged levels for chronic HG one. A few studies also recorded reduced miR-145-5p levels after a short exposure of cardiomyocytes or vascular smooth muscle cells (VSMCs) to HG [63–65]. Hence, fluctuations of HG could evoke cardiovascular T2DM complications with a possible contribution of miRNAs [66]. Especially with respect to oxidative stress, as
Surprisingly, we detected predominantly positive correlations among the miRNAs and their target genes in females’ VAT (especially between
Additionally, expression changes of a majority of the examined molecules were found in female, but not male, VAT samples, which could suggest an impact of sex on gene expression. A sex-underlain distinction of miRNAs expression was earlier implied in animal studies on white AT [83,84], and recently, by our team [13]. Nevertheless, such a hypothesis should be confirmed by further studies involving equal numbers of males and females, and our present results should be interpreted with great caution due to the relatively small number of males in the studied groups.
Considering the strong and weak points of our study, we evaluated expression levels of numerous molecules in rarely examined material (HPA-v cells and VAT). In vitro studies provided previously unrecorded data regarding expression changes of several molecules and miRNAs during physiological visceral ADG. Moreover, we demonstrated that HG triggers changes in the expression profile of inflammation- and oxidative-stress-related molecules during visceral ADG, implying that the impact of HG on the expression of some molecules may be preserved during the process of Ads formation. VAT possesses a reservoir of preadipocytes, which are cells ready to differentiate and replace dysfunctional Ads on biological request. Taking into account the low number of studies conducted on VAT taken from IFG and T2DM subjects, our matching of female study subjects is unique, even though we failed to entirely eliminate the impact of overall and abdominal adiposity. Additionally, our preliminary results may possibly suggest a sex-underlain regulation of the expression of some molecules in VAT, although the number of males was lower, and they predominantly lacked visceral obesity as compared to female subjects [13]. We are aware that the presented observations comparing the expression of miRNAs and genes should be taken as suggestions which need to be validated in further research using, for example, gain/loss of function experiments. Further studies are also needed to assess the biological relevance of the reported changes in gene and miRNA expression observed in in vitro and ex vivo experiments. Nevertheless, taking into account the complexity of epigenetic RNA interference (which could be evoked by multiple miRNAs), the presented results may help to decipher the miRNA-mRNA regulatory network responsible for oxidative stress and insulin resistance in visceral adipose tissue (VAT) of T2DM patients.
Conclusions
Our results obtained in vitro imply that HG impacts the expression of the examined genes not only in mature Ads, but also during ADG. Moreover, the expression changes detected in HPA-vs showed signs of hyperglycemic memory. Therefore, HG may alter the expression of miRNAs and genes broadly associated with inflammation during ADG, thus potentially facilitating further hyperplastic, hypertrophic, inflamed, and vulnerable to ROS-induced cellular damage VAT. Accordingly, our ex vivo study showed that VAT of T2DM, but not IFG, females is characterized by upregulation of
Figures
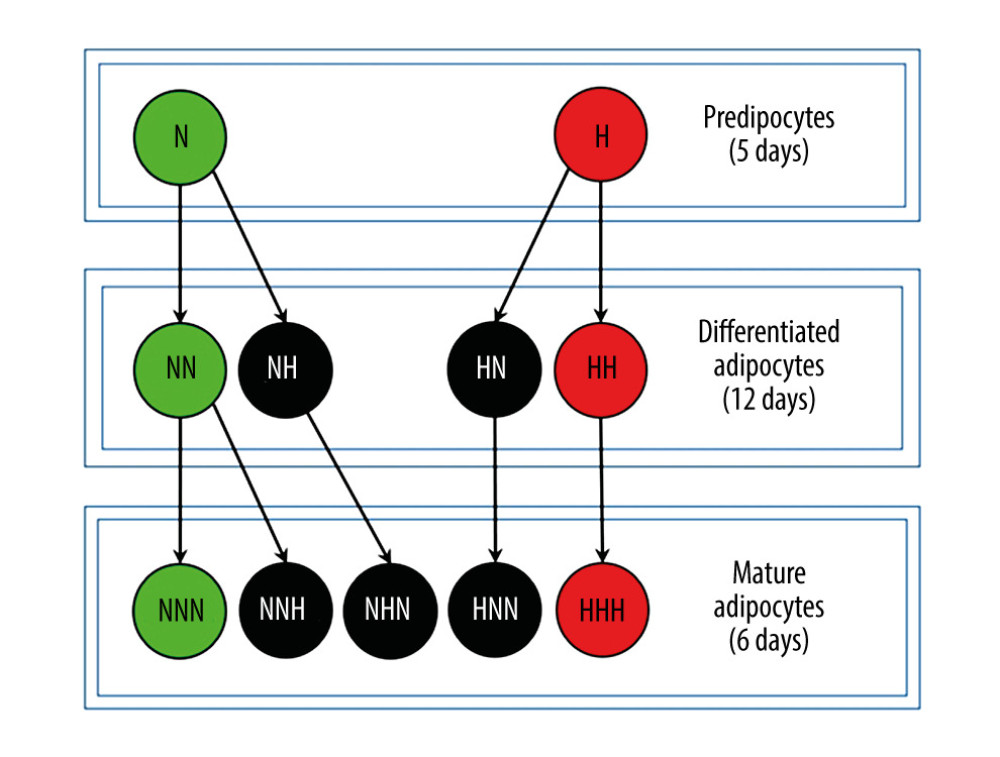 Figure 1. Research model presenting all of the studied variants analyzed along the 3 steps of adipogenesis of HPA-v cells. Letters ‘N’ or ‘H’ denotes respectively normoglycemic (NG) or hyperglycemic (HG) conditions applied in subsequent stages of the cell culture. The advancement of adipogenesis is marked by the number of letters informing about the glycemic conditions. Variants of HPA-v cells cultured in chronic NG are colored green, whereas cells treated with chronic HG are colored red and cells treated with intermittent HG are in black.
 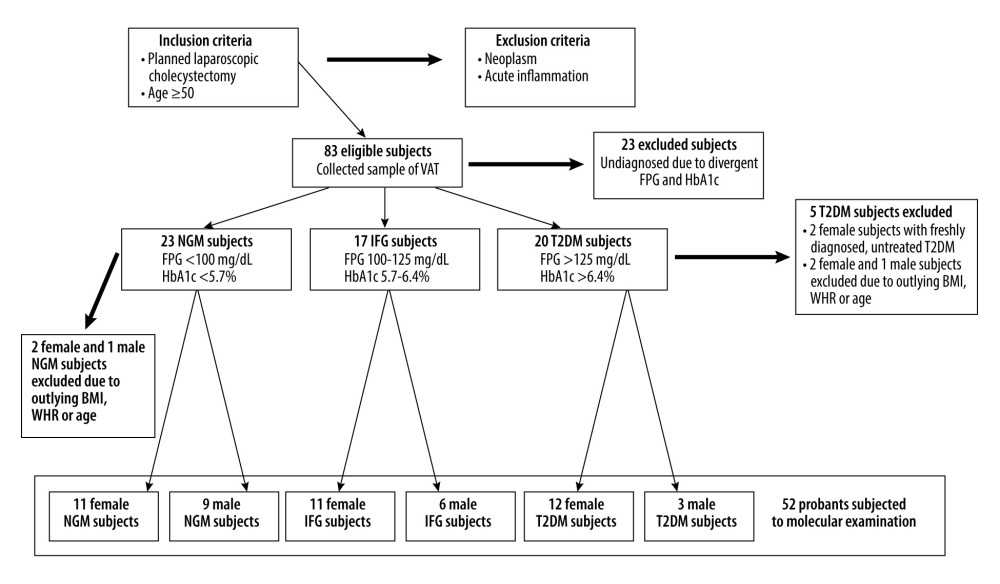 Figure 2. Overview of the ex vivo model presenting the inclusion and a careful selection of the subjects to avoid the influence of age, BMI, and WHR parameters as strong possible confounders of expression of the studied genes and miRNAs.
 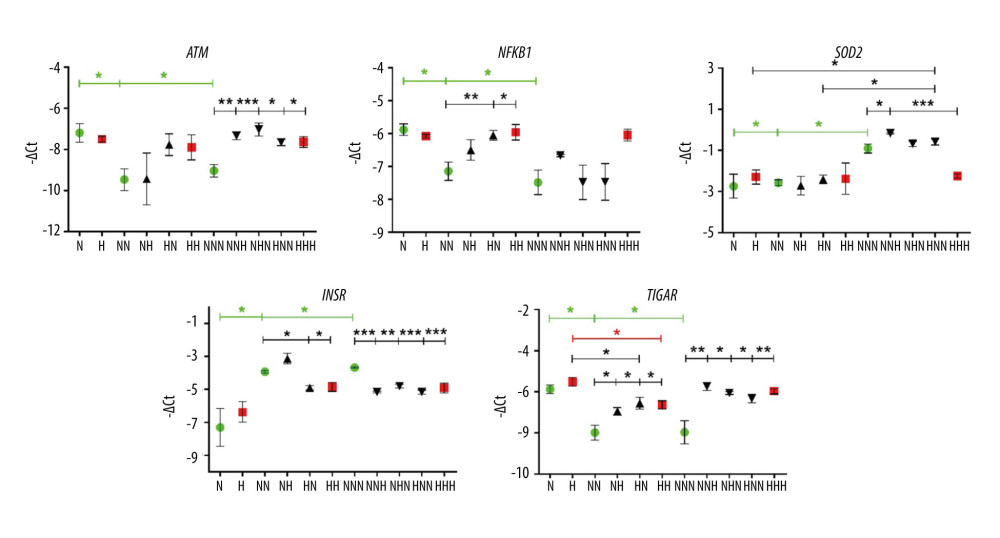 Figure 3. mRNA expression levels of ATM, NFKB1, SOD2, INSR, and TIGAR in visceral preadipocytes (N, H), differentiated (NN, NH, HN, HH), and mature (NNN, NNH, NHN, HNN, HHH) adipocytes in normoglycemic (N, 5.5mM glucose) and hyperglycemic (H, 30 mM) milieu. Data are presented as mean±SD. Green circles mark merely normoglycemic variants (N, NN, NNN) while red squares denote overly hyperglycemic ones (H, HH, HHH) during the process of visceral adipogenesis (tested with ANOVA with post hoc Tukey’s test and marked with green and red asterisks, respectively). Black triangles denote either differentiated or mature adipocytes with single-stage hyperglycemic exposure (NH, HN, NNH, NHN, HNN). Black asterisks were used to mark significant impact of hyperglycemia measured at the stage of preadipocytes (H vs N, by two-tailed t test), differentiated and mature adipocytes (NH, HN, HH vs NN and NNH, NHN, HNN, HHH vs NNN by one-way ANOVA with post hoc Dunnett’s test). Black asterisks were also used to indicate changes occurring during normoglycemic differentiation and maturation of hyperglycemia-treated preadipocytes (H vs HN vs HNN, tested with ANOVA with post hoc Tukey’s test). Conjunct lines below the asterisks denote all significant differences between the first indicated variant on the left and subsequent variants indicated by particular segments. Significant differences are indicated accordingly to the criteria: * 0.05≥P>0.01, ** 0.01≥P>0.001, *** P≤0.001, based on −ΔCt values. The figure was generated using GraphPad Prism 6.0 (GraphPad Software Inc.).
 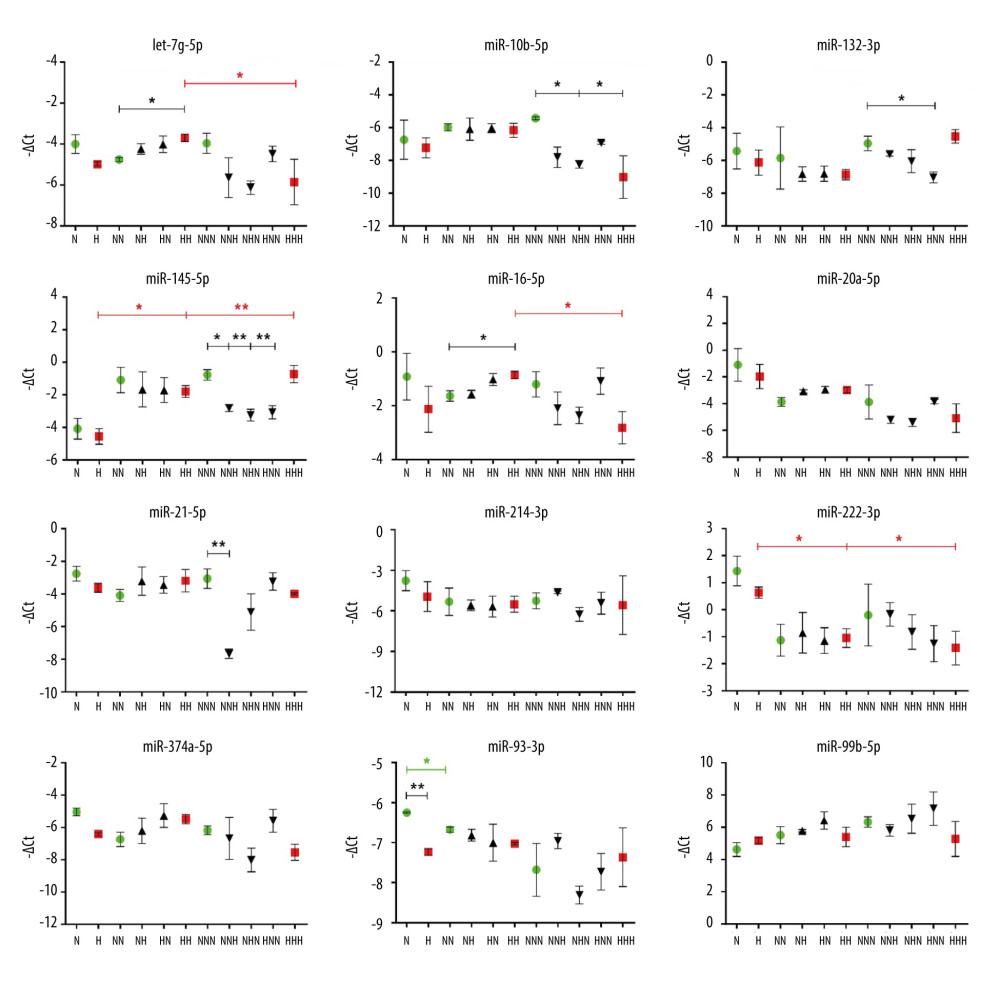 Figure 4. miRNAs expression levels in visceral preadipocytes (N, H), differentiated (NN, NH, HN, HH) and mature (NNN, NNH, NHN, HNN, HHH) adipocytes upon normoglycemic (N, 5.5 mM glucose) and hyperglycemic (H, 30 mM) milieu. Data are presented as mean±SD. Green circles mark merely normoglycemic variants (N, NN, NNN), while red squares denote overly hyperglycemic ones (H, HH, HHH) during the process of visceral adipogenesis (tested with ANOVA with post hoc Tukey’s test and marked with green and red asterisks, respectively). Black triangles denote either differentiated or mature adipocytes with single-stage hyperglycemic exposure (NH, HN, NNH, NHN, HNN). Black asterisks were used to mark significant impact of hyperglycemia measured at the stage of preadipocytes (H vs N, by two-tailed t-test), differentiated and mature adipocytes (NH, HN, HH vs NN and NNH, NHN, HNN, HHH vs NNN by one-way ANOVA with post hoc Dunnett’s test). Black asterisks were also used to indicate changes occurring during normoglycemic differentiation and maturation of hyperglycemia-treated preadipocytes (H vs HN vs HNN, tested with ANOVA with post hoc Tukey’s test). Conjunct lines below the asterisks denote all significant differences between the first indicated variant on the left and subsequent variants indicated by particular segments. Significant differences are indicated accordingly to the criteria: * 0.05≥p>0.01, ** 0.01≥p>0.001, being calculated on −ΔCt values. The figure was generated using GraphPad Prism 6.0 (GraphPad Software Inc.).
 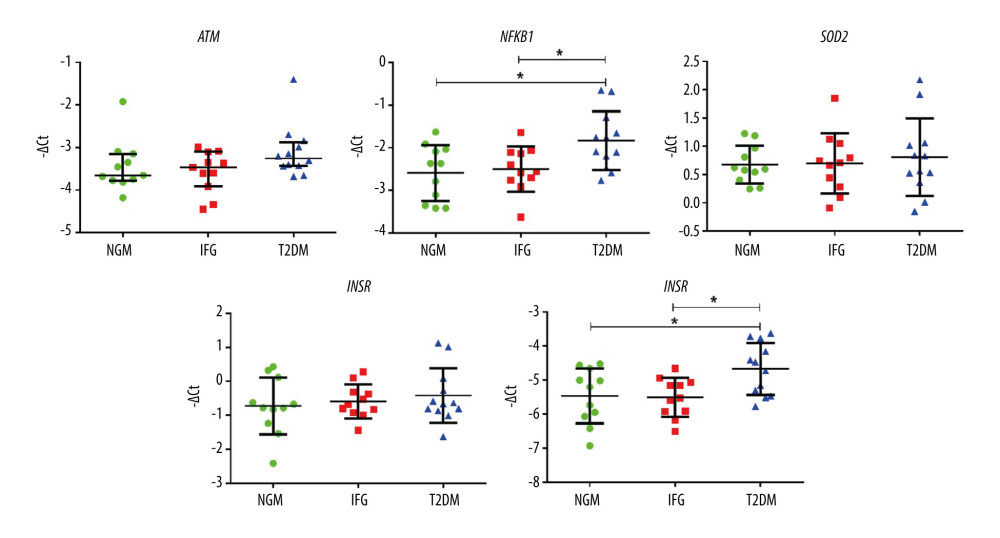 Figure 5. The expression profiles of ATM, NFKB1, SOD2, INSR, and TIGAR among NGM (normal glucose metabolism), IFG (impaired fasting glucose), and T2DM (diabetic) female subjects. Statistics were based on −ΔDCt values and calculated with either one-way ANOVA with post hoc Tukey’s test or Kruskal-Wallis one-way ANOVA with post hoc Dunn’s test. Data are presented as dot plots with either mean±SD or median with interquartile range (ATM). Green dots, red squares, and blue triangles show results obtained for NGM, IFG, and T2DM females, respectively. (*) P≤0.05. The figure was generated using GraphPad Prism 6.0 (GraphPad Software Inc.).
 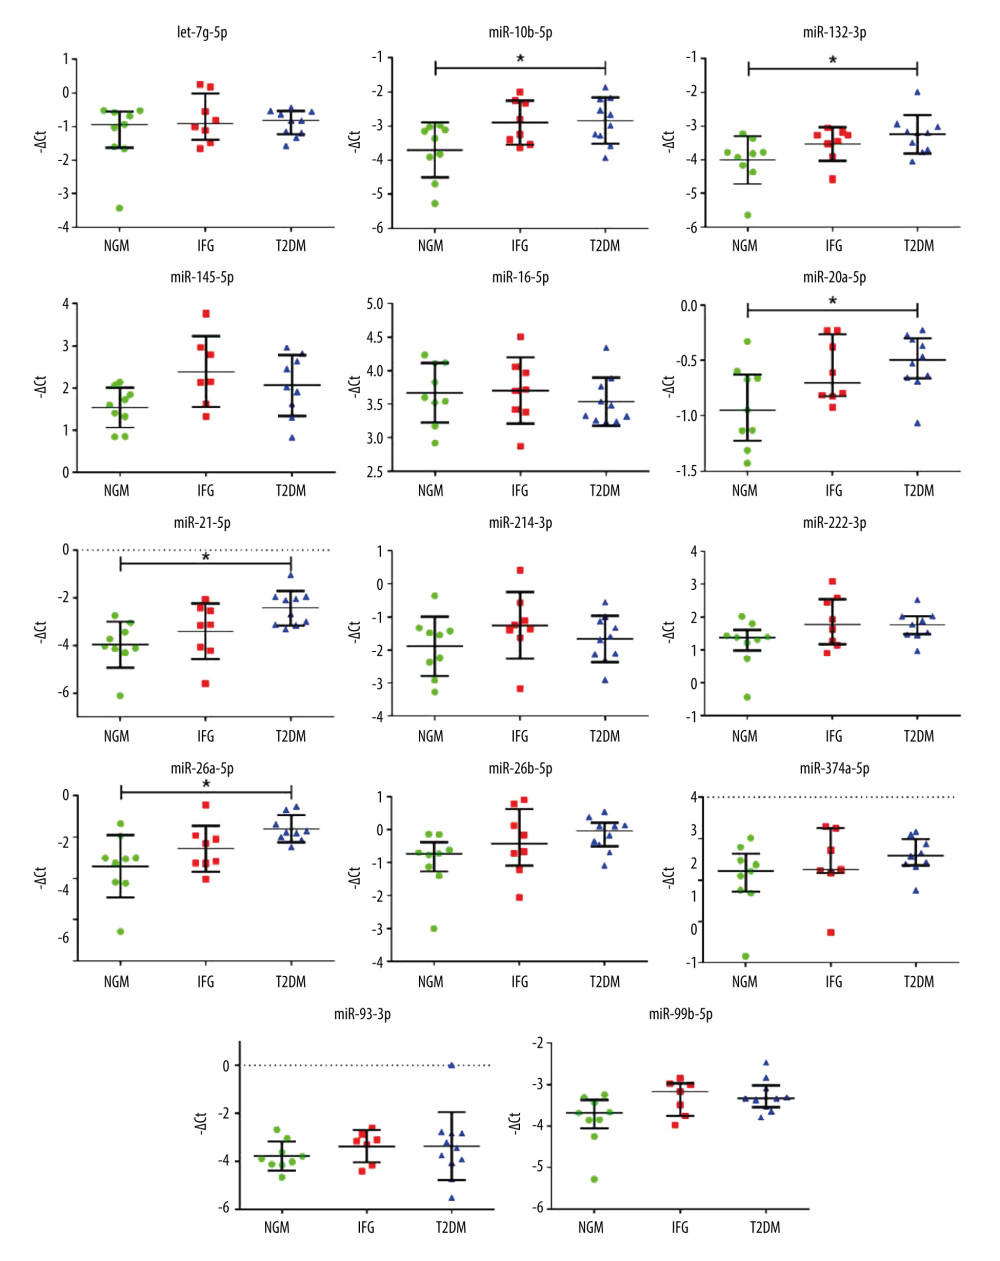 Figure 6. The expression profiles of 14 examined miRNAs among NGM (normal glucose metabolism), IFG (impaired fasting glucose), and T2DM (diabetic) subjects only. Statistics were based on −ΔCt values and calculated with either one-way ANOVA with post hoc Tukey’s test or Kruskal-Wallis one-way ANOVA with post hoc Dunn’s test. Data are presented as dot plots with either mean±SD or median with interquartile range (let-7g-5p, miR-20a-5p, miR-222-3p, miR-26b-5p, miR-374a-5p and miR-99b-5p). Green dots, red squares, and blue triangles show results obtained for NGM, IFG, and T2DM females, respectively. (*) P≤0.05. The figure was generated using GraphPad Prism 6.0 (GraphPad Software Inc.).
 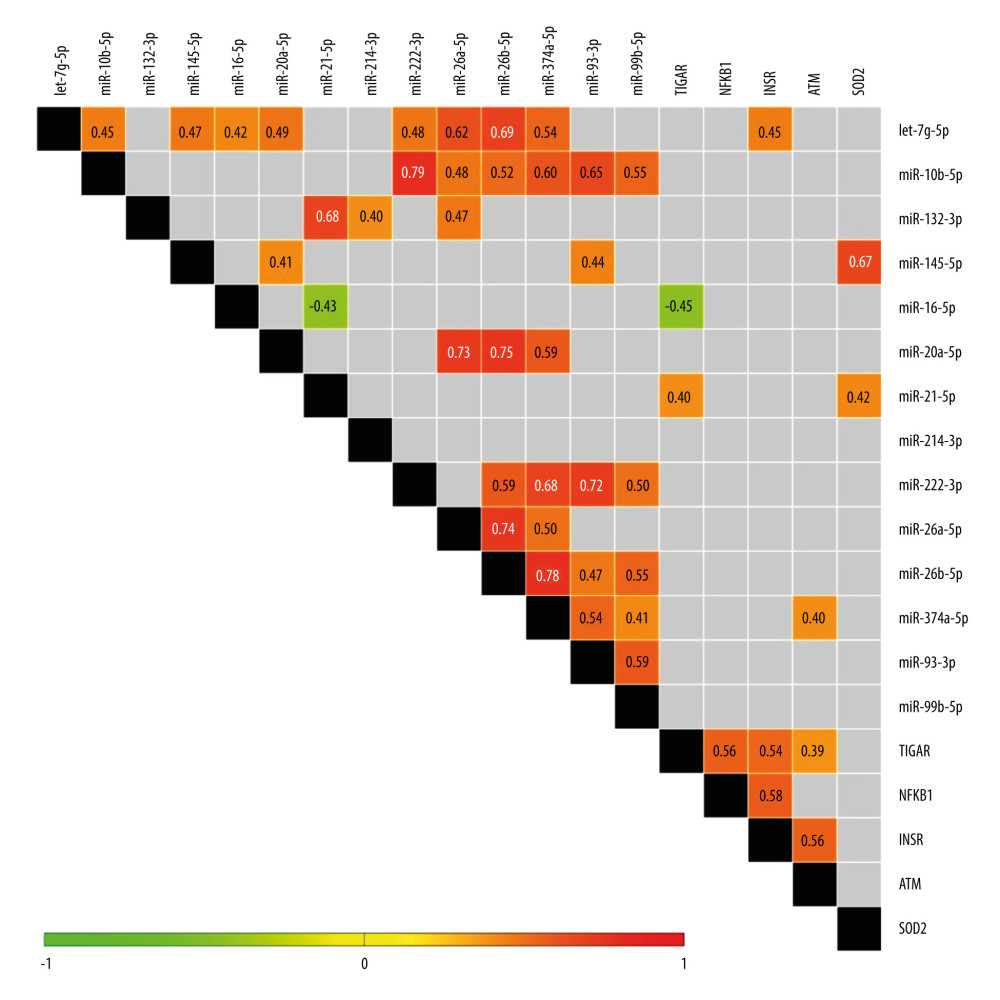 Figure 7. Heatmap of correlations among expression levels of miRNAs and mRNAs of examined genes (−ΔCt values) for female study participants. Only significant Spearman rank correlation coefficients are presented in particular squares (P<0.05). The figure was generated using MultiExperimentViewer software, version 4.9.0 (The Perl Foundation).
 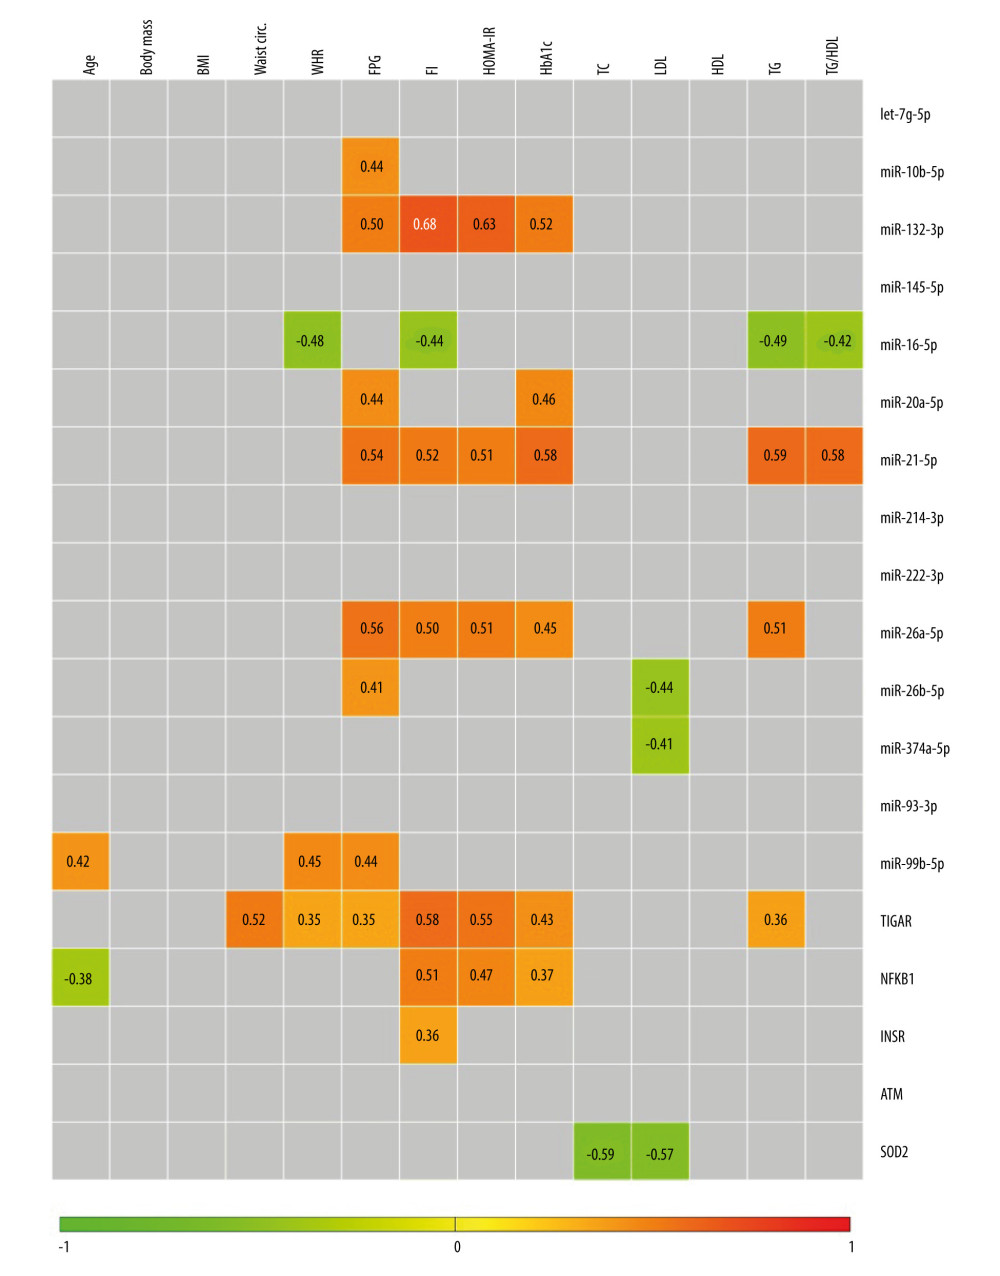 Figure 8. Heatmap of correlation among expression levels of miRNAs and mRNAs of examined genes (−ΔCt values) and age as well as anthropometric and biochemical parameters in female study participants. Only significant Spearman rank correlation coefficients are presented in particular squares (P<0.05). The figure was generated using MultiExperimentViewer software, version 4.9.0 (The Perl Foundation).
 Tables
Table 1. A list of studied miRNAs and their target genes.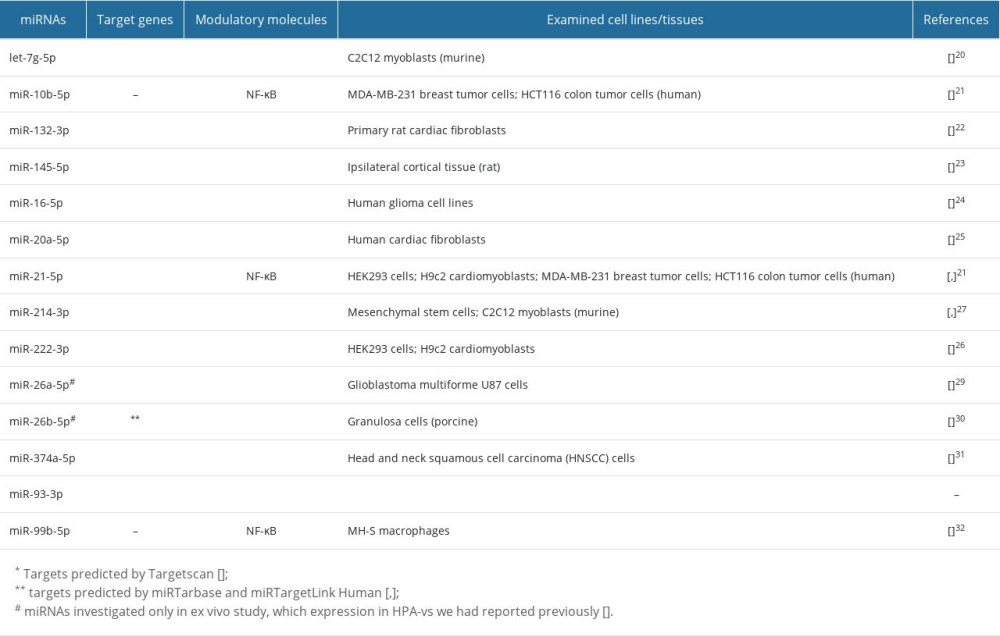 Table 2. A list of the studied genes and respective TaqMan assay IDs.
 Table 3. A list of the studied miRNAs and respective TaqMan assay IDs.
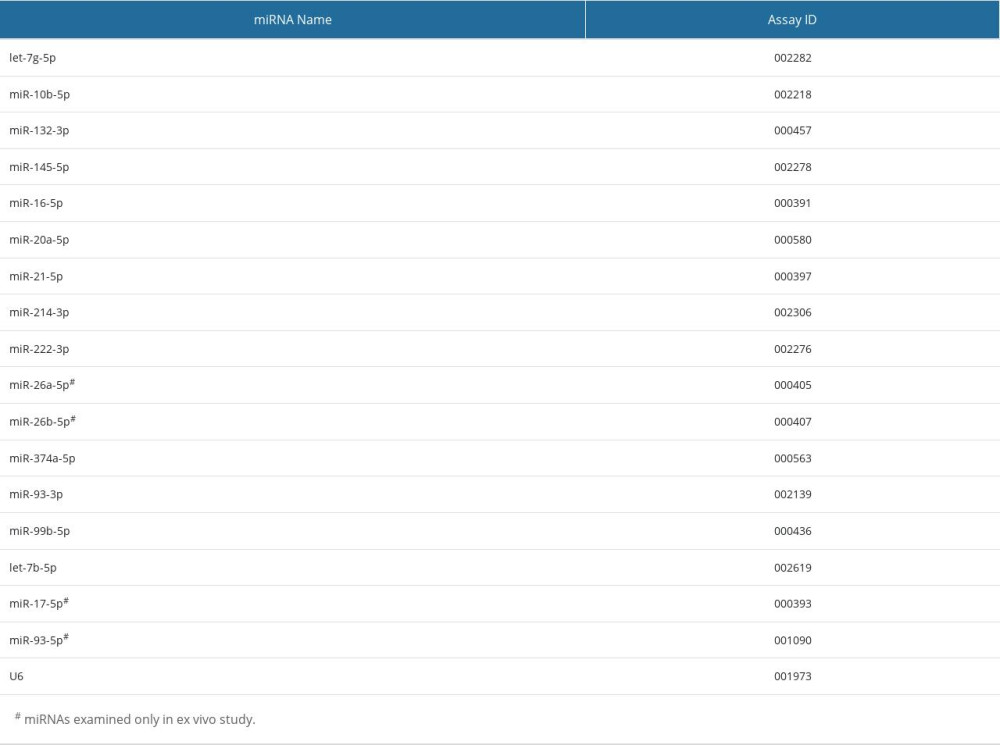 Table 4. In silico analysis involving 5 upregulated miRNAs (miR-10b-5p, miR-132-3p, miR-20a-5p, miR-21-5p, and miR-26a-5p) in VAT of T2DM female subjects based on miEAA (WikiPathways, miRPathDB). Only significant records are shown (P<0.05), for at least 4 union miRNAs.
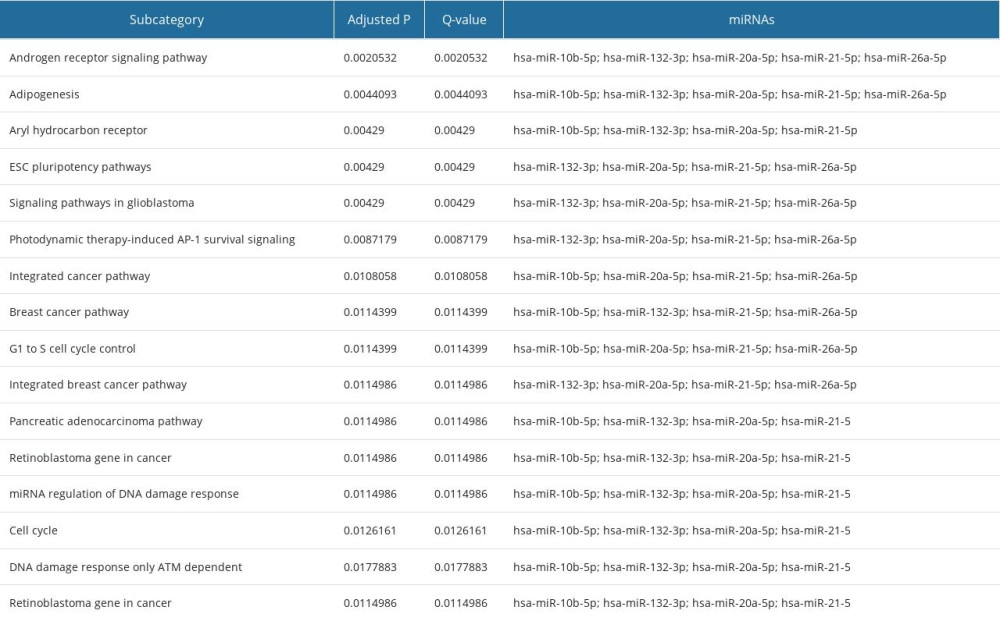 Supplementary Table 1. Characteristics of 52 study participants. Data is presented as median with an interquartile range, while differences among 3 study groups were evaluated with Kruskal-Wallis one-way analysis of variance (ANOVA) with Dunn’s post hoc test. Study groups were as follows: NGM (normal glucose metabolism), IFG (impaired fasting glucose) and T2DM (diabetic).
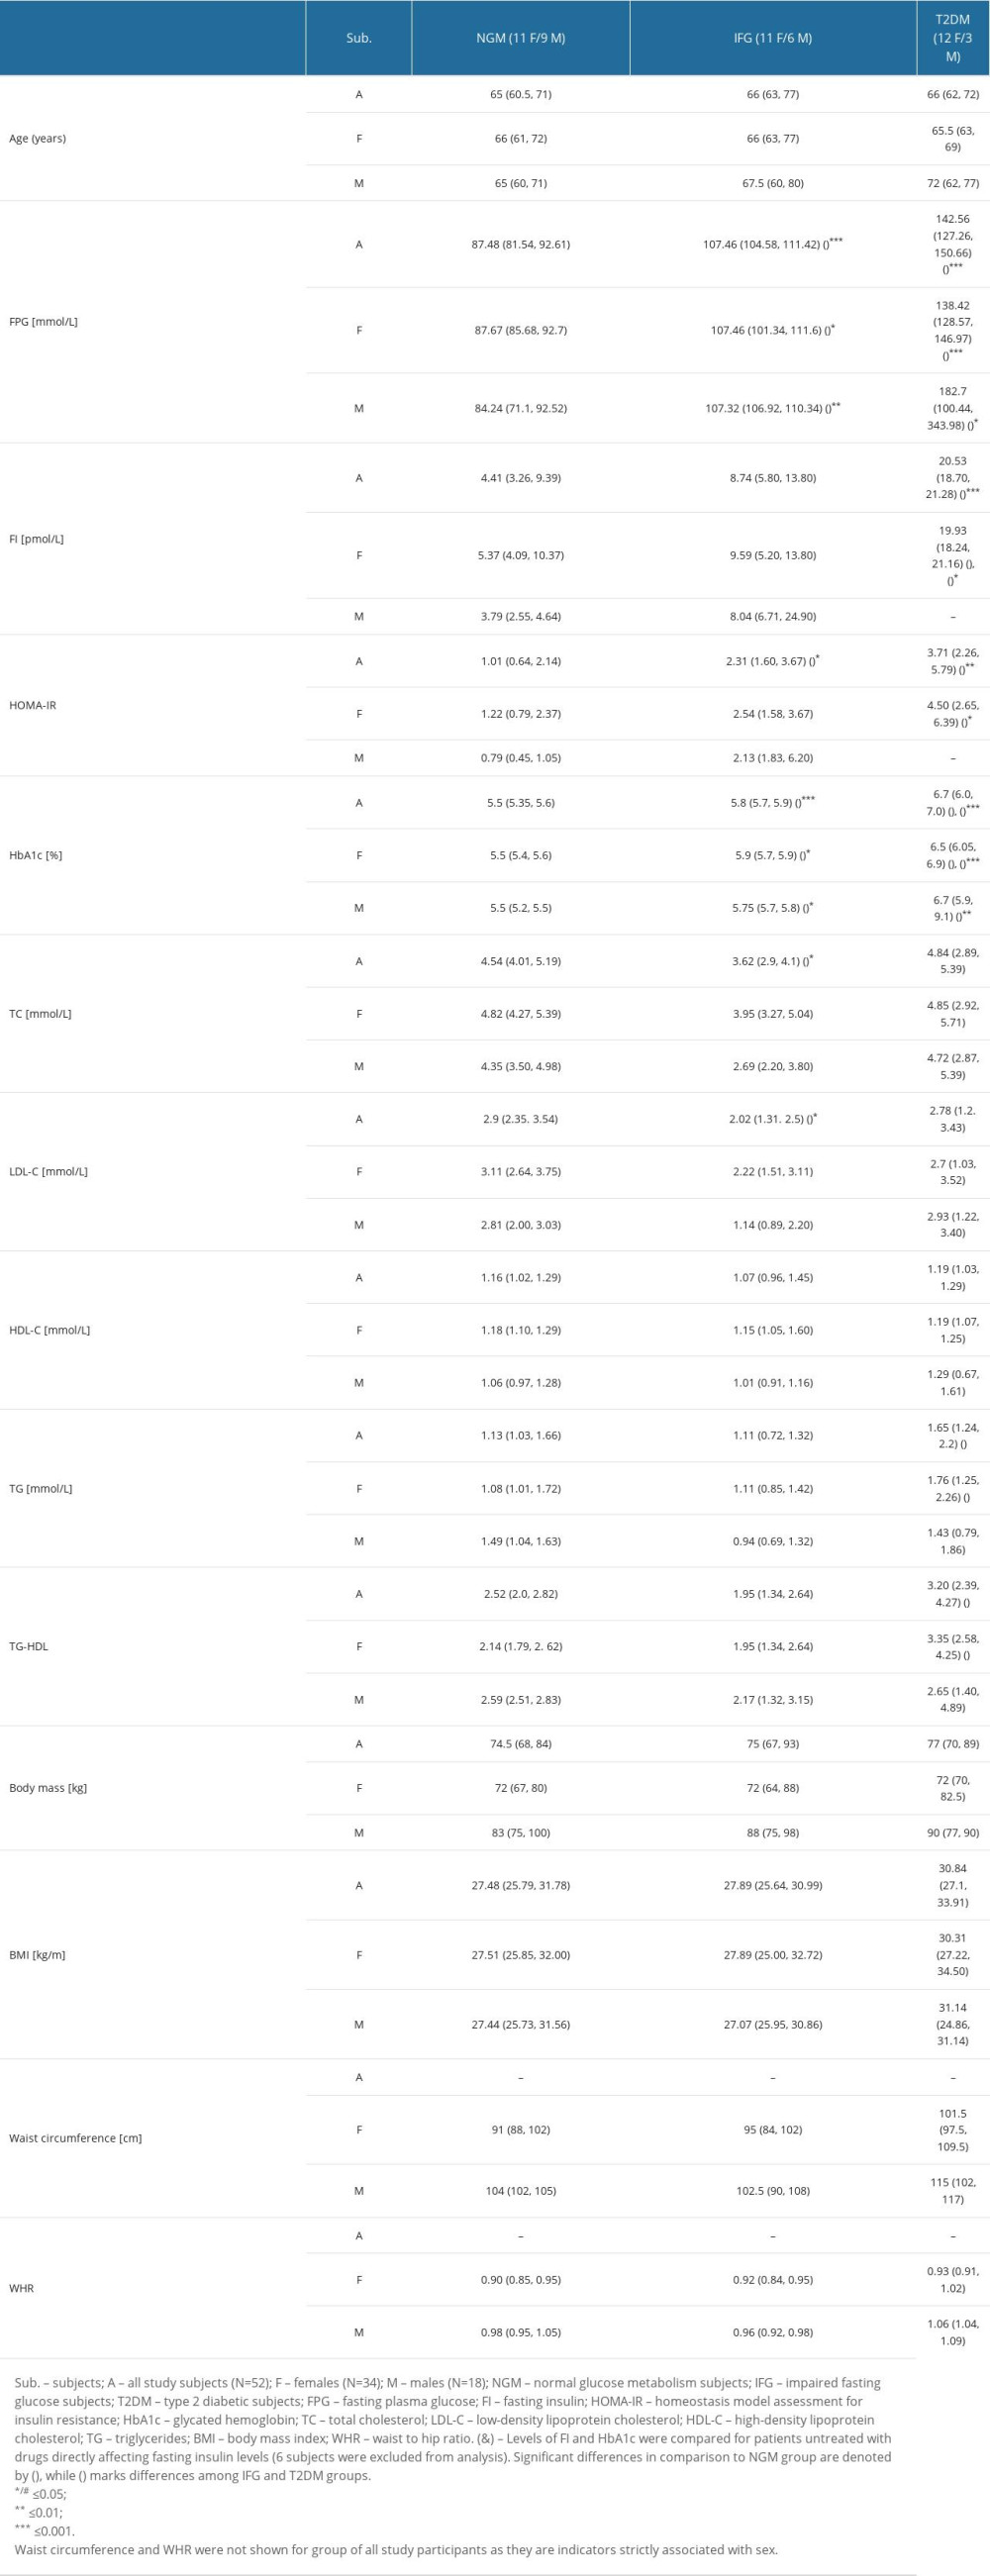 Supplementary Table 2. Mean or median 2^-ΔCt values found for tested miRNAs and genes in VAT of male study subjects. Median was calculated for let-7g-5p, miR-20a-5p, miR-222-3p, miR-26b-5p, miR-374a-5p, miR-99b-5p and ATM. None of tested molecules was significantly changed.
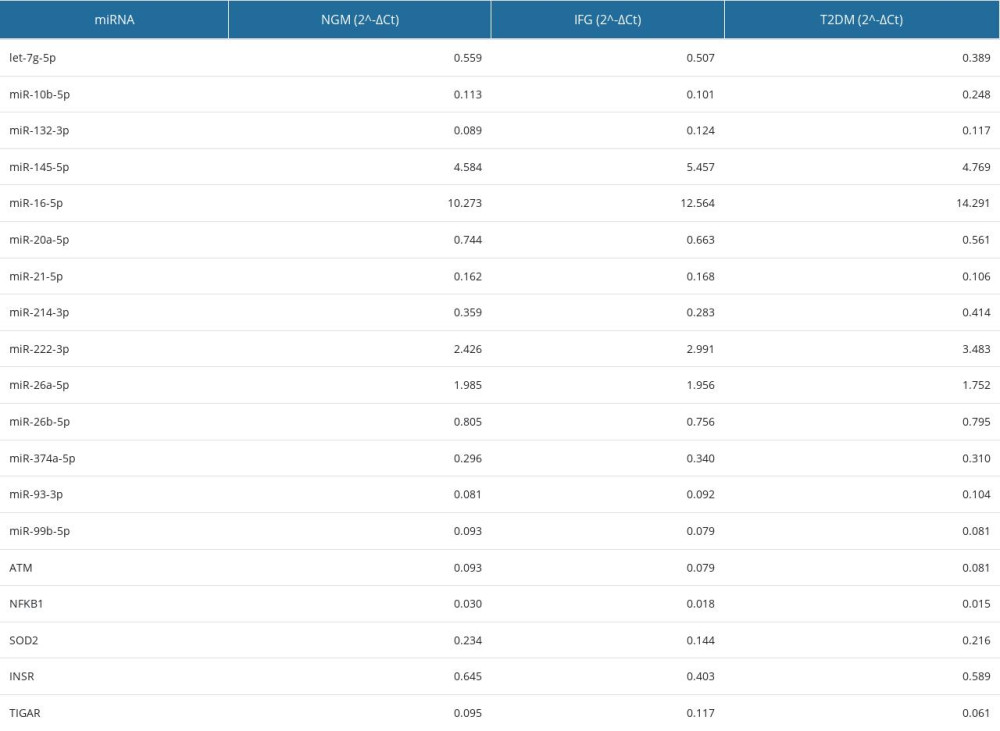 Supplementary Table 3. Top 25 results of in silico analysis of 5 upregulated miRNAs in VAT of T2DM females by miRSystem.
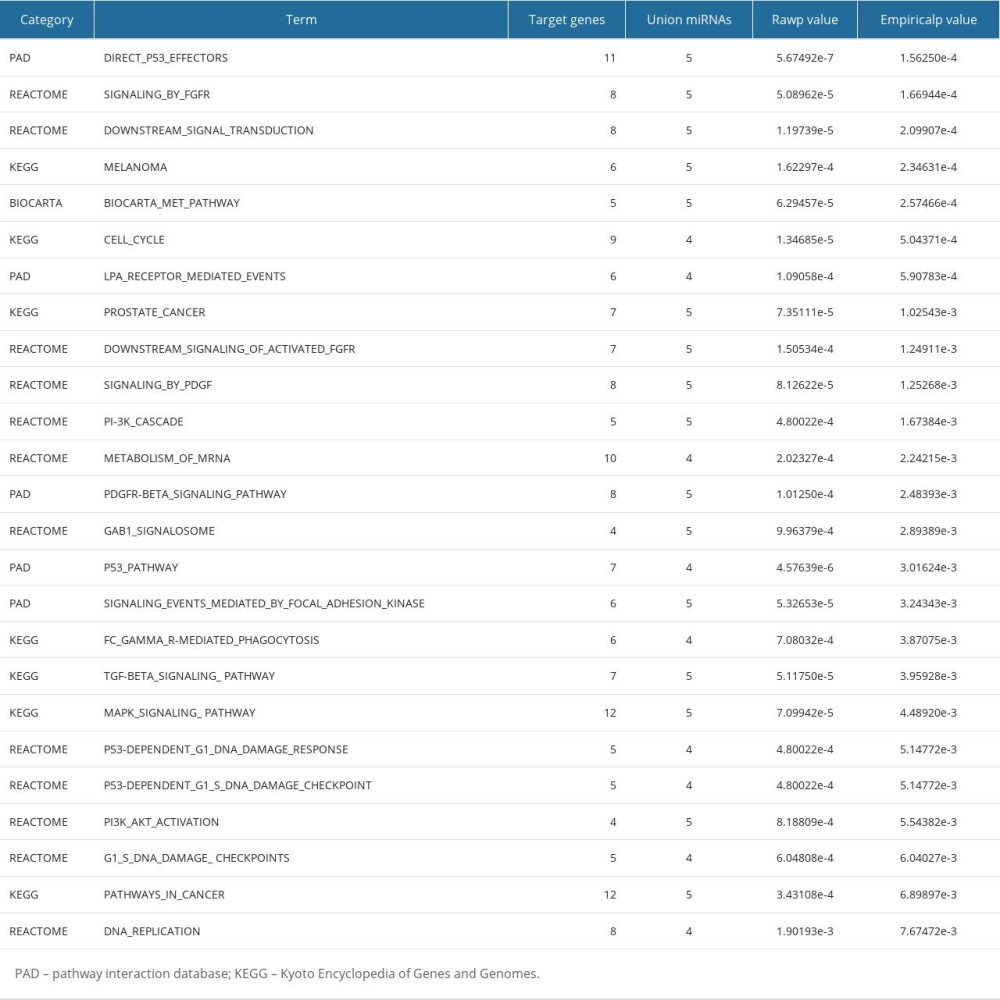
References
1. Ng ACT, Delgado V, Borlaug BA, Bax JJ, Diabesity: The combined burden of obesity and diabetes on heart disease and the role of imaging: Nat Rev Cardiol, 2021; 18(4); 291-304
2. Jayedi A, Soltani S, Motlagh SZT, Anthropometric and adiposity indicators and risk of type 2 diabetes: Systematic review and dose-response meta-analysis of cohort studies: BMJ, 2022; 376; e067516
3. Alwash SM, McIntyre HD, Mamun A, The association of general obesity, central obesity and visceral body fat with the risk of gestational diabetes mellitus: Evidence from a systematic review and meta-analysis: Obes Res Clin Pract, 2021; 15(5); 425-30
4. Wang D, Fang R, Han H, Association between visceral adiposity index and risk of prediabetes: A meta-analysis of observational studies: J Diabetes Investig, 2022; 13(3); 543-51
5. Park HS, Lee K, Greater beneficial effects of visceral fat reduction compared with subcutaneous fat reduction on parameters of the metabolic syndrome: A study of weight reduction programmes in subjects with visceral and subcutaneous obesity: Diabet Med, 2005; 22(3); 266-72
6. Duan K, Yan X, Gao Z, Effect of glucagon-like peptide-1 receptor agonists on fat distribution in patients with type 2 diabetes: A systematic review and meta-analysis: J Diabetes Investig, 2022; 13(7); 1149-60
7. Wei Q, Xu X, Guo L, Effect of SGLT2 inhibitors on type 2 diabetes mellitus with non-alcoholic fatty liver disease: A meta-analysis of randomized controlled trials: Front Endocrinol (Lausanne), 2021; 12; 635556
8. Kanigur Sultuybek G, Soydas T, Yenmis G, NF-κB as the mediator of metformin’s effect on ageing and ageing-related diseases: Clin Exp Pharmacol Physiol, 2019; 46(5); 413-22
9. Ying W, Riopel M, Bandyopadhyay G, Adipose tissue macrophage-derived exosomal miRNAs can modulate in vivo and in vitro insulin sensitivity: Cell, 2017; 171(2); 372-384e12
10. Kim Y, Kim OK, Potential roles of adipocyte extracellular vesicle-derived miRNAs in obesity-mediated insulin resistance: Adv Nutr, 2021; 12(2); 566-74
11. Ali AT, Hochfeld WE, Myburgh R, Pepper MS, Adipocyte and adipogenesis: Eur J Cell Biol, 2013; 92(6–7); 229-36
12. Nunez Lopez YO, Garufi G, Seyhan AA, Altered levels of circulating cytokines and microRNAs in lean and obese individuals with prediabetes and type 2 diabetes: Mol Biosyst, 2016; 13(1); 106-21
13. Strycharz J, Wróblewski A, Zieleniak A, Visceral adipose tissue of prediabetic and diabetic females shares a set of similarly upregulated microRNAs functionally annotated to inflammation, oxidative stress and insulin signaling: Antioxidants (Basel), 2021; 10(1); 101
14. Wasserman DH, Wang TJ, Brown NJ, The vasculature in prediabetes: Circ Res, 2018; 122(8); 1135-50
15. Oliviero A, Della Porta G, Peretti GM, Maffulli N, MicroRNA in osteoarthritis: Physiopathology, diagnosis and therapeutic challenge: Br Med Bull, 2019; 130(1); 137-47
16. Kim JS, Pak K, Goh TS, Prognostic value of microRNAs in coronary artery diseases: A meta-analysis: Yonsei Med J, 2018; 59(4); 495-500
17. Milluzzo A, Maugeri A, Barchitta M, Epigenetic mechanisms in type 2 diabetes retinopathy: A systematic review: Int J Mol Sci, 2021; 22(19); 10502
18. Zailaie SA, Siddiqui JJ, Al Saadi RM, Serum based miRNA as a diagnostic biomarker for multiple sclerosis: A systematic review and meta-analysis: Immunol Invest, 2022; 51(4); 947-62
19. Diener C, Keller A, Meese E, Emerging concepts of miRNA therapeutics: From cells to clinic: Trends Genet, 2022; 38(6); 613-26
20. Zhu H, Shyh-Chang N, Segrè AV, The Lin28/let-7 axis regulates glucose metabolism: Cell, 2011; 147(1); 81-94
21. Li X, Gao L, Cui Q, Sulindac inhibits tumor cell invasion by suppressing NF-κB-mediated transcription of microRNAs: Oncogene, 2012; 31(48); 4979-86
22. Eskildsen TV, Schneider M, Sandberg MB, The microRNA-132/212 family fine-tunes multiple targets in Angiotensin II signalling in cardiac fibroblasts: J Renin Angiotensin Aldosterone Syst, 2015; 16(4); 1288-97
23. Dharap A, Bowen K, Place R, Li LC, Vemuganti R, Transient focal ischemia induces extensive temporal changes in rat cerebral microRNAome: J Cereb Blood Flow Metab, 2009; 29(4); 675-87
24. Yang TQ, Lu XJ, Wu TF, MicroRNA-16 inhibits glioma cell growth and invasion through suppression of BCL2 and the nuclear factor-κB1/MMP9 signaling pathway: Cancer Sci, 2014; 105(3); 265-71
25. Schimmel K, Stojanović SD, Huang CK, Combined high-throughput library screening and next generation RNA sequencing uncover microRNAs controlling human cardiac fibroblast biology: J Mol Cell Cardiol, 2021; 150; 91-100
26. Dubois-Deruy E, Cuvelliez M, Fiedler J, MicroRNAs regulating superoxide dismutase 2 are new circulating biomarkers of heart failure: Sci Rep, 2017; 7(1); 14747
27. Lei X, He N, Zhu L, Mesenchymal stem cell-derived extracellular vesicles attenuate radiation-induced lung injury via miRNA-214-3p: Antioxid Redox Signal, 2021; 35(11); 849-62
28. Honardoost M, Soleimani M, Arefian E, Sarookhani MR, Expression change of miR-214 and miR-135 during muscle differentiation: Cell J, 2015; 17(3); 461-70
29. Guo P, Lan J, Ge J, MiR-26a enhances the radiosensitivity of glioblastoma multiforme cells through targeting of ataxia-telangiectasia mutated: Exp Cell Res, 2014; 320(2); 200-8
30. Lin F, Li R, Pan ZX, miR-26b promotes granulosa cell apoptosis by targeting ATM during follicular atresia in porcine ovary: PLoS One, 2012; 7(6); e38640
31. Huang Y, Chuang A, Hao H, Phospho-ΔNp63α is a key regulator of the cisplatin-induced microRNAome in cancer cells: Cell Death Differ, 2011; 18(7); 1220-30
32. Zhao J, Xie F, Chen R, Transcription factor NF-κB promotes acute lung injury via microRNA-99b-mediated PRDM1 down-regulation: J Biol Chem, 2020; 295(52); 18638-48
33. Agarwal V, Bell GW, Nam JW, Bartel DP, Predicting effective microRNA target sites in mammalian mRNAs: Elife, 2015; 4; e05005
34. Kern F, Aparicio-Puerta E, Li Y, miRTargetLink 2.0-interactive miRNA target gene and target pathway networks: Nucleic Acids Res, 2021; 49(W1); W409-W16
35. Huang HY, Lin YCD, Li J, miRTarBase 2020: Updates to the experimentally validated microRNA-target interaction database: Nucleic Acids Res, 2020; 48(D1); D148-D54
36. Wróblewski A, Strycharz J, Świderska E, Chronic and transient hyperglycemia induces changes in the expression patterns of IL6 and ADIPOQ genes and their associated epigenetic modifications in differentiating human visceral adipocytes: Int J Mol Sci, 2021; 22(13); 6964
37. Strycharz J, Drzewoski J, Szemraj J, Sliwinska A, Is p53 involved in tissue-specific insulin resistance formation?: Oxid Med Cell Longev, 2017; 2017; 9270549
38. Świderska E, Podolska M, Strycharz J, Hyperglycemia changes expression of key adipogenesis markers (C/EBPα and PPARγ) and morphology of differentiating human visceral adipocytes: Nutrients, 2019; 11(8); 1835
39. Xie F, Xiao P, Chen D, miRDeepFinder: A miRNA analysis tool for deep sequencing of plant small RNAs: Plant Mol Biol, 2012 [Online ahead of print]
40. Strycharz J, Świderska E, Wróblewski A, Hyperglycemia affects miRNAs expression pattern during adipogenesis of human visceral adipocytes – is memorization involved?: Nutrients, 2018; 10(11); 1774
41. Akcakaya A, Okan I, Bas G, Does the difficulty of laparoscopic cholecystectomy differ between genders?: Indian J Surg, 2015; 77(Suppl 2); 452-56
42. Chauhan A, Singhal A, Goyal P, TG/HDL Ratio: A marker for insulin resistance and atherosclerosis in prediabetics or not?: J Fam Med Prim Care, 2021; 10(10); 3700-5
43. Lu TP, Lee CY, Tsai MH, MiRSystem: An integrated system for characterizing enriched functions and pathways of microRNA targets: PLoS One, 2012; 7(8); e42390
44. Saeed AI, Sharov V, White J, TM4: A free, open-source system for microarray data management and analysis: Biotechniques, 2003; 34(2); 374-78
45. Mach F, Baigent C, Catapano AL, 2019 ESC/EAS Guidelines for the management of dyslipidaemias: Lipid modification to reduce cardiovascular risk: Eur Heart J, 2020; 41(1); 111-88
46. Dulkadiroğlu E, Özden H, Demİrcİ Hü, The evaluation of intracellular energy metabolism in prediabetic patients and patients newly diagnosed with type 2 diabetes mellitus: Turkish J Med Sci, 2021; 51(1); 238-45
47. Cignarelli A, Genchi VA, Perrini S, Insulin and insulin receptors in adipose tissue development: Int J Mol Sci, 2019; 20(3); 759
48. García-Escobar E, Rodríguez-Pacheco F, Haro-Mora JJ, Effect of insulin analogues on 3t3-l1 adipogenesis and lipolysis: Eur J Clin Invest, 2011; 41(9); 979-86
49. Higuchi M, Dusting GJ, Peshavariya H, Differentiation of human adipose-derived stem cells into fat involves reactive oxygen species and Forkhead box O1 mediated upregulation of antioxidant enzymes: Stem Cells Dev, 2013; 22(6); 878-88
50. Andersen E, Ingerslev LR, Fabre O, Preadipocytes from obese humans with type 2 diabetes are epigenetically reprogrammed at genes controlling adipose tissue function: Int J Obes (Lond), 2019; 43(2); 306-18
51. Sen S, Domingues CC, Rouphael C, Genetic modification of human mesenchymal stem cells helps to reduce adiposity and improve glucose tolerance in an obese diabetic mouse model: Stem Cell Res Ther, 2015; 6; 242
52. Ding X, Jian T, Wu Y, Ellagic acid ameliorates oxidative stress and insulin resistance in high glucose-treated HepG2 cells via miR-223/keap1-Nrf2 pathway: Biomed Pharmacother, 2019; 110; 85-94
53. Li L, Zeng H, He X, Chen JX, Sirtuin 3 alleviates diabetic cardiomyopathy by regulating TIGAR and cardiomyocyte metabolism: J Am Heart Assoc, 2021; 10(5); e018913
54. Zhao H, Zhang J, Yu J, HMGB-1 as a potential target for the treatment of diabetic retinopathy: Med Sci Monit, 2015; 21; 3062-67
55. Srivastava A, Shankar K, Beg M, Chronic hyperinsulinemia induced miR-27b is linked to adipocyte insulin resistance by targeting insulin receptor: J Mol Med (Berl), 2018; 96(3–4); 315-31
56. Włodarski A, Strycharz J, Wróblewski A, The role of microRNAs in metabolic syndrome-related oxidative stress: Int J Mol Sci, 2020; 21(18); 6902
57. Hamar P, Role of regulatory micro RNAs in type 2 diabetes mellitus-related inflammation: Nucleic Acid Ther, 2012; 22(5); 289-94
58. Camarena V, Sant D, Mohseni M, Novel atherogenic pathways from the differential transcriptome analysis of diabetic epicardial adipose tissue: Nutr Metab Cardiovasc Dis, 2017; 27(8); 739-50
59. Feng H, Su R, Song Y, Positive Correlation between enhanced expression of TLR4/MyD88/NF-κB with insulin resistance in placentae of gestational diabetes mellitus: PLoS One, 2016; 11(6); e0157185
60. Gómez-Serrano M, Camafeita E, López JA, Differential proteomic and oxidative profiles unveil dysfunctional protein import to adipocyte mitochondria in obesity-associated aging and diabetes: Redox Biol, 2017; 11; 415-28
61. Arcidiacono B, Chiefari E, Foryst-Ludwig A, Obesity-related hypoxia via miR-128 decreases insulin-receptor expression in human and mouse adipose tissue promoting systemic insulin resistance: EBioMedicine, 2020; 59; 102912
62. Pereira MJ, Thombare K, Sarsenbayeva A, Direct effects of glucagon on glucose uptake and lipolysis in human adipocytes: Mol Cell Endocrinol, 2020; 503; 110696
63. Chen Y, Zhang Z, Zhu D, Long non-coding RNA MEG3 serves as a ceRNA for microRNA-145 to induce apoptosis of AC16 cardiomyocytes under high glucose condition: Biosci Rep, 2019; 39(6); BSR20190444
64. Chen M, Zhang Y, Li W, Yang J, MicroRNA-145 alleviates high glucose-induced proliferation and migration of vascular smooth muscle cells through targeting ROCK1: Biomed Pharmacother, 2018; 99; 81-86
65. Shyu KG, Cheng WP, Wang BW, Angiotensin II downregulates microRNA-145 to regulate Kruppel-like factor 4 and myocardin expression in human coronary arterial smooth muscle cells under high glucose conditions: Mol Med, 2015; 21(1); 616-25
66. Costantino S, Paneni F, Lüscher TF, Cosentino F, MicroRNA profiling unveils hyperglycaemic memory in the diabetic heart: Eur Heart J, 2016; 37(6); 572-76
67. Sun J, Xu Y, Dai Z, Sun Y, Intermittent high glucose stimulate MCP-l, IL-18, and PAI-1, but inhibit adiponectin expression and secretion in adipocytes dependent of ROS: Cell Biochem Biophys, 2009; 55(3); 173-80
68. Zhou J, Yang J, Wang X, A novel regulatory circuit “C/EBPα/miR-20a-5p/TOB2” regulates adipogenesis and lipogenesis: Front Endocrinol (Lausanne), 2019; 10; 894
69. Nunez Lopez YO, Casu A, Kovacova Z, Coordinated regulation of gene expression and microRNA changes in adipose tissue and circulating extracellular vesicles in response to pioglitazone treatment in humans with type 2 diabetes: Front Endocrinol (Lausanne), 2022; 13; 955593
70. Zhu H, Leung SW, Identification of microRNA biomarkers in type 2 diabetes: A meta-analysis of controlled profiling studies: Diabetologia, 2015; 58(5); 900-11
71. Rawal S, Munasinghe PE, Shindikar A, Down-regulation of proangiogenic microRNA-126 and microRNA-132 are early modulators of diabetic cardiac microangiopathy: Cardiovasc Res, 2017; 113(1); 90-101
72. La Sala L, Tagliabue E, Mrakic-Sposta S, Lower miR-21/ROS/HNE levels associate with lower glycemia after habit-intervention: DIAPASON study 1-year later: Cardiovasc Diabetol, 2022; 21(1); 35
73. Wojciechowska G, Szczerbinski L, Kretowski M, Exploring microRNAs as predictive biomarkers for type 2 diabetes mellitus remission after sleeve gastrectomy: A pilot study: Obesity (Silver Spring), 2022; 30(2); 435-46
74. Tao W, Dong X, Kong G, Elevated circulating hsa-miR-106b, hsa-miR-26a, and hsa-miR-29b in type 2 diabetes mellitus with diarrhea-predominant irritable bowel syndrome: Gastroenterol Res Pract, 2016; 2016; 9256209
75. Fang W, Guo J, Cao Y, MicroRNA-20a-5p contributes to hepatic glycogen synthesis through targeting p63 to regulate p53 and PTEN expression: J Cell Mol Med, 2016; 20(8); 1467-80
76. Zhang B, Yang Y, Xiang L, Adipose-derived exosomes: A novel adipokine in obesity-associated diabetes: J Cell Physiol, 2019; 234(10); 16692-702
77. Gan M, Shen L, Wang S, Genistein inhibits high fat diet-induced obesity through miR-222 by targeting BTG2 and adipor1: Food Funct, 2020; 11(3); 2418-26
78. Herrera BM, Lockstone HE, Taylor JM, Global microRNA expression profiles in insulin target tissues in a spontaneous rat model of type 2 diabetes: Diabetologia, 2010; 53(6); 1099-109
79. Fu X, Dong B, Tian Y, MicroRNA-26a regulates insulin sensitivity and metabolism of glucose and lipids: J Clin Invest, 2015; 125(6); 2497-509
80. Ortega FJ, Moreno-Navarrete JM, Pardo G, MiRNA expression profile of human subcutaneous adipose and during adipocyte differentiation: PLoS One, 2010; 5(2); e9022
81. Assmann TS, Milagro FI, Martínez JA, Crosstalk between microRNAs, the putative target genes and the lncRNA network in metabolic diseases: Mol Med Rep, 2019; 20(4); 3543-54
82. Diaz G, Zamboni F, Tice A, Farci P, Integrated ordination of miRNA and mRNA expression profiles: BMC Genomics, 2015; 16; 767
83. Link JC, Hasin-Brumshtein Y, Cantor RM, Diet, gonadal sex, and sex chromosome complement influence white adipose tissue miRNA expression: BMC Genomics, 2017; 18(1); 89
84. Mentzel CMJ, Anthon C, Jacobsen MJ, Gender and obesity specific MicroRNA expression in adipose tissue from lean and obese pigs: PLoS One, 2015; 10(7); e0131650
Errate
Figures
Figure 1. Research model presenting all of the studied variants analyzed along the 3 steps of adipogenesis of HPA-v cells. Letters ‘N’ or ‘H’ denotes respectively normoglycemic (NG) or hyperglycemic (HG) conditions applied in subsequent stages of the cell culture. The advancement of adipogenesis is marked by the number of letters informing about the glycemic conditions. Variants of HPA-v cells cultured in chronic NG are colored green, whereas cells treated with chronic HG are colored red and cells treated with intermittent HG are in black.Figure 2. Overview of the ex vivo model presenting the inclusion and a careful selection of the subjects to avoid the influence of age, BMI, and WHR parameters as strong possible confounders of expression of the studied genes and miRNAs.Figure 3. mRNA expression levels of ATM, NFKB1, SOD2, INSR, and TIGAR in visceral preadipocytes (N, H), differentiated (NN, NH, HN, HH), and mature (NNN, NNH, NHN, HNN, HHH) adipocytes in normoglycemic (N, 5.5mM glucose) and hyperglycemic (H, 30 mM) milieu. Data are presented as mean±SD. Green circles mark merely normoglycemic variants (N, NN, NNN) while red squares denote overly hyperglycemic ones (H, HH, HHH) during the process of visceral adipogenesis (tested with ANOVA with post hoc Tukey’s test and marked with green and red asterisks, respectively). Black triangles denote either differentiated or mature adipocytes with single-stage hyperglycemic exposure (NH, HN, NNH, NHN, HNN). Black asterisks were used to mark significant impact of hyperglycemia measured at the stage of preadipocytes (H vs N, by two-tailed t test), differentiated and mature adipocytes (NH, HN, HH vs NN and NNH, NHN, HNN, HHH vs NNN by one-way ANOVA with post hoc Dunnett’s test). Black asterisks were also used to indicate changes occurring during normoglycemic differentiation and maturation of hyperglycemia-treated preadipocytes (H vs HN vs HNN, tested with ANOVA with post hoc Tukey’s test). Conjunct lines below the asterisks denote all significant differences between the first indicated variant on the left and subsequent variants indicated by particular segments. Significant differences are indicated accordingly to the criteria: * 0.05≥P>0.01, ** 0.01≥P>0.001, *** P≤0.001, based on −ΔCt values. The figure was generated using GraphPad Prism 6.0 (GraphPad Software Inc.).Figure 4. miRNAs expression levels in visceral preadipocytes (N, H), differentiated (NN, NH, HN, HH) and mature (NNN, NNH, NHN, HNN, HHH) adipocytes upon normoglycemic (N, 5.5 mM glucose) and hyperglycemic (H, 30 mM) milieu. Data are presented as mean±SD. Green circles mark merely normoglycemic variants (N, NN, NNN), while red squares denote overly hyperglycemic ones (H, HH, HHH) during the process of visceral adipogenesis (tested with ANOVA with post hoc Tukey’s test and marked with green and red asterisks, respectively). Black triangles denote either differentiated or mature adipocytes with single-stage hyperglycemic exposure (NH, HN, NNH, NHN, HNN). Black asterisks were used to mark significant impact of hyperglycemia measured at the stage of preadipocytes (H vs N, by two-tailed t-test), differentiated and mature adipocytes (NH, HN, HH vs NN and NNH, NHN, HNN, HHH vs NNN by one-way ANOVA with post hoc Dunnett’s test). Black asterisks were also used to indicate changes occurring during normoglycemic differentiation and maturation of hyperglycemia-treated preadipocytes (H vs HN vs HNN, tested with ANOVA with post hoc Tukey’s test). Conjunct lines below the asterisks denote all significant differences between the first indicated variant on the left and subsequent variants indicated by particular segments. Significant differences are indicated accordingly to the criteria: * 0.05≥p>0.01, ** 0.01≥p>0.001, being calculated on −ΔCt values. The figure was generated using GraphPad Prism 6.0 (GraphPad Software Inc.).Figure 5. The expression profiles of ATM, NFKB1, SOD2, INSR, and TIGAR among NGM (normal glucose metabolism), IFG (impaired fasting glucose), and T2DM (diabetic) female subjects. Statistics were based on −ΔDCt values and calculated with either one-way ANOVA with post hoc Tukey’s test or Kruskal-Wallis one-way ANOVA with post hoc Dunn’s test. Data are presented as dot plots with either mean±SD or median with interquartile range (ATM). Green dots, red squares, and blue triangles show results obtained for NGM, IFG, and T2DM females, respectively. (*) P≤0.05. The figure was generated using GraphPad Prism 6.0 (GraphPad Software Inc.).Figure 6. The expression profiles of 14 examined miRNAs among NGM (normal glucose metabolism), IFG (impaired fasting glucose), and T2DM (diabetic) subjects only. Statistics were based on −ΔCt values and calculated with either one-way ANOVA with post hoc Tukey’s test or Kruskal-Wallis one-way ANOVA with post hoc Dunn’s test. Data are presented as dot plots with either mean±SD or median with interquartile range (let-7g-5p, miR-20a-5p, miR-222-3p, miR-26b-5p, miR-374a-5p and miR-99b-5p). Green dots, red squares, and blue triangles show results obtained for NGM, IFG, and T2DM females, respectively. (*) P≤0.05. The figure was generated using GraphPad Prism 6.0 (GraphPad Software Inc.).Figure 7. Heatmap of correlations among expression levels of miRNAs and mRNAs of examined genes (−ΔCt values) for female study participants. Only significant Spearman rank correlation coefficients are presented in particular squares (P<0.05). The figure was generated using MultiExperimentViewer software, version 4.9.0 (The Perl Foundation).Figure 8. Heatmap of correlation among expression levels of miRNAs and mRNAs of examined genes (−ΔCt values) and age as well as anthropometric and biochemical parameters in female study participants. Only significant Spearman rank correlation coefficients are presented in particular squares (P<0.05). The figure was generated using MultiExperimentViewer software, version 4.9.0 (The Perl Foundation). Tables
Table 1. A list of studied miRNAs and their target genes.Table 2. A list of the studied genes and respective TaqMan assay IDs.Table 3. A list of the studied miRNAs and respective TaqMan assay IDs.Table 4. In silico analysis involving 5 upregulated miRNAs (miR-10b-5p, miR-132-3p, miR-20a-5p, miR-21-5p, and miR-26a-5p) in VAT of T2DM female subjects based on miEAA (WikiPathways, miRPathDB). Only significant records are shown (P<0.05), for at least 4 union miRNAs.Table 1. A list of studied miRNAs and their target genes.Table 2. A list of the studied genes and respective TaqMan assay IDs.Table 3. A list of the studied miRNAs and respective TaqMan assay IDs.Table 4. In silico analysis involving 5 upregulated miRNAs (miR-10b-5p, miR-132-3p, miR-20a-5p, miR-21-5p, and miR-26a-5p) in VAT of T2DM female subjects based on miEAA (WikiPathways, miRPathDB). Only significant records are shown (P<0.05), for at least 4 union miRNAs.Supplementary Table 1. Characteristics of 52 study participants. Data is presented as median with an interquartile range, while differences among 3 study groups were evaluated with Kruskal-Wallis one-way analysis of variance (ANOVA) with Dunn’s post hoc test. Study groups were as follows: NGM (normal glucose metabolism), IFG (impaired fasting glucose) and T2DM (diabetic).Supplementary Table 2. Mean or median 2^-ΔCt values found for tested miRNAs and genes in VAT of male study subjects. Median was calculated for let-7g-5p, miR-20a-5p, miR-222-3p, miR-26b-5p, miR-374a-5p, miR-99b-5p and ATM. None of tested molecules was significantly changed.Supplementary Table 3. Top 25 results of in silico analysis of 5 upregulated miRNAs in VAT of T2DM females by miRSystem. In Press
Clinical Research
Body Weight and Insulin Resistance Indicators Among ChildrenMed Sci Monit In Press; DOI: 10.12659/MSM.951434
Clinical Research
Comparison of Radiographic Cervical Sagittal Alignment Parameters in Patients With Nonspecific Neck Pain, D...Med Sci Monit In Press; DOI: 10.12659/MSM.952950
Clinical Research
Combined Fibrinogen and Urinary α1-Microglobulin as Predictors of Respiratory Tract Infection in Children w...Med Sci Monit In Press; DOI: 10.12659/MSM.951066
Database Analysis
Evaluation of Salivary Total Oxidant Status (TOS) and Total Antioxidant Status (TAS) in Orthodontic Patient...Med Sci Monit In Press; DOI: 10.12659/MSM.952052
Most Viewed Current Articles
17 Jan 2024 : Review article 14,175,576
Vaccination Guidelines for Pregnant Women: Addressing COVID-19 and the Omicron VariantDOI :10.12659/MSM.942799
Med Sci Monit 2024; 30:e942799
13 Nov 2021 : Clinical Research 3,756,620
Acceptance of COVID-19 Vaccination and Its Associated Factors Among Cancer Patients Attending the Oncology ...DOI :10.12659/MSM.932788
Med Sci Monit 2021; 27:e932788
14 Dec 2022 : Clinical Research 2,465,966
Prevalence and Variability of Allergen-Specific Immunoglobulin E in Patients with Elevated Tryptase LevelsDOI :10.12659/MSM.937990
Med Sci Monit 2022; 28:e937990
16 May 2023 : Clinical Research 708,651
Electrophysiological Testing for an Auditory Processing Disorder and Reading Performance in 54 School Stude...DOI :10.12659/MSM.940387
Med Sci Monit 2023; 29:e940387